[Python] Statistical analysis of time series
Global Statistics:
Common seen methods as such
1. Mean
2. Median
3. Standard deviation: the larger the number means it various a lot.
4. Sum.
Rolling Statistics:
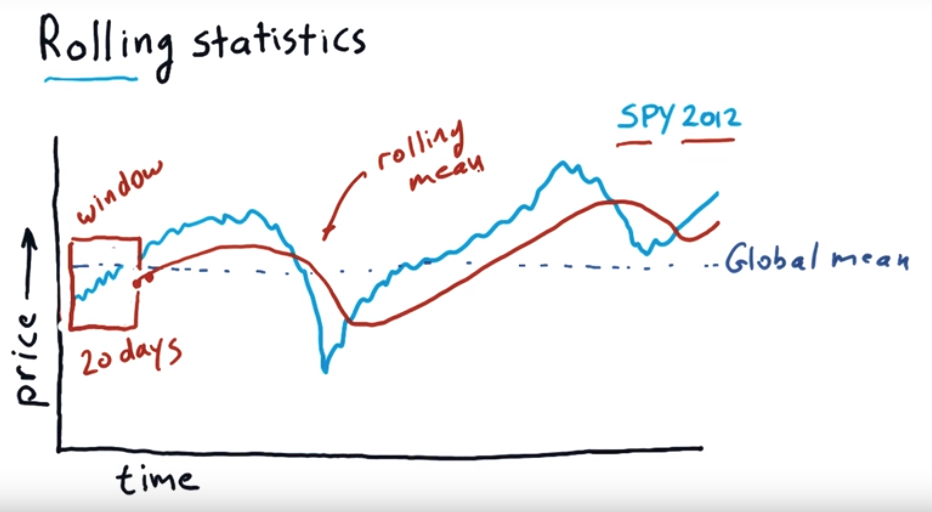
It use a time window, moving forward each day to calculate the mean value of those window periods.
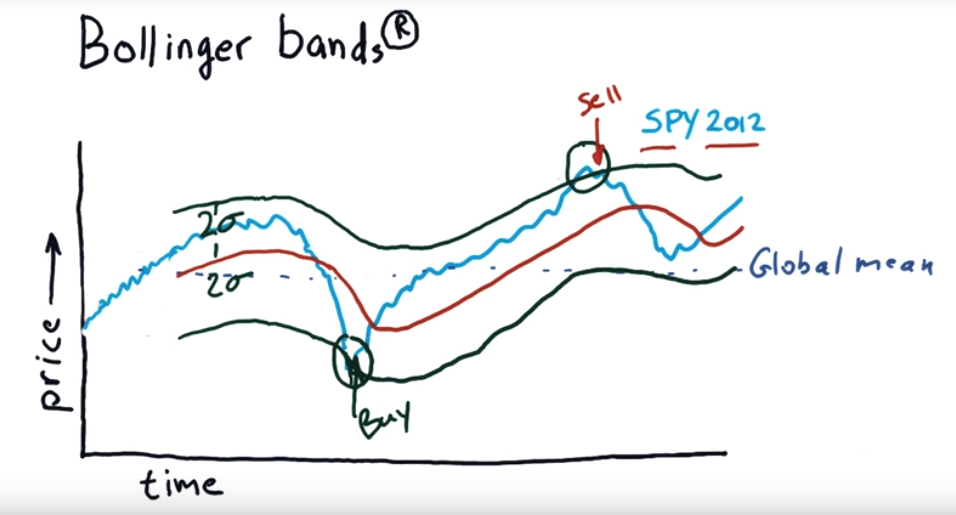
To find which day is good to buy which day is good for sell, we can use Bollinger bands.
Bollinger bands:
import os
import pandas as pd
import matplotlib.pyplot as plt def test_run():
start_date='2017-01-01'
end_data='2017-12-15'
dates=pd.date_range(start_date, end_data) # Create an empty data frame
df=pd.DataFrame(index=dates) symbols=['SPY', 'AAPL', 'IBM', 'GOOG', 'GLD']
for symbol in symbols:
temp=getAdjCloseForSymbol(symbol)
df=df.join(temp, how='inner') return df if __name__ == '__main__':
df=test_run()
# data=data.ix['2017-12-01':'2017-12-15', ['IBM', 'GOOG']]
# df=normalize_data(df)
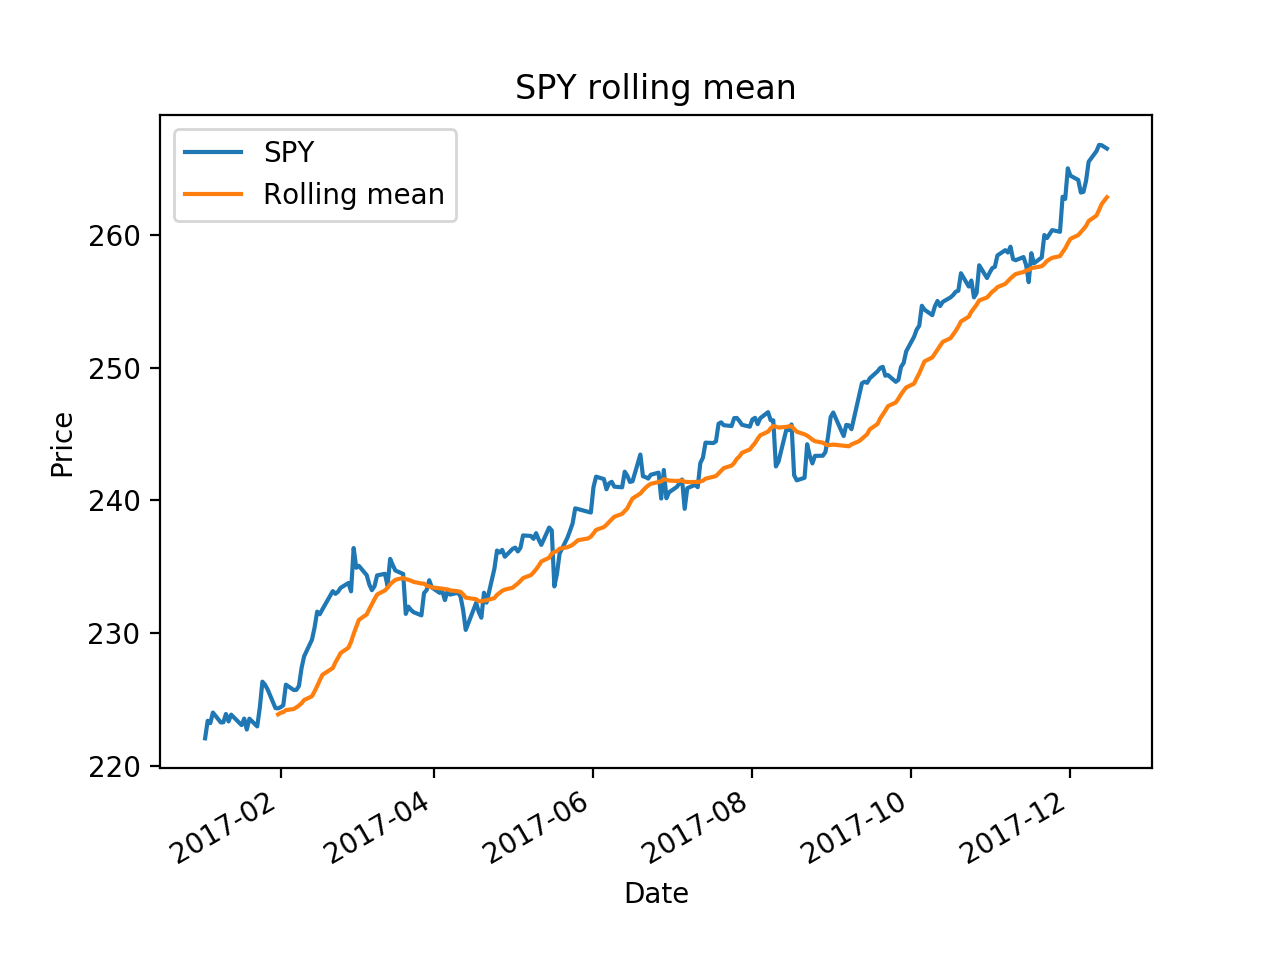
ax = df['SPY'].plot(title="SPY rolling mean", label='SPY')
rm = df['SPY'].rolling(20).mean()
rm.plot(label='Rolling mean', ax=ax)
ax.set_xlabel('Date')
ax.set_ylabel('Price')
ax.legend(loc="upper left")
plt.show()
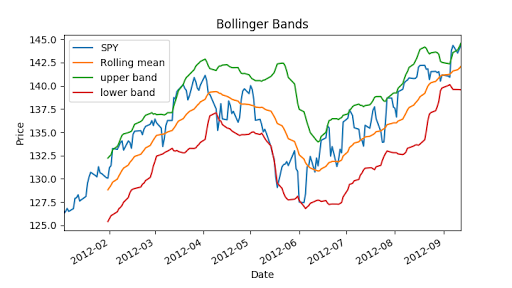
Now we can calculate Bollinger bands, it is 2 times std value.
"""Bollinger Bands."""

import os

import pandas as pd

import matplotlib.pyplot as plt

def symbol_to_path(symbol, base_dir="data"):

    """Return CSV file path given ticker symbol."""

    return os.path.join(base_dir, "{}.csv".format(str(symbol)))

def get_data(symbols, dates):

    """Read stock data (adjusted close) for given symbols from CSV files."""

    df = pd.DataFrame(index=dates)

    if 'SPY' not in symbols:  # add SPY for reference, if absent

        symbols.insert(0, 'SPY')

    for symbol in symbols:

        df_temp = pd.read_csv(symbol_to_path(symbol), index_col='Date',

                parse_dates=True, usecols=['Date', 'Adj Close'], na_values=['nan'])

        df_temp = df_temp.rename(columns={'Adj Close': symbol})

        df = df.join(df_temp)

        if symbol == 'SPY':  # drop dates SPY did not trade

            df = df.dropna(subset=["SPY"])

    return df

def plot_data(df, title="Stock prices"):

    """Plot stock prices with a custom title and meaningful axis labels."""

    ax = df.plot(title=title, fontsize=12)

    ax.set_xlabel("Date")

    ax.set_ylabel("Price")

    plt.show()

def get_rolling_mean(values, window):

    """Return rolling mean of given values, using specified window size."""

    return values.rolling(window=window).mean()

def get_rolling_std(values, window):

    """Return rolling standard deviation of given values, using specified window size."""

    # TODO: Compute and return rolling standard deviation

    return values.rolling(window=window).std()

def get_bollinger_bands(rm, rstd):

    """Return upper and lower Bollinger Bands."""

    # TODO: Compute upper_band and lower_band

    upper_band = rstd * 2 + rm

    lower_band =  rm - rstd * 2

    return upper_band, lower_band

def test_run():

    # Read data

    dates = pd.date_range('2012-01-01', '2012-12-31')

    symbols = ['SPY']

    df = get_data(symbols, dates)

    # Compute Bollinger Bands

    # 1. Compute rolling mean

    rm_SPY = get_rolling_mean(df['SPY'], window=20)

    # 2. Compute rolling standard deviation

    rstd_SPY = get_rolling_std(df['SPY'], window=20)

    # 3. Compute upper and lower bands

    upper_band, lower_band = get_bollinger_bands(rm_SPY, rstd_SPY)

    # Plot raw SPY values, rolling mean and Bollinger Bands

    ax = df['SPY'].plot(title="Bollinger Bands", label='SPY')

    rm_SPY.plot(label='Rolling mean', ax=ax)

    upper_band.plot(label='upper band', ax=ax)

    lower_band.plot(label='lower band', ax=ax)

    # Add axis labels and legend

    ax.set_xlabel("Date")

    ax.set_ylabel("Price")

    ax.legend(loc='upper left')

    plt.show()

if __name__ == "__main__":

    test_run()
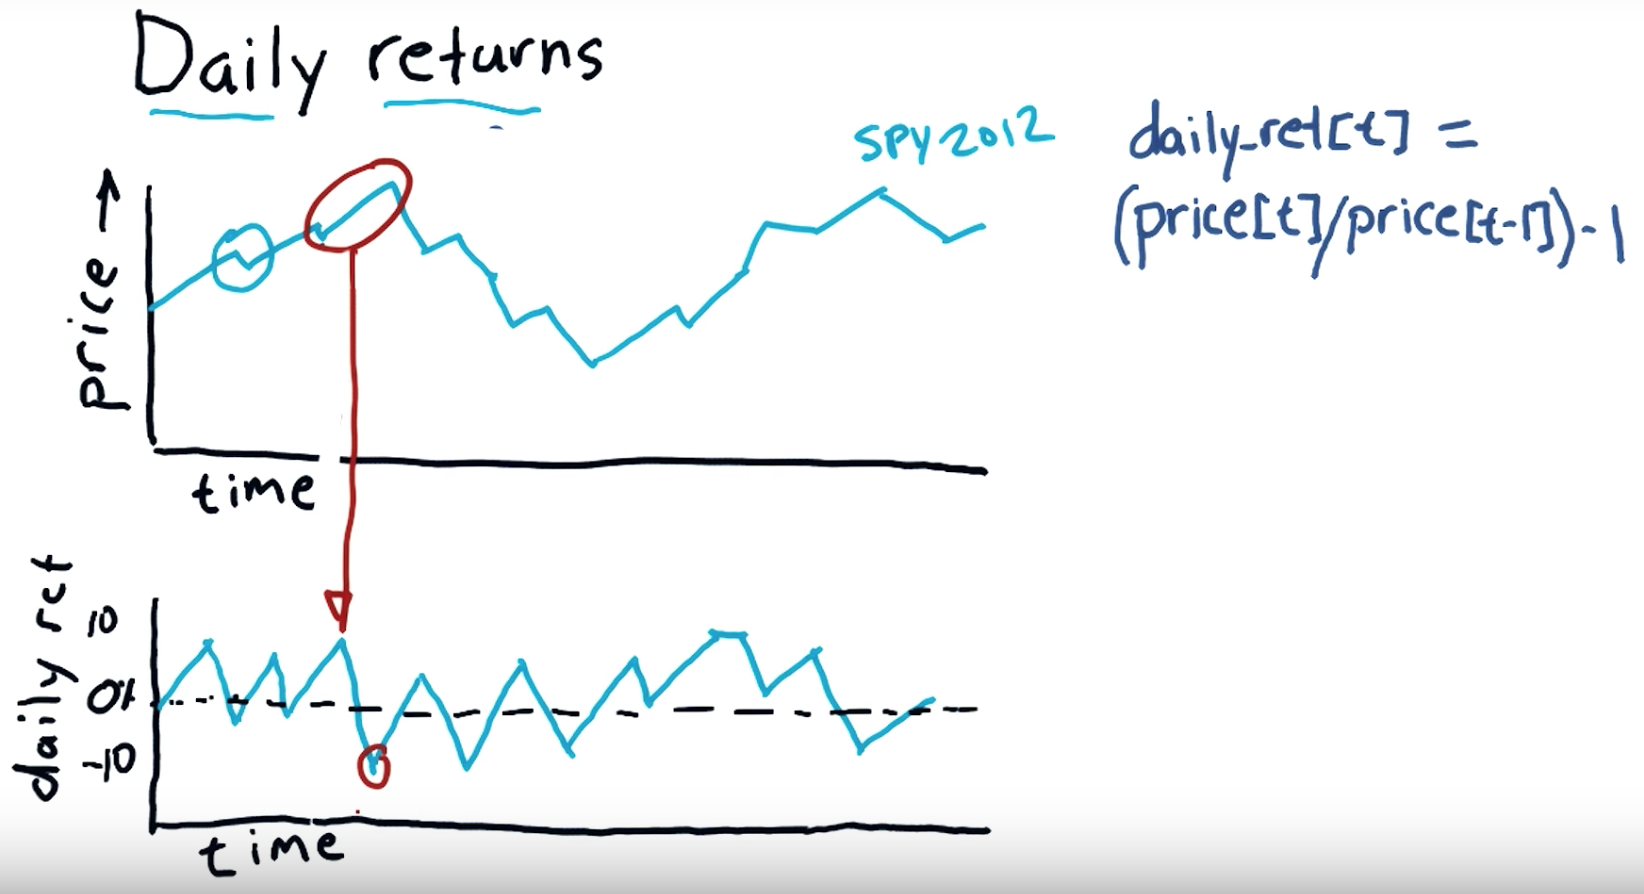
Daily return:
Subtract the previous day's closing price from the most recent day's closing price. In this example, subtract $35.50 from $36.75 to get $1.25. Divide your Step 4 result by the previous day's closing price to calculate the daily return. Multiply this result by 100 to convert it to a percentage.
"""Compute daily returns.""" import os
import pandas as pd
import matplotlib.pyplot as plt def symbol_to_path(symbol, base_dir="data"):
"""Return CSV file path given ticker symbol."""
return os.path.join(base_dir, "{}.csv".format(str(symbol))) def get_data(symbols, dates):
"""Read stock data (adjusted close) for given symbols from CSV files."""
df = pd.DataFrame(index=dates)
if 'SPY' not in symbols: # add SPY for reference, if absent
symbols.insert(0, 'SPY') for symbol in symbols:
df_temp = pd.read_csv(symbol_to_path(symbol), index_col='Date',
parse_dates=True, usecols=['Date', 'Adj Close'], na_values=['nan'])
df_temp = df_temp.rename(columns={'Adj Close': symbol})
df = df.join(df_temp)
if symbol == 'SPY': # drop dates SPY did not trade
df = df.dropna(subset=["SPY"]) return df def plot_data(df, title="Stock prices", xlabel="Date", ylabel="Price"):
"""Plot stock prices with a custom title and meaningful axis labels."""
ax = df.plot(title=title, fontsize=12)
ax.set_xlabel(xlabel)
ax.set_ylabel(ylabel)
plt.show() def compute_daily_returns(df):
"""Compute and return the daily return values."""
# TODO: Your code here
# Note: Returned DataFrame must have the same number of rows
return df / df.shift(-1) -1 def test_run():
# Read data
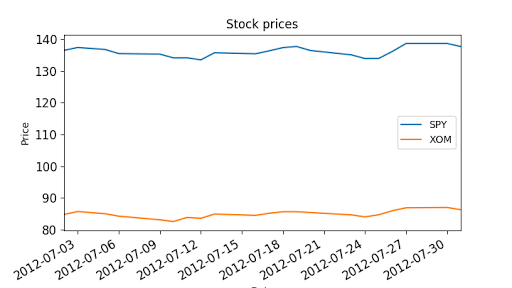
dates = pd.date_range('2012-07-01', '2012-07-31') # one month only
symbols = ['SPY','XOM']
df = get_data(symbols, dates)
plot_data(df) # Compute daily returns
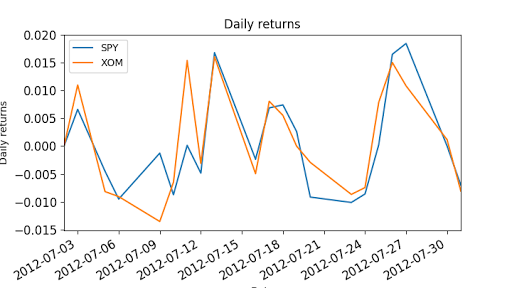
daily_returns = compute_daily_returns(df)
plot_data(daily_returns, title="Daily returns", ylabel="Daily returns") if __name__ == "__main__":
test_run()
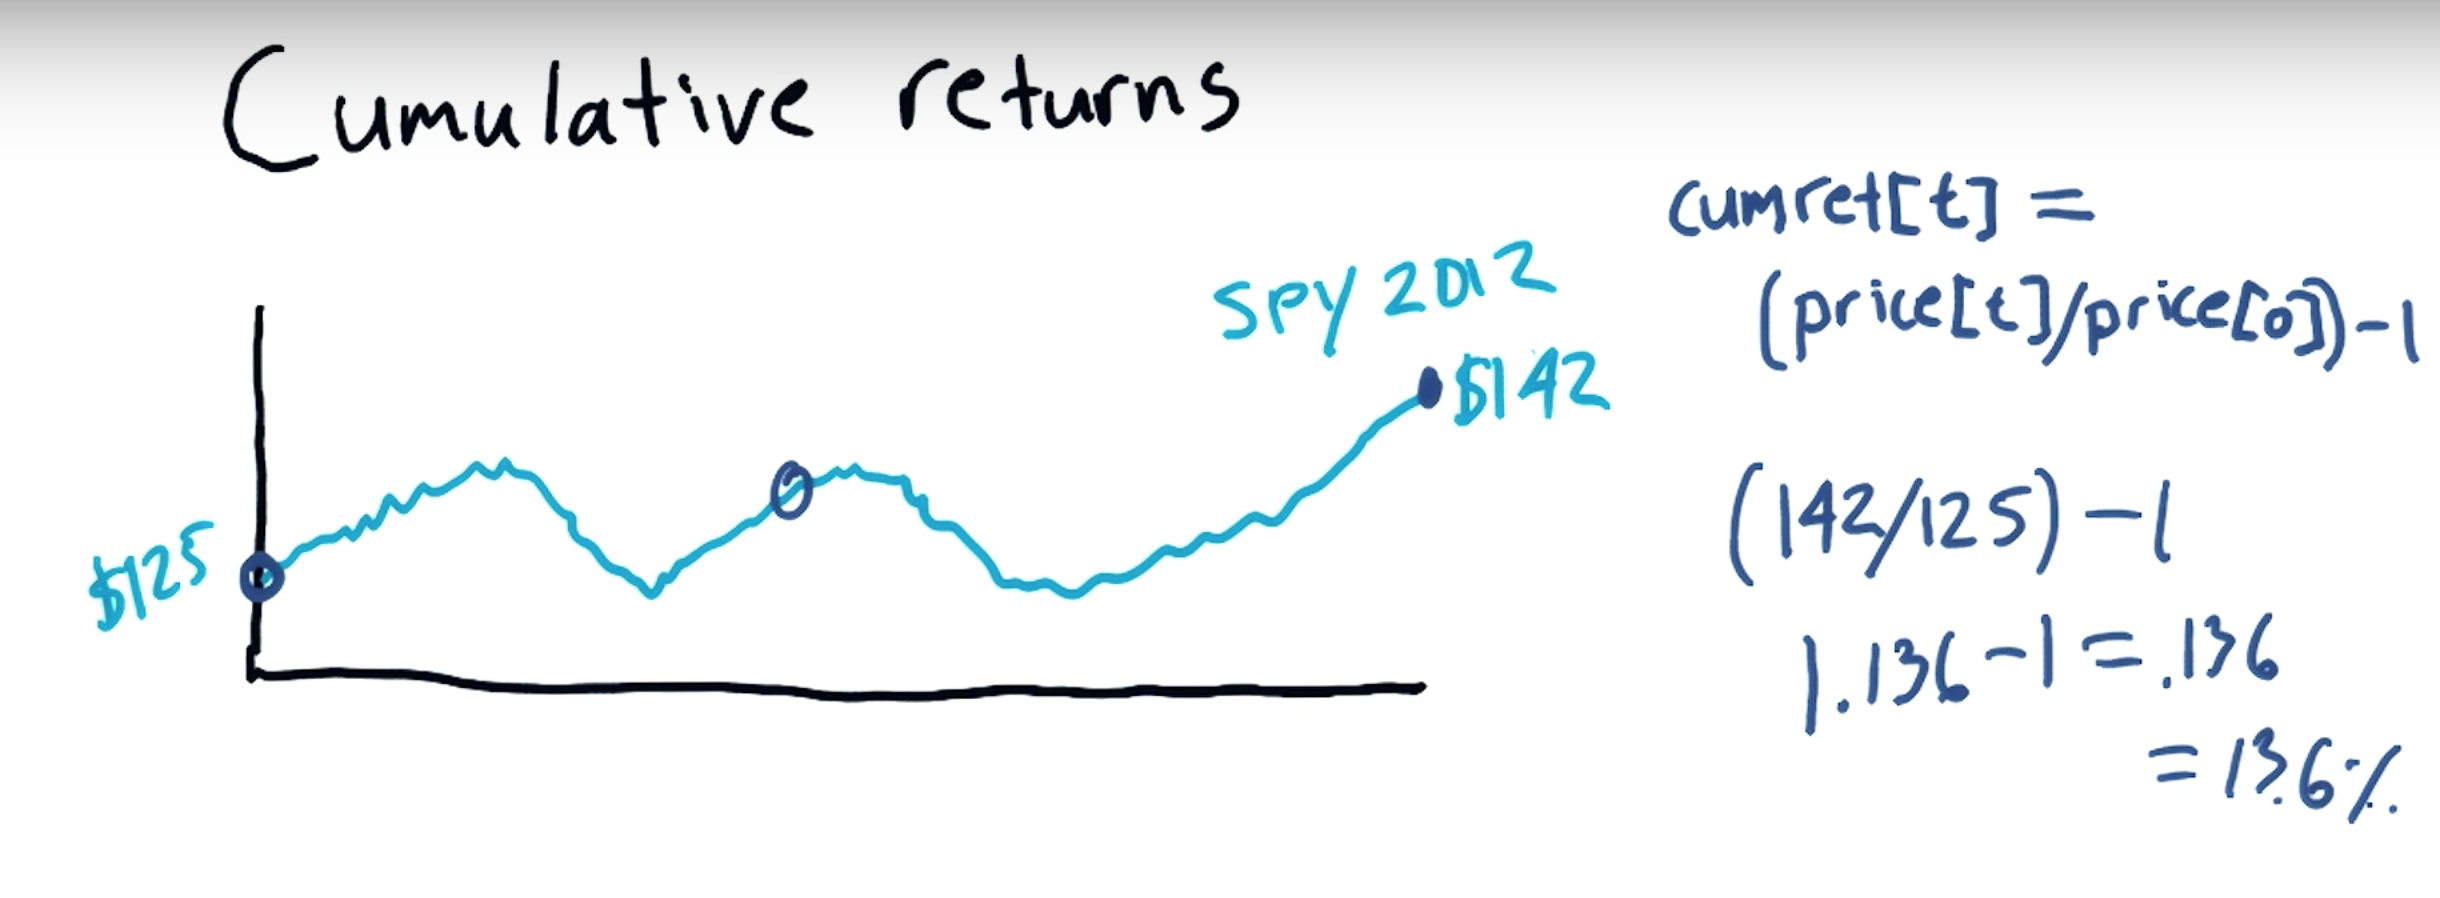
Cumulative return:
an investment relative to the principal amount invested over a specified amount of time. ... To calculate cumulative return, subtract the original price of the investment from the current price and divide that difference by the original price.
[Python] Statistical analysis of time series的更多相关文章
- How-to: Do Statistical Analysis with Impala and R
sklearn实战-乳腺癌细胞数据挖掘(博客主亲自录制视频教程) https://study.163.com/course/introduction.htm?courseId=1005269003&a ...
- python data analysis | python数据预处理(基于scikit-learn模块)
原文:http://www.jianshu.com/p/94516a58314d Dataset transformations| 数据转换 Combining estimators|组合学习器 Fe ...
- python学习笔记—DataFrame和Series的排序
更多大数据分析.建模等内容请关注公众号<bigdatamodeling> ################################### 排序 ################## ...
- Should You Build Your Own Backtester?
By Michael Halls-Moore on August 2nd, 2016 This post relates to a talk I gave in April at QuantCon 2 ...
- Python数据分析工具:Pandas之Series
Python数据分析工具:Pandas之Series Pandas概述Pandas是Python的一个数据分析包,该工具为解决数据分析任务而创建.Pandas纳入大量库和标准数据模型,提供高效的操作数 ...
- 用 Python 通过马尔可夫随机场(MRF)与 Ising Model 进行二值图降噪
前言 这个降噪的模型来自 Christopher M. Bishop 的 Pattern Recognition And Machine Learning (就是神书 PRML……),问题是如何对一个 ...
- 大数据分析与机器学习领域Python兵器谱
http://www.thebigdata.cn/JieJueFangAn/13317.html 曾经因为NLTK的缘故开始学习Python,之后渐渐成为我工作中的第一辅助脚本语言,虽然开发语言是C/ ...
- Machine and Deep Learning with Python
Machine and Deep Learning with Python Education Tutorials and courses Supervised learning superstiti ...
- Python 网页爬虫 & 文本处理 & 科学计算 & 机器学习 & 数据挖掘兵器谱(转)
原文:http://www.52nlp.cn/python-网页爬虫-文本处理-科学计算-机器学习-数据挖掘 曾经因为NLTK的缘故开始学习Python,之后渐渐成为我工作中的第一辅助脚本语言,虽然开 ...
随机推荐
- 查看锁表进程SQL语句
查看锁表进程SQL语句 set pagesize 999 set line180 col ORACLE_USERNAME for a18 col OS_USER_NAME for a18 col ...
- 洛谷P3369 【模板】普通平衡树 01trie/骚操作
Code: #include <cstdio> #include <algorithm> #include <cstring> #define setIO(s) f ...
- [转载]PyCharm创建.py自动添加文件头注释
转自:https://blog.csdn.net/qq_36482772/article/details/67218214 创建.py文件时 顺便自动添加作者.时间.文件名信息…… mac系统打开编辑 ...
- 《Craking the Coding interview》python实现---02
###题目:翻转一个字符串###思路:从字符串的最后一位开始,依次取###实现:伪代码.函数.类实现#伪代码: #01string=sNew_s=""for i in range( ...
- POJ 3074 Sudoku DLX精确覆盖
DLX精确覆盖.....模版题 Sudoku Time Limit: 1000MS Memory Limit: 65536K Total Submissions: 8336 Accepted: ...
- 【金阳光測试】基于控件核心技术探讨---Android自己主动化系列(2)---2013年5月
第一讲分享了下安卓自己主动化一些概况和一些自己主动化框架现状和技术可以解决什么样的问题. 这次课就深入到android世界里面.遨游.翱翔.深入了解自己主动化測试核心技术. 搞过编程开发的同学听到in ...
- extjs Combox 调用数据
1方法一 从 json获取 var typeStore = new Ext.data.Store({ proxy : new Ext.data.HttpProxy({u ...
- [JZOJ3385] [NOIP2013模拟] 黑魔法师之门 解题报告(并查集)
Description 经过了16个工作日的紧张忙碌,未来的人类终于收集到了足够的能源.然而在与Violet星球的战争中,由于Z副官的愚蠢,地球的领袖applepi被邪恶的黑魔法师Vani囚禁在了Vi ...
- MySQL的登录和退出(五)
如何使用MySQL? 如何实现MySQL的登录/退出 如何修改MySQL的提示符 如何实现MySQL的常用命令 如何规范MySQL语句 如何操作数据库 1.MYSQL常用参数及功能 mysql -V ...
- Scala基础简述
* Scala基础简述 本文章作为Scala快速学习的教程,前提环境是:我假设在此之前,你已经学会了Java编程语言,并且我们以随学随用为目标(在此不会深度挖掘探讨Scala更高级层次的知识).其中语 ...