[Python] Statistical analysis of time series
Global Statistics:
Common seen methods as such
1. Mean
2. Median
3. Standard deviation: the larger the number means it various a lot.
4. Sum.
Rolling Statistics:
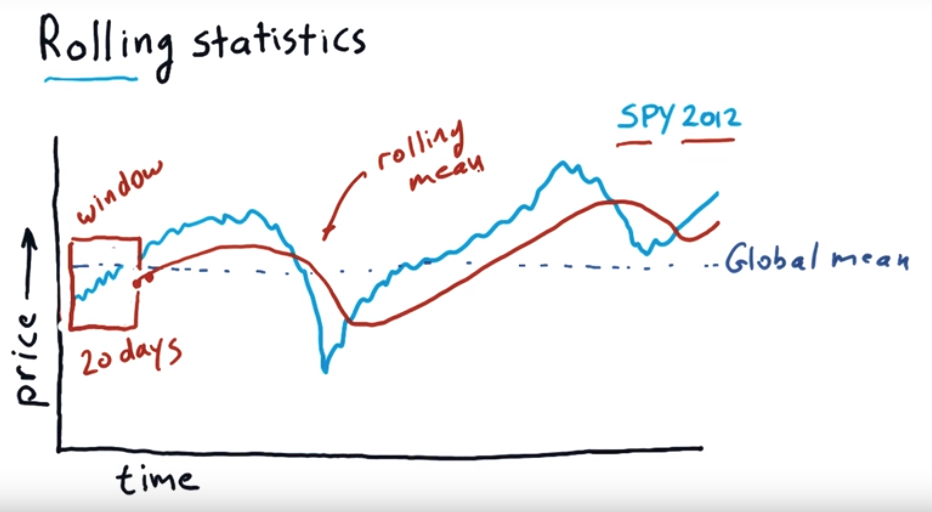
It use a time window, moving forward each day to calculate the mean value of those window periods.
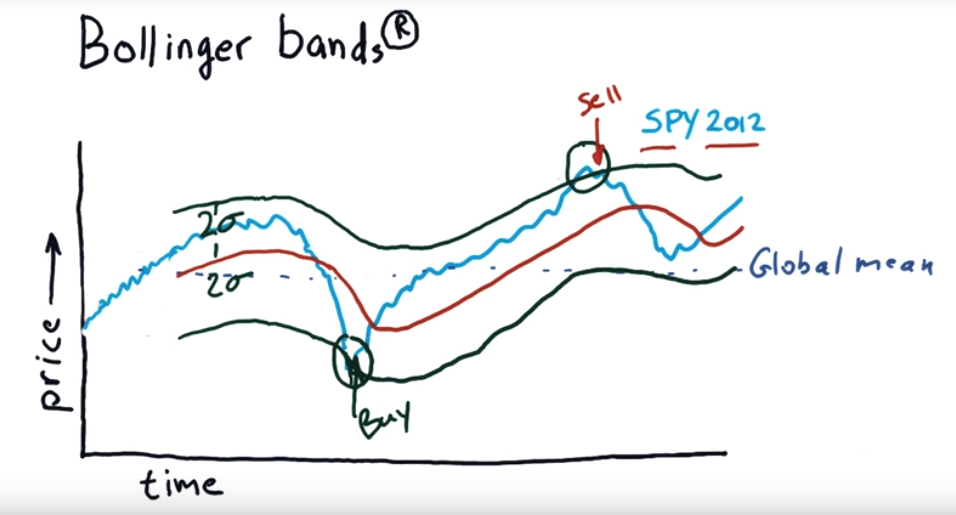
To find which day is good to buy which day is good for sell, we can use Bollinger bands.
Bollinger bands:
import os
import pandas as pd
import matplotlib.pyplot as plt def test_run():
start_date='2017-01-01'
end_data='2017-12-15'
dates=pd.date_range(start_date, end_data) # Create an empty data frame
df=pd.DataFrame(index=dates) symbols=['SPY', 'AAPL', 'IBM', 'GOOG', 'GLD']
for symbol in symbols:
temp=getAdjCloseForSymbol(symbol)
df=df.join(temp, how='inner') return df if __name__ == '__main__':
df=test_run()
# data=data.ix['2017-12-01':'2017-12-15', ['IBM', 'GOOG']]
# df=normalize_data(df)
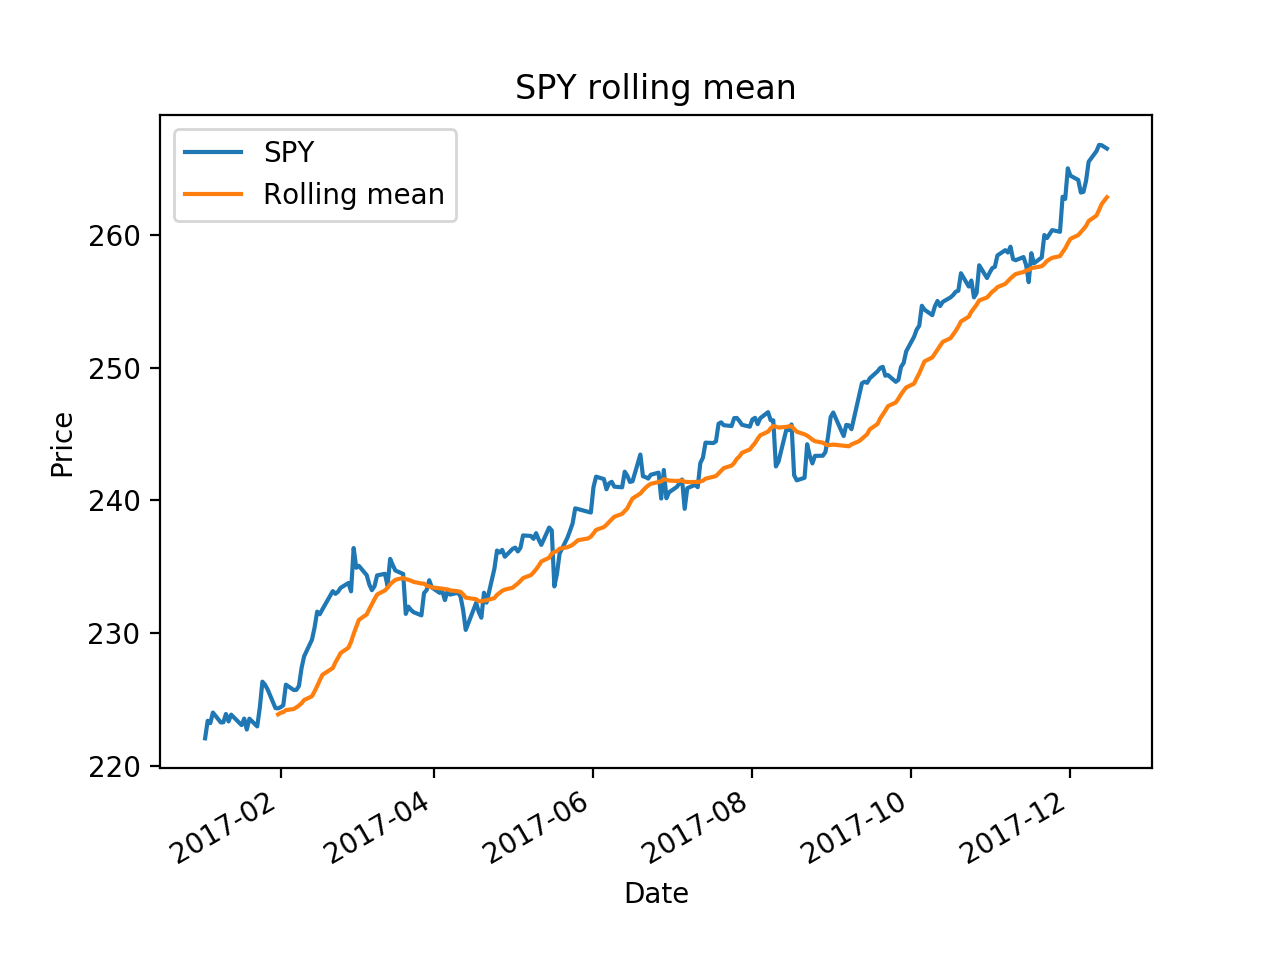
ax = df['SPY'].plot(title="SPY rolling mean", label='SPY')
rm = df['SPY'].rolling(20).mean()
rm.plot(label='Rolling mean', ax=ax)
ax.set_xlabel('Date')
ax.set_ylabel('Price')
ax.legend(loc="upper left")
plt.show()
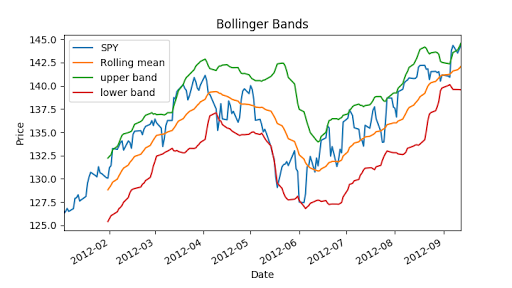
Now we can calculate Bollinger bands, it is 2 times std value.
"""Bollinger Bands."""

import os

import pandas as pd

import matplotlib.pyplot as plt

def symbol_to_path(symbol, base_dir="data"):

    """Return CSV file path given ticker symbol."""

    return os.path.join(base_dir, "{}.csv".format(str(symbol)))

def get_data(symbols, dates):

    """Read stock data (adjusted close) for given symbols from CSV files."""

    df = pd.DataFrame(index=dates)

    if 'SPY' not in symbols:  # add SPY for reference, if absent

        symbols.insert(0, 'SPY')

    for symbol in symbols:

        df_temp = pd.read_csv(symbol_to_path(symbol), index_col='Date',

                parse_dates=True, usecols=['Date', 'Adj Close'], na_values=['nan'])

        df_temp = df_temp.rename(columns={'Adj Close': symbol})

        df = df.join(df_temp)

        if symbol == 'SPY':  # drop dates SPY did not trade

            df = df.dropna(subset=["SPY"])

    return df

def plot_data(df, title="Stock prices"):

    """Plot stock prices with a custom title and meaningful axis labels."""

    ax = df.plot(title=title, fontsize=12)

    ax.set_xlabel("Date")

    ax.set_ylabel("Price")

    plt.show()

def get_rolling_mean(values, window):

    """Return rolling mean of given values, using specified window size."""

    return values.rolling(window=window).mean()

def get_rolling_std(values, window):

    """Return rolling standard deviation of given values, using specified window size."""

    # TODO: Compute and return rolling standard deviation

    return values.rolling(window=window).std()

def get_bollinger_bands(rm, rstd):

    """Return upper and lower Bollinger Bands."""

    # TODO: Compute upper_band and lower_band

    upper_band = rstd * 2 + rm

    lower_band =  rm - rstd * 2

    return upper_band, lower_band

def test_run():

    # Read data

    dates = pd.date_range('2012-01-01', '2012-12-31')

    symbols = ['SPY']

    df = get_data(symbols, dates)

    # Compute Bollinger Bands

    # 1. Compute rolling mean

    rm_SPY = get_rolling_mean(df['SPY'], window=20)

    # 2. Compute rolling standard deviation

    rstd_SPY = get_rolling_std(df['SPY'], window=20)

    # 3. Compute upper and lower bands

    upper_band, lower_band = get_bollinger_bands(rm_SPY, rstd_SPY)

    # Plot raw SPY values, rolling mean and Bollinger Bands

    ax = df['SPY'].plot(title="Bollinger Bands", label='SPY')

    rm_SPY.plot(label='Rolling mean', ax=ax)

    upper_band.plot(label='upper band', ax=ax)

    lower_band.plot(label='lower band', ax=ax)

    # Add axis labels and legend

    ax.set_xlabel("Date")

    ax.set_ylabel("Price")

    ax.legend(loc='upper left')

    plt.show()

if __name__ == "__main__":

    test_run()
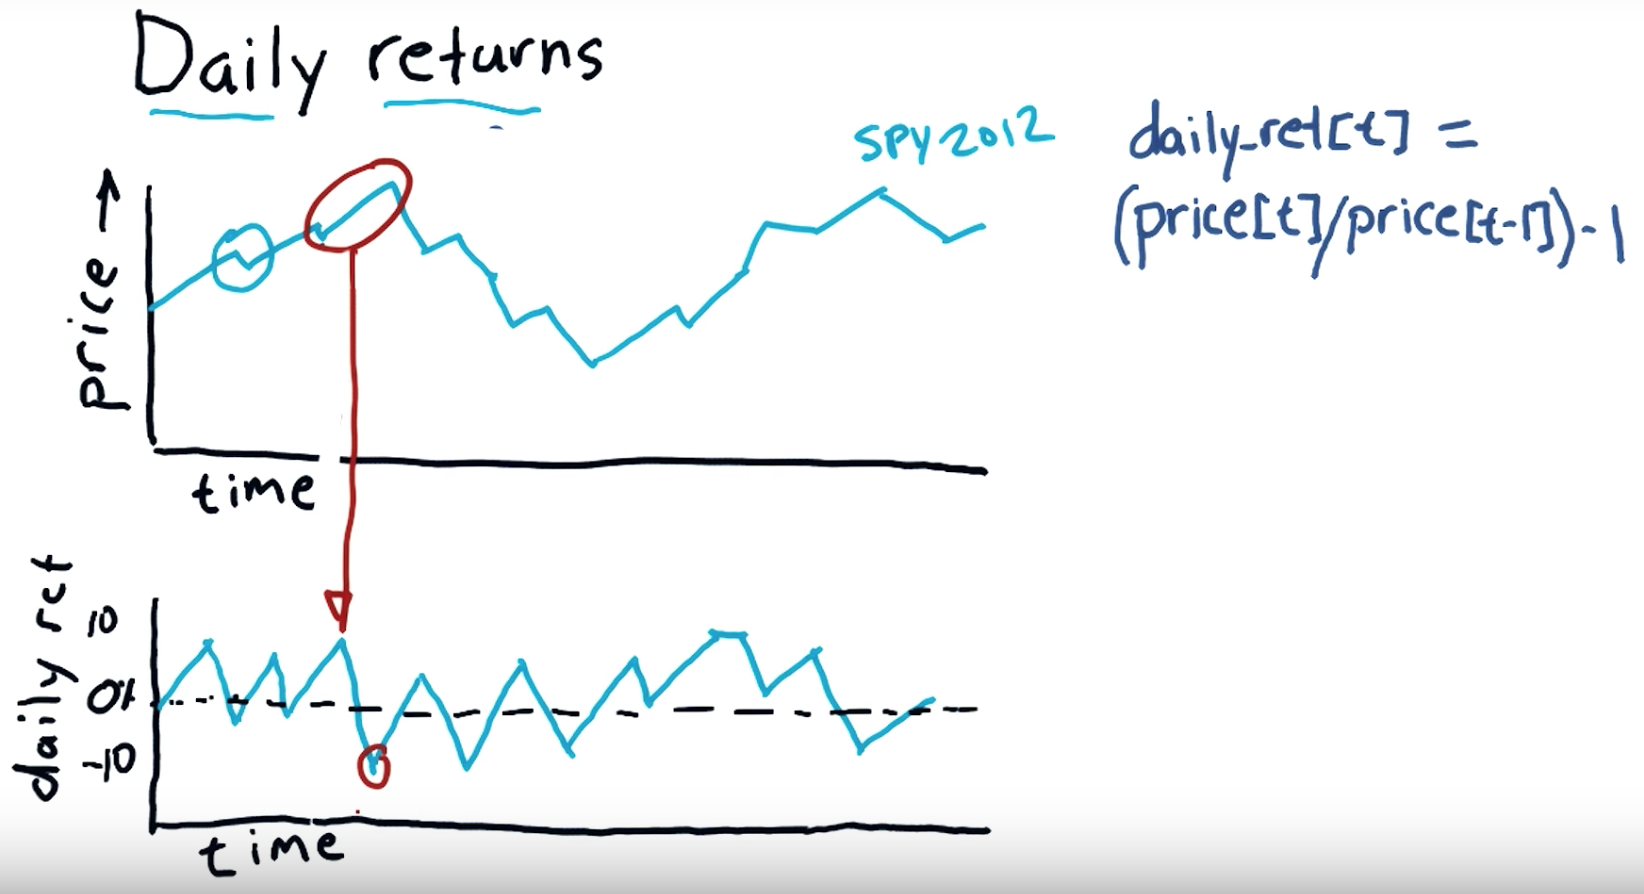
Daily return:
Subtract the previous day's closing price from the most recent day's closing price. In this example, subtract $35.50 from $36.75 to get $1.25. Divide your Step 4 result by the previous day's closing price to calculate the daily return. Multiply this result by 100 to convert it to a percentage.
"""Compute daily returns.""" import os
import pandas as pd
import matplotlib.pyplot as plt def symbol_to_path(symbol, base_dir="data"):
"""Return CSV file path given ticker symbol."""
return os.path.join(base_dir, "{}.csv".format(str(symbol))) def get_data(symbols, dates):
"""Read stock data (adjusted close) for given symbols from CSV files."""
df = pd.DataFrame(index=dates)
if 'SPY' not in symbols: # add SPY for reference, if absent
symbols.insert(0, 'SPY') for symbol in symbols:
df_temp = pd.read_csv(symbol_to_path(symbol), index_col='Date',
parse_dates=True, usecols=['Date', 'Adj Close'], na_values=['nan'])
df_temp = df_temp.rename(columns={'Adj Close': symbol})
df = df.join(df_temp)
if symbol == 'SPY': # drop dates SPY did not trade
df = df.dropna(subset=["SPY"]) return df def plot_data(df, title="Stock prices", xlabel="Date", ylabel="Price"):
"""Plot stock prices with a custom title and meaningful axis labels."""
ax = df.plot(title=title, fontsize=12)
ax.set_xlabel(xlabel)
ax.set_ylabel(ylabel)
plt.show() def compute_daily_returns(df):
"""Compute and return the daily return values."""
# TODO: Your code here
# Note: Returned DataFrame must have the same number of rows
return df / df.shift(-1) -1 def test_run():
# Read data
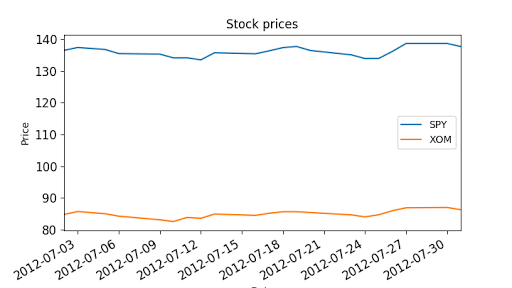
dates = pd.date_range('2012-07-01', '2012-07-31') # one month only
symbols = ['SPY','XOM']
df = get_data(symbols, dates)
plot_data(df) # Compute daily returns
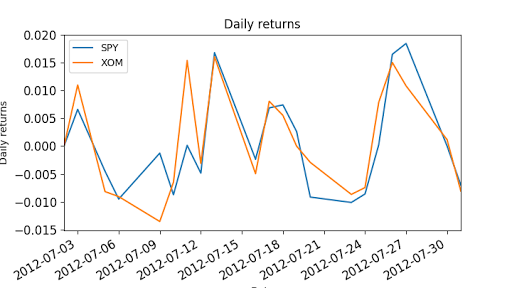
daily_returns = compute_daily_returns(df)
plot_data(daily_returns, title="Daily returns", ylabel="Daily returns") if __name__ == "__main__":
test_run()
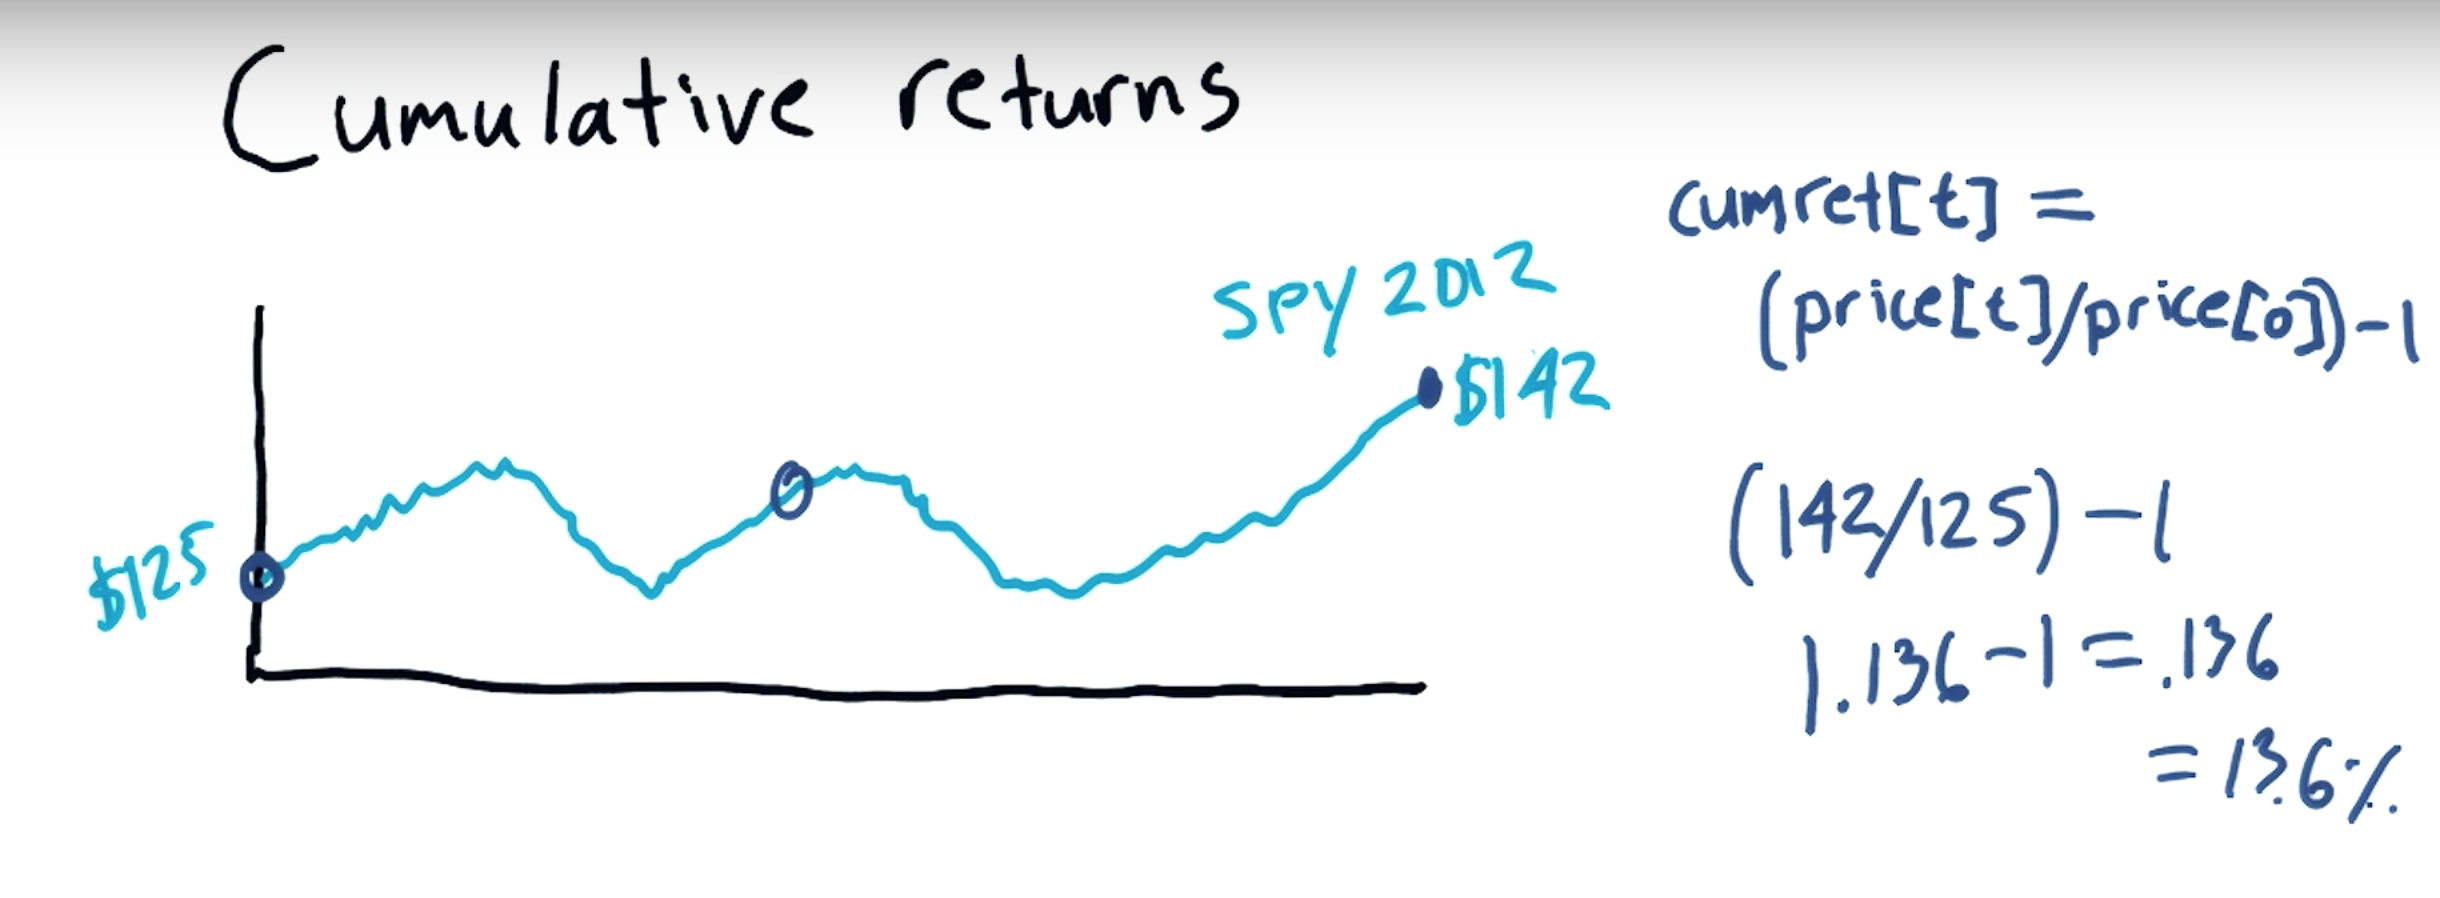
Cumulative return:
an investment relative to the principal amount invested over a specified amount of time. ... To calculate cumulative return, subtract the original price of the investment from the current price and divide that difference by the original price.
[Python] Statistical analysis of time series的更多相关文章
- How-to: Do Statistical Analysis with Impala and R
sklearn实战-乳腺癌细胞数据挖掘(博客主亲自录制视频教程) https://study.163.com/course/introduction.htm?courseId=1005269003&a ...
- python data analysis | python数据预处理(基于scikit-learn模块)
原文:http://www.jianshu.com/p/94516a58314d Dataset transformations| 数据转换 Combining estimators|组合学习器 Fe ...
- python学习笔记—DataFrame和Series的排序
更多大数据分析.建模等内容请关注公众号<bigdatamodeling> ################################### 排序 ################## ...
- Should You Build Your Own Backtester?
By Michael Halls-Moore on August 2nd, 2016 This post relates to a talk I gave in April at QuantCon 2 ...
- Python数据分析工具:Pandas之Series
Python数据分析工具:Pandas之Series Pandas概述Pandas是Python的一个数据分析包,该工具为解决数据分析任务而创建.Pandas纳入大量库和标准数据模型,提供高效的操作数 ...
- 用 Python 通过马尔可夫随机场(MRF)与 Ising Model 进行二值图降噪
前言 这个降噪的模型来自 Christopher M. Bishop 的 Pattern Recognition And Machine Learning (就是神书 PRML……),问题是如何对一个 ...
- 大数据分析与机器学习领域Python兵器谱
http://www.thebigdata.cn/JieJueFangAn/13317.html 曾经因为NLTK的缘故开始学习Python,之后渐渐成为我工作中的第一辅助脚本语言,虽然开发语言是C/ ...
- Machine and Deep Learning with Python
Machine and Deep Learning with Python Education Tutorials and courses Supervised learning superstiti ...
- Python 网页爬虫 & 文本处理 & 科学计算 & 机器学习 & 数据挖掘兵器谱(转)
原文:http://www.52nlp.cn/python-网页爬虫-文本处理-科学计算-机器学习-数据挖掘 曾经因为NLTK的缘故开始学习Python,之后渐渐成为我工作中的第一辅助脚本语言,虽然开 ...
随机推荐
- linux系统利用GPU跑数据(tensorflow)
https://blog.csdn.net/qq_26591517/article/details/82469680 查看机器上GPU情况 命令: nvidia-smi 功能:显示机器上gpu的情况 ...
- Golang 中的 面向对象: 方法, 类, 方法继承, 接口, 多态的简单描述与实现
前言: Golang 相似与C语言, 基础语法与C基本一致,除了广受争议的 左花括号 必须与代码同行的问题, 别的基本差不多; 学会了C, 基本上万变不离其宗, 现在的高级语言身上都能看到C的影子; ...
- 全国所有省市县地理坐标Json格式
https://www.cnblogs.com/yzbubble/p/7707129.html
- vue列表数据倒计时存在的一些坑
vue 列表数据倒计时,在页面销毁前需要清除定时器,否着会报错. export default { data() { return { list: [] } }, mounted() { for (l ...
- UVA-1347 Tour 动态规划 难以确定的状态
题目链接:https://cn.vjudge.net/problem/UVA-1347 题意 给出按x坐标排序的几个点. 欲从最左边不回头的走到最右边,然后再返回最左边. 每个点都要被访问,且只能经过 ...
- docker-ce-17.03.2 离线安装RPM包
[root@docker05 docker]# ll total 20796 -rw-r--r-- 1 root root 75032 Mar 26 23:52 audit-libs-pytho ...
- 紫书 例题 10-1 UVa 11582 (unsigned long long+模)
(1)这道题要用到 unsigned long long, 弄了我好久 这道题范围可以达到2的64次方-1, 而long long 最多到2的63次方-1, 而unsigned long long可以 ...
- Camera Calibration 相机标定:原理简介(二)
2 针孔相机模型 常见的相机标定中,使用的相机多为针孔相机(Pinhole camera),也就是大家熟知的小孔成像理论.将其中涉及的坐标系之间的相互转换抽离出来,即为针孔相机模型的核心. 上图所示的 ...
- gdb与信号
http://simohayha.iteye.com/blog/493091 gdb可以监测在你的程序中的任何信号. 主要靠的命令是: handle signal [keywords...] 这里的k ...
- Python Tkinter 基础控件学习
# -*- coding: utf-8 -*- from Tkinter import * def btn_click(): b2['text'] = 'clicked' evalue = e.get ...