8. exporter
- 一、已经实现的收集器
- 1.1 可收集的内存指标
- 1.2 可收集的jetty指标
- 二、自定义收集
- 2.1 summer
- 2.2 histogram
- 三、架构设计
exporter作为Prometheus的探针,起到采集指标数据的功能。详细介绍可通过管网查询,此处不做累述,本文主要是在学习调研过程中将一些核心部分记录,供以后查询所用。
一、已经实现的收集器
1.1 可收集的内存指标


  1 # HELP jvm_buffer_pool_used_bytes Used bytes of a given JVM buffer pool.

  2 # TYPE jvm_buffer_pool_used_bytes gauge

  3 jvm_buffer_pool_used_bytes{pool="direct",} 8208.0

  4 jvm_buffer_pool_used_bytes{pool="mapped",} 0.0

  5 # HELP jvm_buffer_pool_capacity_bytes Bytes capacity of a given JVM buffer pool.

  6 # TYPE jvm_buffer_pool_capacity_bytes gauge

  7 jvm_buffer_pool_capacity_bytes{pool="direct",} 8208.0

  8 jvm_buffer_pool_capacity_bytes{pool="mapped",} 0.0

  9 # HELP jvm_buffer_pool_used_buffers Used buffers of a given JVM buffer pool.

 10 # TYPE jvm_buffer_pool_used_buffers gauge

 11 jvm_buffer_pool_used_buffers{pool="direct",} 2.0

 12 jvm_buffer_pool_used_buffers{pool="mapped",} 0.0

 13 # HELP jvm_threads_current Current thread count of a JVM

 14 # TYPE jvm_threads_current gauge

 15 jvm_threads_current 9.0

 16 # HELP jvm_threads_daemon Daemon thread count of a JVM

 17 # TYPE jvm_threads_daemon gauge

 18 jvm_threads_daemon 6.0

 19 # HELP jvm_threads_peak Peak thread count of a JVM

 20 # TYPE jvm_threads_peak gauge

 21 jvm_threads_peak 9.0

 22 # HELP jvm_threads_started_total Started thread count of a JVM

 23 # TYPE jvm_threads_started_total counter

 24 jvm_threads_started_total 10.0

 25 # HELP jvm_threads_deadlocked Cycles of JVM-threads that are in deadlock waiting to acquire object monitors or ownable synchronizers

 26 # TYPE jvm_threads_deadlocked gauge

 27 jvm_threads_deadlocked 0.0

 28 # HELP jvm_threads_deadlocked_monitor Cycles of JVM-threads that are in deadlock waiting to acquire object monitors

 29 # TYPE jvm_threads_deadlocked_monitor gauge

 30 jvm_threads_deadlocked_monitor 0.0

 31 # HELP jvm_threads_state Current count of threads by state

 32 # TYPE jvm_threads_state gauge

 33 jvm_threads_state{state="BLOCKED",} 0.0

 34 jvm_threads_state{state="TIMED_WAITING",} 1.0

 35 jvm_threads_state{state="WAITING",} 2.0

 36 jvm_threads_state{state="RUNNABLE",} 6.0

 37 jvm_threads_state{state="TERMINATED",} 0.0

 38 jvm_threads_state{state="NEW",} 0.0

 39 # HELP jvm_memory_pool_allocated_bytes_total Total bytes allocated in a given JVM memory pool. Only updated after GC, not continuously.

 40 # TYPE jvm_memory_pool_allocated_bytes_total counter

 41 # HELP jvm_gc_collection_seconds Time spent in a given JVM garbage collector in seconds.

 42 # TYPE jvm_gc_collection_seconds summary

 43 jvm_gc_collection_seconds_count{gc="PS Scavenge",} 0.0

 44 jvm_gc_collection_seconds_sum{gc="PS Scavenge",} 0.0

 45 jvm_gc_collection_seconds_count{gc="PS MarkSweep",} 0.0

 46 jvm_gc_collection_seconds_sum{gc="PS MarkSweep",} 0.0

 47 # HELP jvm_memory_bytes_used Used bytes of a given JVM memory area.

 48 # TYPE jvm_memory_bytes_used gauge

 49 jvm_memory_bytes_used{area="heap",} 1.5859424E7

 50 jvm_memory_bytes_used{area="nonheap",} 9558312.0

 51 # HELP jvm_memory_bytes_committed Committed (bytes) of a given JVM memory area.

 52 # TYPE jvm_memory_bytes_committed gauge

 53 jvm_memory_bytes_committed{area="heap",} 2.53231104E8

 54 jvm_memory_bytes_committed{area="nonheap",} 1.0682368E7

 55 # HELP jvm_memory_bytes_max Max (bytes) of a given JVM memory area.

 56 # TYPE jvm_memory_bytes_max gauge

 57 jvm_memory_bytes_max{area="heap",} 3.741319168E9

 58 jvm_memory_bytes_max{area="nonheap",} -1.0

 59 # HELP jvm_memory_bytes_init Initial bytes of a given JVM memory area.

 60 # TYPE jvm_memory_bytes_init gauge

 61 jvm_memory_bytes_init{area="heap",} 2.64241152E8

 62 jvm_memory_bytes_init{area="nonheap",} 2555904.0

 63 # HELP jvm_memory_pool_bytes_used Used bytes of a given JVM memory pool.

 64 # TYPE jvm_memory_pool_bytes_used gauge

 65 jvm_memory_pool_bytes_used{pool="Code Cache",} 1927488.0

 66 jvm_memory_pool_bytes_used{pool="Metaspace",} 6826936.0

 67 jvm_memory_pool_bytes_used{pool="Compressed Class Space",} 803888.0

 68 jvm_memory_pool_bytes_used{pool="PS Eden Space",} 1.5859424E7

 69 jvm_memory_pool_bytes_used{pool="PS Survivor Space",} 0.0

 70 jvm_memory_pool_bytes_used{pool="PS Old Gen",} 0.0

 71 # HELP jvm_memory_pool_bytes_committed Committed bytes of a given JVM memory pool.

 72 # TYPE jvm_memory_pool_bytes_committed gauge

 73 jvm_memory_pool_bytes_committed{pool="Code Cache",} 2555904.0

 74 jvm_memory_pool_bytes_committed{pool="Metaspace",} 7208960.0

 75 jvm_memory_pool_bytes_committed{pool="Compressed Class Space",} 917504.0

 76 jvm_memory_pool_bytes_committed{pool="PS Eden Space",} 6.6060288E7

 77 jvm_memory_pool_bytes_committed{pool="PS Survivor Space",} 1.1010048E7

 78 jvm_memory_pool_bytes_committed{pool="PS Old Gen",} 1.76160768E8

 79 # HELP jvm_memory_pool_bytes_max Max bytes of a given JVM memory pool.

 80 # TYPE jvm_memory_pool_bytes_max gauge

 81 jvm_memory_pool_bytes_max{pool="Code Cache",} 2.5165824E8

 82 jvm_memory_pool_bytes_max{pool="Metaspace",} -1.0

 83 jvm_memory_pool_bytes_max{pool="Compressed Class Space",} 1.073741824E9

 84 jvm_memory_pool_bytes_max{pool="PS Eden Space",} 1.380974592E9

 85 jvm_memory_pool_bytes_max{pool="PS Survivor Space",} 1.1010048E7

 86 jvm_memory_pool_bytes_max{pool="PS Old Gen",} 2.805989376E9

 87 # HELP jvm_memory_pool_bytes_init Initial bytes of a given JVM memory pool.

 88 # TYPE jvm_memory_pool_bytes_init gauge

 89 jvm_memory_pool_bytes_init{pool="Code Cache",} 2555904.0

 90 jvm_memory_pool_bytes_init{pool="Metaspace",} 0.0

 91 jvm_memory_pool_bytes_init{pool="Compressed Class Space",} 0.0

 92 jvm_memory_pool_bytes_init{pool="PS Eden Space",} 6.6060288E7

 93 jvm_memory_pool_bytes_init{pool="PS Survivor Space",} 1.1010048E7

 94 jvm_memory_pool_bytes_init{pool="PS Old Gen",} 1.76160768E8

 95 # HELP jvm_classes_loaded The number of classes that are currently loaded in the JVM

 96 # TYPE jvm_classes_loaded gauge

 97 jvm_classes_loaded 1194.0

 98 # HELP jvm_classes_loaded_total The total number of classes that have been loaded since the JVM has started execution

 99 # TYPE jvm_classes_loaded_total counter

100 jvm_classes_loaded_total 1194.0

101 # HELP jvm_classes_unloaded_total The total number of classes that have been unloaded since the JVM has started execution

102 # TYPE jvm_classes_unloaded_total counter

103 jvm_classes_unloaded_total 0.0

104 # HELP process_cpu_seconds_total Total user and system CPU time spent in seconds.

105 # TYPE process_cpu_seconds_total counter

106 process_cpu_seconds_total 0.8125

107 # HELP process_start_time_seconds Start time of the process since unix epoch in seconds.

108 # TYPE process_start_time_seconds gauge

109 process_start_time_seconds 1.586585865824E9

110 # HELP jvm_info JVM version info

111 # TYPE jvm_info gauge

112 jvm_info{version="1.8.0_211-b12",vendor="Oracle Corporation",runtime="Java(TM) SE Runtime Environment",} 1.0
1.2 可收集的jetty指标
 1 # HELP jetty_requests_total Number of requests

 2 # TYPE jetty_requests_total counter

 3 jetty_requests_total 0.0

 4 # HELP jetty_requests_active Number of requests currently active

 5 # TYPE jetty_requests_active gauge

 6 jetty_requests_active 0.0

 7 # HELP jetty_requests_active_max Maximum number of requests that have been active at once

 8 # TYPE jetty_requests_active_max gauge

 9 jetty_requests_active_max 0.0

10 # HELP jetty_request_time_max_seconds Maximum time spent handling requests

11 # TYPE jetty_request_time_max_seconds gauge

12 jetty_request_time_max_seconds 0.0

13 # HELP jetty_request_time_seconds_total Total time spent in all request handling

14 # TYPE jetty_request_time_seconds_total counter

15 jetty_request_time_seconds_total 0.0

16 # HELP jetty_dispatched_total Number of dispatches

17 # TYPE jetty_dispatched_total counter

18 jetty_dispatched_total 0.0

19 # HELP jetty_dispatched_active Number of dispatches currently active

20 # TYPE jetty_dispatched_active gauge

21 jetty_dispatched_active 0.0

22 # HELP jetty_dispatched_active_max Maximum number of active dispatches being handled

23 # TYPE jetty_dispatched_active_max gauge

24 jetty_dispatched_active_max 0.0

25 # HELP jetty_dispatched_time_max Maximum time spent in dispatch handling

26 # TYPE jetty_dispatched_time_max gauge

27 jetty_dispatched_time_max 0.0

28 # HELP jetty_dispatched_time_seconds_total Total time spent in dispatch handling

29 # TYPE jetty_dispatched_time_seconds_total counter

30 jetty_dispatched_time_seconds_total 0.0

31 # HELP jetty_async_requests_total Total number of async requests

32 # TYPE jetty_async_requests_total counter

33 jetty_async_requests_total 0.0

34 # HELP jetty_async_requests_waiting Currently waiting async requests

35 # TYPE jetty_async_requests_waiting gauge

36 jetty_async_requests_waiting 0.0

37 # HELP jetty_async_requests_waiting_max Maximum number of waiting async requests

38 # TYPE jetty_async_requests_waiting_max gauge

39 jetty_async_requests_waiting_max 0.0

40 # HELP jetty_async_dispatches_total Number of requested that have been asynchronously dispatched

41 # TYPE jetty_async_dispatches_total counter

42 jetty_async_dispatches_total 0.0

43 # HELP jetty_expires_total Number of async requests requests that have expired

44 # TYPE jetty_expires_total counter

45 jetty_expires_total 0.0

46 # HELP jetty_responses_total Number of requests with response status

47 # TYPE jetty_responses_total counter

48 jetty_responses_total{code="1xx",} 0.0

49 jetty_responses_total{code="2xx",} 0.0

50 jetty_responses_total{code="3xx",} 0.0

51 jetty_responses_total{code="4xx",} 0.0

52 jetty_responses_total{code="5xx",} 0.0

53 # HELP jetty_stats_seconds Time in seconds stats have been collected for

54 # TYPE jetty_stats_seconds gauge

55 jetty_stats_seconds 1.586586513759E9

56 # HELP jetty_responses_bytes_total Total number of bytes across all responses

57 # TYPE jetty_responses_bytes_total counter

58 jetty_responses_bytes_total 0.0
二、自定义收集
2.1 summer
基本度量标准名称为<basename>会在一次数据抓取期间显示多个时间序列:
streaming φ-quantiles (0 ≤ φ ≤ 1) of observed events, exposed as <basename>{quantile="<φ>"}
|
测试实例:
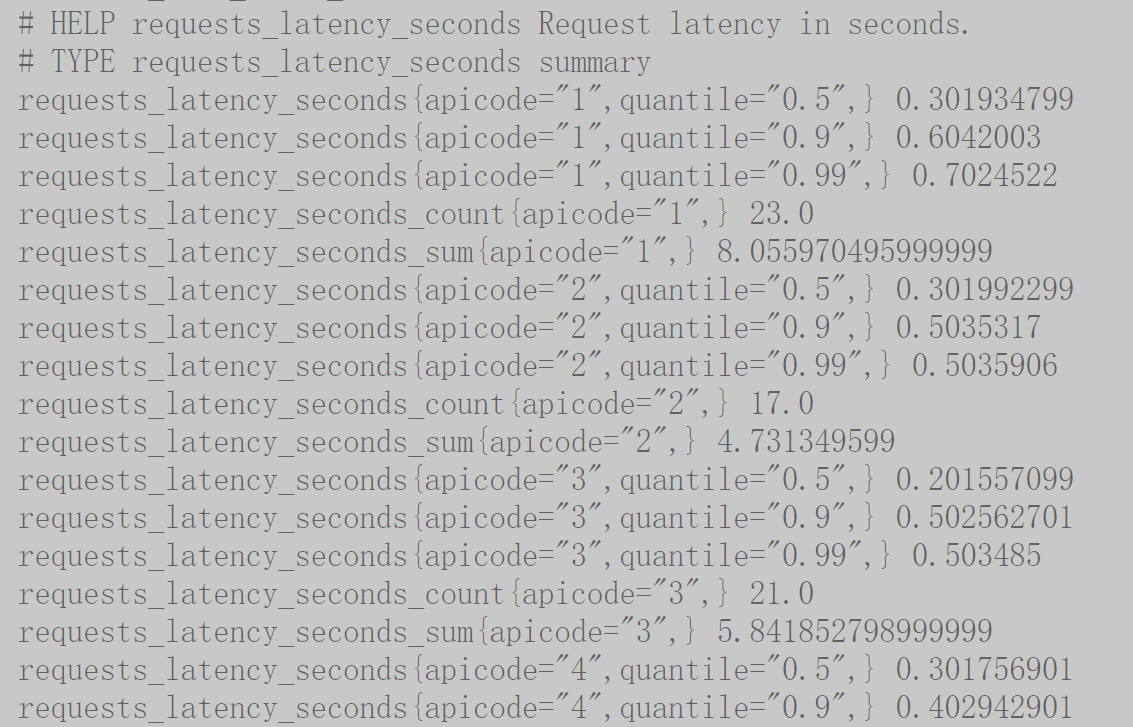
Summary可以指定在客户端统计的分位数,如下所示:
static final Summary requestLatency = Summary.build() |
2.2 histogram
基本度量标准名称为<basename>会在一次数据抓取期间显示多个时间序列:
cumulative counters for the observation buckets, exposed as <basename>_bucket{le="<upper inclusive bound>"}
|
测试实例: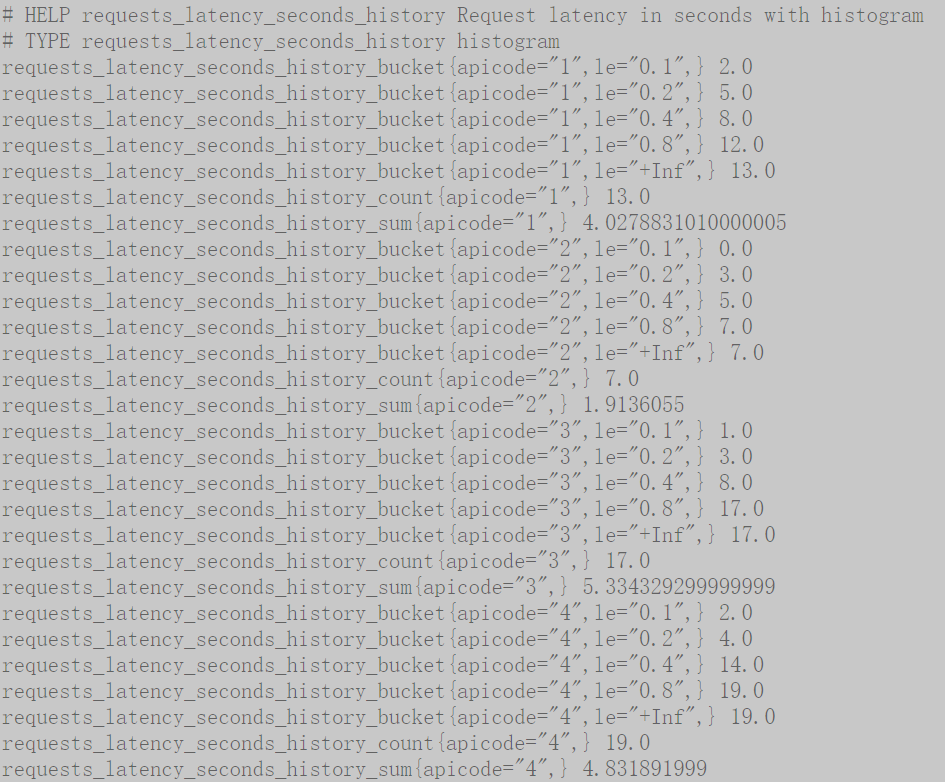
对于Histogram而言,默认的分布桶为[.005, .01, .025, .05, .075, .1, .25, .5, .75, 1, 2.5, 5, 7.5, 10],如果需要指定自定义的桶分布,可以使用buckets()方法指定,如下所示:
static final Histogram requestLatency = Histogram.build() |
2.3 summery和Histogram
它们之间一个重要的区别在于,Summary对quantile的计算是在client端完成的,而Histogram对quantile的计算是在server端完成的。这里client端是指使用了prometheus client library的模块。server端自然是指prometheus server。分析client library中对Summary的实现源码,不难发现summary对quantile的计算是依赖
CKMS实现的,参考的github地址:https://github.com/Netflix/ocelli/blob/master/ocelli-core/src/main/java/netflix/ocelli/stats/CKMSQuantiles.java(exporter——client对其进行修改部分地方),而此算法主要来自下面的一篇论文,
对算法感兴趣的可以自行研究,http://www.cs.rutgers.edu/~muthu/bquant.pdf 而Histogram对quantile的计算是在prometheus server端进行的,对histogram_quantile函数的计算是在server端完成的。所以很显然,client端处理summary的消耗比Histogram大,server端则正好反过来,
Summary和Histogram对quantile的处理的区别可以总结如下:
Summary不能对quantile值进行aggregation操作,而Histogram则可以;所以如果针对多实例的场景计算quantile,只能使用Histogram;
histogram_quantile() :histogram_quantile(φ float, b instant-vector)#计算最近10m的请求持续时间的90%分位数(每种label组合计算出一个分位数)
histogram_quantile(0.9, rate(http_request_duration_seconds_bucket[10m]))
#聚合标签le分位数(所有label组合计算出一个分位数)
histogram_quantile(0.9, sum(rate(http_request_duration_seconds_bucket[10m])) by (le))
#聚合标签job的分位数
histogram_quantile(0.9, sum(rate(http_request_duration_seconds_bucket[10m])) by (job, le))PS:If
bcontains fewer than two buckets,NaNis returned. For φ < 0,-Infis returned. For φ > 1,+Infis returned.为什么不能对Summary产生的quantile值进行aggregation运算(例如sum, avg等)。例如有两个实例同时运行,都对外提供服务,分别统计各自的响应时间。最后分别计算出的0.5-quantile的值为60和80,这时如果简单的求平均(60+80)/2,认为是总体的0.5-quantile值,那么就错了。如果你闭上眼睛,简单思考一下,就会明白对两个quantile值求平均毫无意义。所以如果需要对多个实例的quantile值进行aggregation操作,那么就不能使用Summary。
2. 如果histogram的bucket设置不合理,则最后误差可能会很大;所以如果需要相对精确的结果,而且是单实例场景,那么就使用Summary;

3.Summary对quantile的计算是在client端通过第三方库perks做的;而Histogram对quantile的计算则是server端完成的。
三、架构设计
HTTPServer内部实现如下所示:
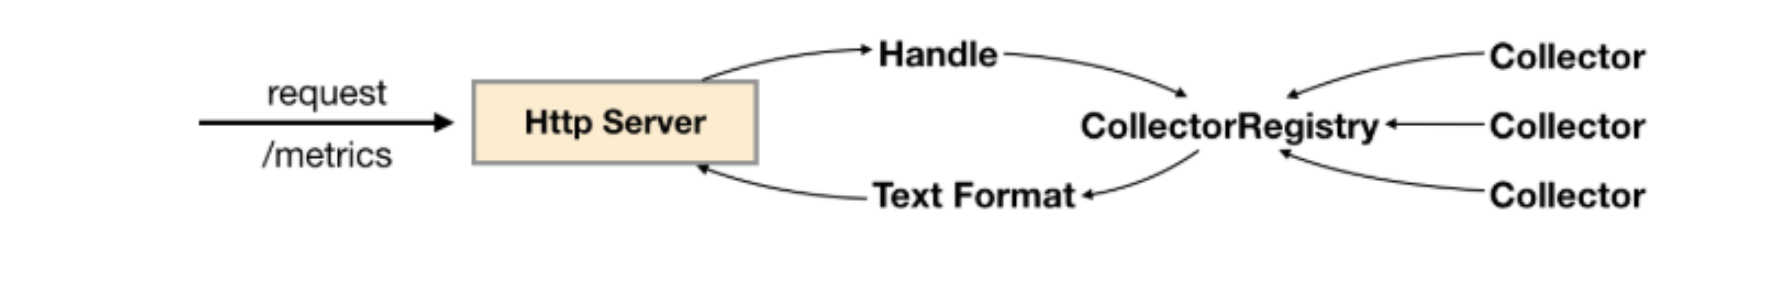
当调用Collector实例register()方法时,会将该实例保存到CollectorRegistry当中,CollectorRegistry负责维护当前系统中所有的Collector实例。 HTTPServer在接收到HTTP请求之后,会从CollectorRegistry中拿到所有的Collector实例,并调用其collect()方法获取所有样本,最后格式化为Prometheus的标准输出。
除了直接使用HTTPServer以外暴露样本数据以外,client_java中还提供了对Spring Boot、Spring Web以及Servlet的支持。
8. exporter的更多相关文章
- Exporter - 实现默认的导入方法用于模块
Exporter - 实现默认的导入方法用于模块 简介: In module YourModule.pm: package YourModule; require Exporter; @ISA = q ...
- perl Exporter一些神奇写法
use base qw(Exporter); @JSON::EXPORT = qw(from_json to_json jsonToObj objToJson encode_json decode_j ...
- Dubbo源码学习--服务发布(DubboProtocol、Exporter)
在Dubbo服务发布的整体流程一文中,只是分析了服务发布的整体流程,具体的细节还没有进一步分析.本节将继续分析服务暴露的过程.在ServiceConfig中通过一句话即可暴露服务,如下: Export ...
- zeebe 集成elasticsearch exporter
zeebe 目前还在一直的开发中,同时一些变动还是挺大的,比如simple monitor 的以前是不需要配置HazelcastExporter的 估计是为了进行集群功能处理,新添加的,以前写的配置基 ...
- 编写一个简单的基于jmespath 的prometheus exporter
目的很简单,因为系统好多监控指标是通过json 暴露的,并不是标准的prometheus metrics 格式,处理方法 实际上很简单,我们可以基于jsonpath 解析json数据,转换为prome ...
- exporter API(导出、输出器api)moodel3.3
Moodle[导出器]是接收数据并将其序列化为一个简单的预定义结构的类.它们确保输出的数据格式统一,易于维护.它们也用于生成外部函数的签名(参数和返回值) 外部函数定义在moodle/lib/exte ...
- Go语言开发Prometheus Exporter示例
一.Prometheus中的基本概念 Prometheus将所有数据存储为时间序列,这里先来了解一下prometheus中的一些基本概念 指标名和标签每个时间序列都由指标名和一组键值对(也称为标签)唯 ...
- Prometheus Node_exporter 之 Node Exporter
Node Exporter 1. Node Exporter Scrape Time type: GraphUnit: secondsLabel: Seconds{{collector}} - 各个收 ...
- 7.4 服务远程暴露 - 创建Exporter与启动netty服务端
为了安全:服务启动的ip全部使用10.10.10.10 远程服务的暴露总体步骤: 将ref封装为invoker 将invoker转换为exporter 启动netty 注册服务到zookeeper 订 ...
- Prometheus exporter的Node exporter是可以独立安装,用来测试的
现在慢慢在把prometheus operator的一些概念组织完整. https://github.com/coreos/prometheus-operator/tree/master/contri ...
随机推荐
- 手动安装pinia、给项目添加pinia实例
用你喜欢的js包管理器安装pinia: yarn add pinia # 或者使用 npm npm install pinia 创建一个 pinia 实例 (根 store) 并将其传递给应用: 编辑 ...
- 性能集成监控系统exporter+Prometheus+Grafana
Prometheus 是一个时序数据库,存数据 exporter是收集器,来收集被监控的数据,想要监控不同的内容,就使用不同的exporter,这个exporter应该放在被测服务器上,再把expor ...
- Codeforces Round 911 (Div. 2) 总结
第一次在赛场上敲莫反,还好最后调出来了! A 题意:你在Minecraft里挖了一些一格的坑(同一列),问你用几桶水可以填满它(可以造无限水). 解法:找大于 \(2\) 的连续段,有的话就是两桶,没 ...
- MinIO客户端之stat
MinIO提供了一个命令行程序mc用于协助用户完成日常的维护.管理类工作. 官方资料 mc stat 获取指定桶或者对象的信息,包含对象的元数据. 指定桶bkt1,查看信息,命令如下: ./mc st ...
- CentOS系统中yum的基本用法
最小化安装系统时,yum可能会因为网卡配置问题,随机启动配置,导致无法使用, 在shell里面输入:yum --help ,结果显示 yum 已经正常安装了!!到底是哪里出了问题呢?经过网友的提示,我 ...
- 11 个步骤完美排查Linux服务器是否被入侵
文章来源公众号:LemonSec 随着开源产品的越来越盛行,作为一个Linux运维工程师,能够清晰地鉴别异常机器是否已经被入侵了显得至关重要,个人结合自己的工作经历,整理了几种常见的机器被黑情况供参考 ...
- 小乌龟(TortoiseGit)配置SSH
小乌龟(TortoiseGit)配置SSH 使用gerrit作为项目管理,使用console窗口命令,我真是不记得太多git命令,因此交给小乌龟可视化操作,简单方便.这里记录下配置SSH公钥私钥. 前 ...
- C# 将Word转为PDF时,设置PDF文档保护
本文以C#代码示例展示如何将Word转为PDF时,设置PDF文档保护,可设置PDF文档打开密码保护以及权限密码保护.附VB.NET代码,有需要可供参考. 程序环境: 1.Word测试文档:.docx ...
- MySQL进阶篇:详解存储引擎InnoDB
本篇基础环境是使用navicat 12和Mysql8.0 MySQL进阶篇:第一章_一.二_存储引擎特点_InnoDB 1.1 存储引擎特点 1.1.1 InnoDB 1). 介绍 InnoDB是一种 ...
- 什么是MircoPython?
摘要:互联网玩家为了让Python这样的容易学,简单易学.社区API丰富的语言可以在嵌入式领域用上,逐渐开始了一轮Python上嵌入式的迁移,这样就有了今天的主角--MircoPython. 本文分享 ...