Prometheus学习笔记(4)什么是pushgateway???
一、pushgateway介绍
pushgateway是另一种数据采集的方式,采用被动推送来获取监控数据的prometheus插件,它可以单独运行在任何节点上,并不一定要运行在被监控的客户端。而后通过用户自定义编写的脚本把需要监控的数据发送给pushgateway,pushgateway再将数据推送给prometheus server。
二、pushgateway的安装运行和配置
2.1、pushgateway安装
官方下载地址:https://prometheus.io/download/#pushgateway
pushgateway和prometheus、node_exporter一样,直接下载,解压后直接运行即可。pushgateway启动后,默认监听9091端口,如下一顿操作:
# 下载

[root@prometheus ~]# wget https://github.com/prometheus/pushgateway/releases/download/v1.0.0/pushgateway-1.0.0.linux-amd64.tar.gz

# 解压

[root@prometheus ~]# tar -zxf pushgateway-1.0.0.linux-amd64.tar.gz -C /usr/local/

[root@prometheus ~]# mv /usr/local/pushgateway-1.0.0.linux-amd64 /usr/local/pushgateway-1.0.0

[root@prometheus ~]# ln -sv /usr/local/pushgateway-1.0.0 /usr/local/pushgateway

‘/usr/local/pushgateway’ -> ‘/usr/local/pushgateway-1.0.0’

# 运行

[root@prometheus ~]# cd /usr/local/pushgateway

[root@prometheus pushgateway]# ll

total 16136

-rw-r--r-- 1 3434 3434    11357 Oct 16 04:10 LICENSE

-rw-r--r-- 1 3434 3434      487 Oct 16 04:10 NOTICE

-rwxr-xr-x 1 3434 3434 16505766 Oct 16 03:58 pushgateway

[root@prometheus pushgateway]# ./pushgateway &

[1] 28453

[root@prometheus pushgateway]# level=info ts=2019-12-11T05:44:40.631Z caller=main.go:81 msg="starting pushgateway" version="(version=1.0.0, branch=HEAD, revision=cc61f46971f5eb7a5be64e80c2ee03857ddbb41a)"

level=info ts=2019-12-11T05:44:40.631Z caller=main.go:82 build_context="(go=go1.13.1, user=root@58be538fc30e, date=20191015-19:58:18)"

level=info ts=2019-12-11T05:44:40.697Z caller=main.go:142 listen_address=:9091

[root@prometheus pushgateway]# netstat -tulnp |grep 9091

tcp6       0      0 :::9091                 :::*                    LISTEN      28453/./pushgateway
再通过编写systemd的管理脚本对pushgateway进行管理:
[root@prometheus ~]# vim /usr/lib/systemd/system/pushgateway.service

[Unit]

Description=pushgateway

Documentation=https://prometheus.io/docs/introduction/overview

After=network-online.target remote-fs.target nss-lookup.target

Wants=network-online.target

[Service]

Type=simple

PIDFile==/var/run/pushgateway.pid

ExecStart=/usr/local/pushgateway/pushgateway

ExecReload=/bin/kill -s HUP $MAINPID

ExecStop=/bin/kill -s TERM $MAINPID

[Install]

WantedBy=multi-user.target

[root@prometheus ~]# systemctl daemon-reload

[root@prometheus ~]# ps -ef |grep push

root     28453 27712  0 13:44 pts/1    00:00:12 ./pushgateway

root     30549 30468  0 17:56 pts/3    00:00:00 grep --color=auto push

[root@prometheus ~]# kill 28453

[root@prometheus ~]# ps -ef |grep push

root     30551 30468  0 17:56 pts/3    00:00:00 grep --color=auto push

[root@prometheus ~]# systemctl start pushgateway

[root@prometheus ~]# ps -ef |grep push

root     30558     1  5 17:56 ?        00:00:00 /usr/local/pushgateway/pushgateway

root     30565 30468  0 17:56 pts/3    00:00:00 grep --color=auto push

[root@prometheus ~]# netstat -tulnp |grep 9091

tcp6       0      0 :::9091                 :::*                    LISTEN      30558/pushgateway
启动后,可以通过web界面进行访问pushgateway,192.168.0.143:9091,也可以通过命令行测试发送监控数据到pushgateway,如下:
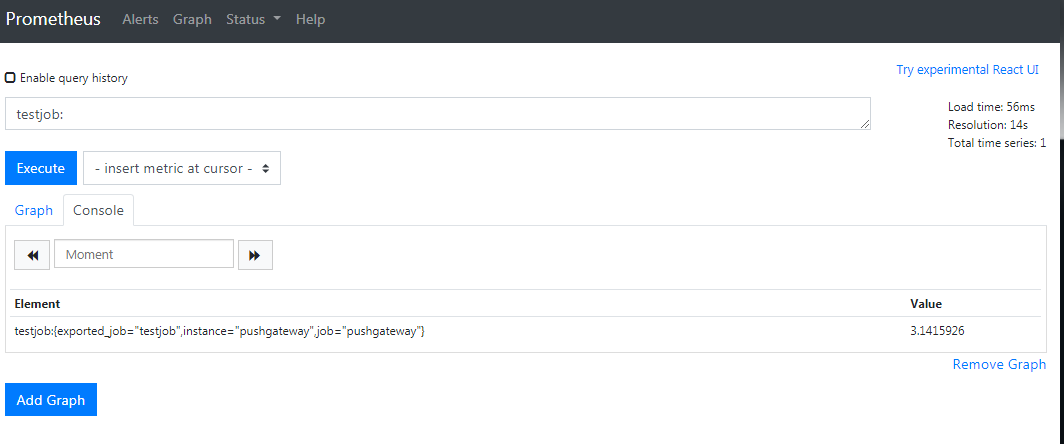
[root@node02 ~]# echo "testjob 3.1415926" |curl --data-binary @- http://192.168.0.143:9091/metrics/job/testjob

这里的数据,仅仅只是发送到了pushgateway,还需要在prometheus server上进行配置收集。这里需要注意的是最后是将key & value推送给pushgateway,curl --data-binary是将HTTP POST请求中的数据发送给HTTP服务器(pushgateway),和用户提交THML表单时浏览器的行为是外安全一样的,HTTP POST请求中的数据为纯二进制数据。
2.2、pushgateway配置
在prometheus.yml配置文件中,单独定义一个job,然后将target指向pushgateway运行所在主机的主机名或ip和运行端口即可。如下:
...

  - job_name: 'pushgateway'

    scrape_interval: 5s

    static_configs:

    - targets: ['192.168.0.143:9091']

      labels:

        instance: pushgateway
配置完成后,重启prometheus,再在prometheus的web端查询数据,即可获得刚才的测试数据,如图:
三、自定义脚本发送pushgateway
pushgateway本身没有任何抓取监控数据的功能,它只是被动的等待数据推送过来,下面在来搞搞抓取TCP_ESTABLISHED的瞬时数量,如下脚本:
[root@node02 ~]# cd /usr/local/node_exporter

[root@node02 node_exporter]# cat tcp_establish.sh

#!/bin/bash

instance_name=$(hostname) #本机主机名变量,用于后面的标签

if [ $instance_name == "localhost" ];then

    echo "Must change the hostname."

    exit 1

fi

label="count_tcp_established"  #定义一个新的key

count_tcp_established=$(netstat -an |grep -i ESTABLISHED |wc -l)

echo "$label $count_tcp_established" | curl --data-binary @- http://192.168.0.143:9091/metrics/job/pushgateway/instance/$instance_name

# 增加可执行权限后,多执行几次

[root@node02 node_exporter]# chmod +x tcp_establish.sh

[root@node02 node_exporter]# sh tcp_establish.sh
执行完成后,在pushgateway 的web端以及prometheus server的web端查询数据图,如下:
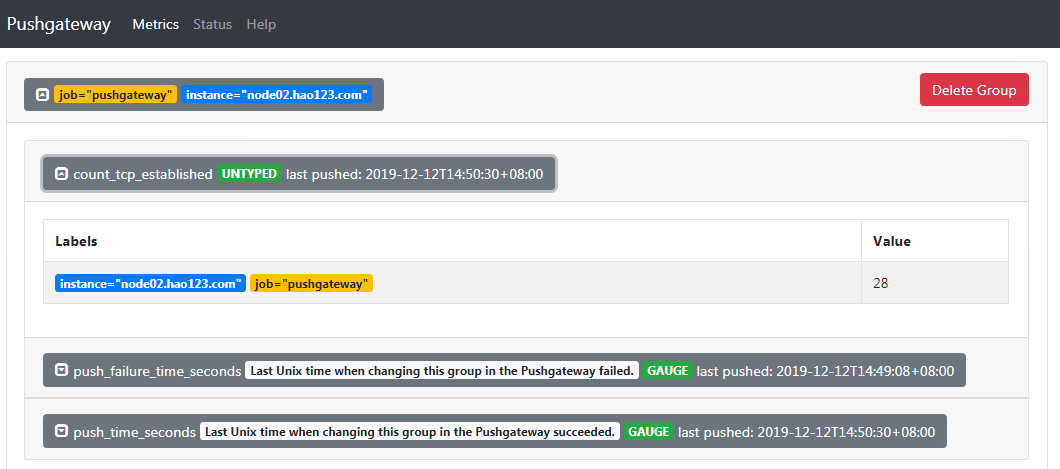

这里需要了解的是最后收集数据pushgateway的组成,主要是通过linux的命令行去获取数据,并通过echo的方式建立key value数据推送到pushgateway。http://192.168.0.143:9091/metrics/job/pushgateway/instance/$instance_name,这条连接主要分为三个部分:
http://192.168.0.143:9091/metrics/job/pushgateway:这是URL的主location,发送到哪个URL
job/pushgateway:表示是推送到哪个prometheus定义的job里面,上面我们定义的job_name为pushgateway
instance/$instance_name:表示推送后显示的主机名称是什么,从上面pushgateway图也可以看出
需要周期不断地收集该指标数据,当然免不了使用crontab,脚本配合crontab即可发挥强大功效。下面可以配置每5s收集一次该指标数据,又得写个脚本了,如下:
[root@node02 node_exporter]# vim tcp_establish.sh

#!/bin/bash

#每5秒钟刷新一次

step=5

for (( i = 0; i < 60; i=(i+step) )); do

    /bin/sh /usr/local/node_exporter/tcp_establish.sh

    sleep $step

done

[root@node02 node_exporter]# crontab -e

* * * * * /bin/sh /usr/local/node_exporter/crontab_tcp.sh
四、使用pushgateway的优缺点
这里也有官方的英文解释说明:https://prometheus.io/docs/practices/pushing/ ,总体来说主要下面2点:
(1)pushgateway是一个单点的瓶颈,如果有多个脚本同时发送给一个pushgateway的进程,如果该进程挂掉的话,那么监控数据也就木有了。
(2)pushgateway不能对发送过来的数据进行智能化判断,如果脚本中间采集有问题,那么pushgateway是会照单全收的发送给prometheus server
Prometheus学习笔记(4)什么是pushgateway???的更多相关文章
- Prometheus学习笔记(7)PromQL玩法入门
目录 1.什么是PromQL??? 2.如何查询??? 1.什么是PromQL??? PromQL是Prometheus内置的数据查询语言,其提供对时间序列数据丰富的查询,聚合以及逻辑运算能力的支持. ...
- Prometheus学习笔记(1)Prometheus架构简介
Prometheus简介和架构 Prometheus 是由 SoundCloud 开源监控告警解决方案.架构图如下: 如上图,Prometheus主要由以下部分组成: Prometheus Serve ...
- Prometheus学习笔记之教程推荐
最近学习K8S和基于容器的监控,发现了如下的教程质量不错,记录下来以备参考 K8S最佳实战(包括了K8S的Prometheus监控和EFK日志搜集) https://jimmysong.io/kube ...
- Prometheus学习笔记(6)Alertmanager告警
目录 一.Alertmanager简介 二.Alertmanager部署 三.Alertmanager配置 四.自定义告警规则和发送 五.自定义告警模板 一.Alertmanager简介 Promet ...
- Prometheus学习笔记(5)Grafana可视化展示
目录 一.Grafana安装和启动 二.配置数据源 三.配置dashboard 四.配置grafana告警 一.Grafana安装和启动 Grafana支持查询Prometheus.从Grafana ...
- Prometheus学习笔记(3)什么是node_exporter???
目录 Node_exporter安装配置启动 Node_exporter安装配置启动 node_exporter安装在被监控端,安装方式也比较简单,直接下载解压安装即可,默认启动后监听9100端口. ...
- Prometheus学习笔记(2)Prometheus部署
目录 Prometheus的安装配置启动 Prometheus的安装配置启动 1.Prometheus二进制安装 Prometheus下载链接:https://prometheus.io/downlo ...
- 【Prometheus学习笔记】主机监控 -node_exporter
Exporter for machine metrics prometheus/node_exporter 安装 Prometheus sudo tar -zxvf prometheus-*.tar. ...
- Contour 学习笔记(一):使用 Contour 接管 Kubernetes 的南北流量
原文链接:Contour 学习笔记(一):使用 Contour 接管 Kubernetes 的南北流量 在 Kubernetes 中运行大规模以 Web 为中心的工作负载,最关键的需求之一就是在 L7 ...
随机推荐
- 学好Python后可从事岗位+学习Python的难度
一.学好Python好就业: 1.Linux运维.Linux运维是必须而且一定要掌握Python语言,Python可以满足Linux运维工程师的工作需求提升效率,总而提升自己的能力.用Python实现 ...
- dockerfile+docker-compose
Dockerfile 一.简介 1.1 dockerfile中常用的命令合集 1.2 docker build 基于dockerfile制作镜像的命令 docker build [OPTIONS] P ...
- javascript 检测浏览类型和版本
废话不多说了,直接就上代码吧,因为IE11以后的版本和之前的不一样了,所以有些关键字还需要注意.这里面判断IE的时候需要多注意.function getBrowserInfo(){ var ua = ...
- mac系统中怎么打开rar/zip等压缩文件?
平常使用mac的同学们,可能经常要接受下别人发过来的rar文件,可惜的时mac os x系统默认是不能打开rar文件(不知道以后苹果会支持rar不?),那么我们该如何去解圧rar文件,接下来我将介绍. ...
- 别再说你不会 ElasticSearch 调优了,都给你整理好了
来源:http://tinyurl.com/y4gnzbje 第一部分:调优索引速度 第二部分-调优搜索速度 第三部分:通用的一些建议 英文原文:https://www.elastic.co/guid ...
- 【Kubernetes学习之一】Kubernetes 简介
环境 centos 7 一.概念和组件Kubernetes是Google开源的一个容器编排引擎,它支持自动化部署.大规模可伸缩.应用容器化管理,简称k8s. 1.Master Kubernetes中的 ...
- 微信小程序之判断页面来源
1. 对非首页,使用 getCurrentPages 函数获取当前页面栈 onLoad: function (options) { let pages = getCurrentPages() if ( ...
- vux scroller在iOS13上,一停止滑动就跳到顶部
转载:https://blog.csdn.net/sllailcp/article/details/102502452 今天客户反馈的问题,说在最新版的iOS上(iOS13),滑动列表,滑完就会跳到顶 ...
- 『摆渡车 斜率优化dp及总结』
摆渡车的题解我已经写过一遍了,在这里,这次主要从斜率优化的角度讲一下摆渡车,并总结一下斜率优化会出现的一些奇奇怪怪的错误. 摆渡车 Description 有 n 名同学要乘坐摆渡车从人大附中前往人民 ...
- Linux学习笔记之文件读取过程
0x00 概述 对于Linux系统来说,一切的数据都起源于磁盘中存储的文件.Linux文件系统的结构及其在磁盘中是如何存储的?操作系统是怎样找到这些文件进行读取的?这一章主要围绕这几个问题进行介绍(以 ...