
nagios维护之添加监控
查看修改的配置是否有误:
/usr/local/nagios/bin/nagios -v /usr/local/nagios/etc/nagios.cfg
一、nagios监控交换机
编辑 /usr/local/nagios/etc/objects 下的 switch.cfg文件
define host{

        use             generic-switch

        host_name       SW_1.

        alias           SW_1..

        address         192.168.1.101

        hostgroups      sw_group     #主机所属组

        }

define service{

        use                     generic-service ; Inherit values from a template

        hostgroup_name  sw_group            ; The name of the hostgroup

        service_description     PING            ; The service description

        check_command           check_ping!200.0,%!600.0,%  ; The command used to monitor the service

        normal_check_interval                  ; Check the service every  minutes under normal conditions

        retry_check_interval                   ; Re-check the service every minute until its final/hard state is determined

        }

修改/usr/local/nagios/etc/nagios.cfg

# Definitions for monitoring a router/switch
cfg_file=/usr/local/nagios/etc/objects/switch.cfg   #去掉前边注释
二、nagios监控windows
1、监控内容
a. 内存使用状况
b. CPU负载
c. 磁盘使用状况
d. 服务状态
e. 运行的进程
2.监控原理:
在windows服务器内安装NSClient++的监控引擎,nagios服务器通过check_nt来获取监控数据

3、配置:
a、在被监控机(客户端)安装NSCP(NSClient++)
下载地址:http://www.nsclient.org/nscp/downloads NSCP*.mis
b、安装-->如下图所示:
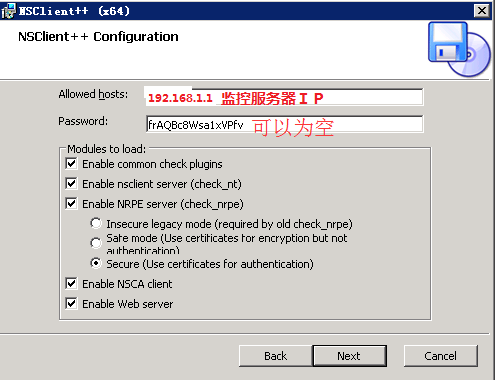
N$W99NT%Z7Z@CMFH.png)
c、在nagios服务端配置监控项。
编辑windows.cfg
define host{

        use             windows-server  ; 应用的模板名称

        host_name       xp_73.       ; 主机名

        alias           xp_192.168.73.       ; 主机别名

        address         192.168.73.220    #主机IP

        hostgroups     windows-servers     #主机所属组

        }
define hostgroup{
        hostgroup_name  windows-servers ; The name of the hostgroup
        alias           Windows Servers ; Long name of the group
        }

define service{
        use                     generic-service
        host_name               xp_73.220
        service_description     NSClient++ Version
        check_command           check_nt!CLIENTVERSION
        }
#主机开机时长
define service{
        use                     generic-service
        host_name               xp_73.220
        service_description     Uptime
        check_command           check_nt!UPTIME
        }
#主机cpu负载
define service{
        use                     generic-service
        host_name               xp_73.220
        service_description     CPU Load
        check_command           check_nt!CPULOAD!-l 5,80,90
        }

#主机内存使用
define service{
        use                     generic-service
        host_name               xp_73.220
        service_description     Memory Usage
        check_command           check_nt!MEMUSE!-w 80 -c 90
        }
#主机 磁盘空间
define service{
        use                     generic-service
        host_name               xp_73.220
        service_description     C:\ Drive Space
        check_command           check_nt!USEDDISKSPACE!-l c -w 80 -c 90
        }
define service{
        use                     generic-service
        host_name               xp_73.220
        service_description     W3SVC
        check_command           check_nt!SERVICESTATE!-d SHOWALL -l W3SVC
        }
define service{
        use                     generic-service
        host_name               xp_73.220
        service_description     Explorer
        check_command           check_nt!PROCSTATE!-d SHOWALL -l Explorer.exe
        }
三、nagios监控linux
在客户端安装nagios插件和nrpe
1、安装nrpe
tar zxvf nrpe-2.12.tar.gz
cd nrpe-2.12
./configure
make all
make install-plugin
make install-daemon
make install-daemon-config
2、安装nagios插件
tar zxvf nagios-plugins-1.4.15.tar.gz
cd nagios-plugins-1.4.15
./configure --with-nagios-user=nagios --with-nagios-group=nagios
make
make install
3、在服务器端配置
a、创建services.cfg
define host{
use linux-server
host_name 192.168.1.211
alias 192.168.1.211
address 192.168.1.211
}
define service{
use generic-service
host_name 192.168.1.211
service_description check_ping
check_command check_ping!100.0,20%!200.0,50%
max_check_attempts 5
normal_check_interval 1
}
b、修改/usr/local/nagios/etc/nagios.cfg
添加
cfg_file=/usr/local/nagios/etc/objects/services.cfg
c、重启服务器
4、添加联系人
define contact{

        contact_name                        admin1

        use                                        generic-contact

        alias                                       Ad1

        service_notification_period     24x7

        host_notification_period         24x7

        service_notification_options    w,u,c,r

        host_notification_options        d,u,r

        service_notification_commands   notify-service-by-email

        host_notification_commands        notify-host-by-email

       email                              admin@text.com

        }

define contact{

        contact_name                       admin2      #联系人名称

        use                                        generic-contact

        alias                                     Ad2

        service_notification_period     24x7       #service故障 报警时间段

        host_notification_period         24x7       #host故障 报警时间段

        service_notification_options    w,u,c,r      #服务报警级别

        host_notification_options        d,u,r    #主机报警级别

        service_notification_commands   notify-service-by-email     #报警方式

        host_notification_commands        notify-host-by-email

       email                                         admin2@text.com    #邮箱

        }

define contactgroup{

        contactgroup_name       admins

        alias                   Nagios Administrators

        members                 admin1,admin2      #将联系人添加至admins 组。

        }
nagios维护之添加监控的更多相关文章
- python+Django实现Nagios自动化添加监控项目
最近机房刚上了一批机器(有100台左右),需要使用Nagios对这一批机器进行监控.领导要求两天时间完成所有主机的监控.从原来的经验来看,两天时间肯定完成不了.那怎么办?按照之前的想法,肯定是在nag ...
- Jmeter添加监控指标
需要监控的机器上安装Server-Agency(需要java环境支持)把ServerAgent-2.2.1.zip拷到需要监控的机器上,解压Linux启动如下2. Jmeter上添加监控最终有如下指标 ...
- zabbix 自动发现端口并添加监控设置
自动发现端口并添加监控设置UserParameter=net.listen.discovery,sudo /etc/zabbix/scripts/discovery_listport.sh #!/bi ...
- zabbix的自动发现、自定义添加监控项目、配置邮件告警
1.zabbix的自动发现这里的自动发现,所显示出来的是规则的上自动了现 然后 可以对其内容进行相关的配制,如时间或周期 注意:对于单个主机的规则,可以自行添加或删除, 但对于已经添加好了的规则,若需 ...
- OEMCC13.2 添加监控目标
1.需求描述 2.添加数据库目标 2.1 部署AGENT 2.1.1 直接安装方式 2.1.2 离线安装方式 2.1.3 命令行安装方式 2.2 添加集群资源 2.3 添加数据库 3.添加 ...
- 【zabbix】自动注册,实现自动发现agent并添加监控(agent不需要任何配置)
更新: 后来在实际使用中发现,与其使用zabbix自动注册,不如直接调用zabbix的api主动发起添加服务器的请求,这样就不需要在zabbixserver上配置host信息了.实现全自动.具体调用方 ...
- rancher导入k8s集群后添加监控无数据
1.日志报错 rancher导入k8s集群后添加监控无数据,rancher日志报错: k8s.io/kube-state-metrics/pkg/collectors/builder.go:: Fai ...
- mysql-cacti-templates-1.1.2.tar.gz 免费下载 cacti MySQL添加监控
cacti MySQL添加监控 1. 安装监控插件 wget http://mysql-cacti-templates.googlecode.com/files/mysql-cacti-templat ...
- Zabbix4.0如何添加监控信息
二.添加监控信息 监控Windows主机: 首先需要在Windows主机上安装好Zabbix agent,安装方法,见另一篇博客,https://www.cnblogs.com/opsprobe/p/ ...
随机推荐
- scrapy爬行乌云网公开漏洞程序的分析
# -*- coding: utf-8 -*- from datetime import datetime import pymongo import scrapy from wooyun.items ...
- markdown的试用
因为markdown,我接触到latex,因为latex,我花了几个月去看相关的书籍 我看了以下相关的资料 1.<LaTeX入门> 刘海洋 2.英文 TeX - LaTeX Stack E ...
- jeecg好用吗,看看大家的评价
大家都会有个疑问,jeecg好用吗? 看看大家的评价
- ABAP-折叠窗口
1.测试 2.代码 *&---------------------------------------------------------------------* *& Report ...
- jquery循环方法
<!DOCTYPE html> <html lang="en"> <head> <meta charset="UTF-8&quo ...
- oracle第一天笔记
Oracle体系结构: 数据库 ----> 实例(orcl) ---> 表空间(逻辑单位)(用户) ---> 数据文件(物理单位) 地球 ----> 国家 ...
- Shell函数使用方法
Shell函数是一组命令集或语句组成一个可用块.利用函数可以简化脚本编写.函数要求先定义再使用,调用函数时直接使用函数名即可.这里主要介绍shell编程中函数定义.调用.获取函数参数以及获取函数返回值 ...
- c/c++基础 const
int main(int argc, char* argv[]) { '; '; a1='; //a2='2'; //a2是字符常量 "; "; a3="; //a4=& ...
- Android DevArt2:Android 5.0下 Dialog&AlertDialog 并不会影响Activity的生命周期
先给出结论:Dialog和AlertDialog并不会影响到Activity的生命周期,但会影响到Activity的优先级. 核心代码: onCreated中: Resources resources ...
- c# vs2013部署项目
http://demo.netfoucs.com/shinepan/article/details/24865931