
谁记录了mysql error log中的超长信息
【问题】
最近查看MySQL的error log文件时,发现有很多服务器的文件中有大量的如下日志,内容很长(大小在200K左右),从记录的内容看,并没有明显的异常信息。
有一台测试服务器也有类似的问题,为什么会记录这些信息,是谁记录的这些信息,分析的过程比较周折。
Status information:
Current dir:
Running threads: 2452 Stack size: 262144
Current locks:
lock: 0x7f783f5233f0:
Key caches:
default
Buffer_size: 8388608
Block_size: 1024
Division_limit: 100
Age_limit: 300
blocks used: 10
not flushed: 0
w_requests: 6619
writes: 1
r_requests: 275574
reads: 1235
handler status:
read_key: 32241480828
read_next: 451035381896
read_rnd 149361175
read_first: 1090473
write: 4838429521
delete 12155820
update: 3331297842
【分析过程】
1、首先在官方文档中查到,当mysqld进程收到SIGHUP信号量时,就会输出类似的信息,
On Unix, signals can be sent to processes. mysqld responds to signals sent to it as follows:
SIGHUP causes the server to reload the grant tables and to flush tables, logs, the thread cache, and the host cache. These actions are like various forms of the FLUSH statement. The server also writes a status report to the error log that has this format:
https://dev.mysql.com/doc/refman/5.6/en/server-signal-response.html
2、有别的程序在kill mysqld进程吗,用systemtap脚本监控kill命令
probe nd_syscall.kill
{
target[tid()] = uint_arg(1);
signal[tid()] = uint_arg(2);
}
probe nd_syscall.kill.return
{
if (target[tid()] != 0) {
printf("%-6d %-12s %-5d %-6d %6d\n", pid(), execname(),
signal[tid()], target[tid()], int_arg(1));
delete target[tid()];
delete signal[tid()];
}
}
用下面命令测试,确实会在error log中记录日志
kill -SIGHUP 12455
从systemtap的输出看到12455就是mysqld进程,被kill掉了,信号量是1,对应的就是SIGHUP
不过在测试环境后面问题重现时,却没有抓到SIGHUP的信号量。
FROM COMMAND SIG TO RESULT
17010 who 0 12153 1340429600
36681 bash 1 12455 642
3、看来并不是kill导致的,后面用gdb attach到mysqld进程上,在error log的三个入口函数sql_print_error,sql_print_warning,sql_print_information加上断点
但是在问题重现时,程序并没有停在断点处
4、写error log还有别的分支吗,翻源码找到了答案,原来是通过mysql_print_status函数直接写到error log中
void mysql_print_status()
{
char current_dir[FN_REFLEN];
STATUS_VAR current_global_status_var;
printf("\nStatus information:\n\n");
(void) my_getwd(current_dir, sizeof(current_dir),MYF(0));
printf("Current dir: %s\n", current_dir);
printf("Running threads: %u Stack size: %ld\n",
Global_THD_manager::get_instance()->get_thd_count(),
(long) my_thread_stack_size);
…
puts("");
fflush(stdout);
}
5、再次用gdb attach到mysqld进程上,在mysql_print_status函数上加断点,在问题重现时,线程停在断点处,通过ps的结果多次对比,判断是pt-stalk工具运行时调用了mysql_print_status
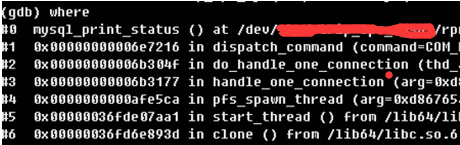
6、从堆栈中看到dispatch_command调用了mysql_print_status,下面是具体的逻辑,当command=COM_DEBUG时就会执行到mysql_print_status
case COM_DEBUG:
thd->status_var.com_other++;
if (check_global_access(thd, SUPER_ACL))
break; /* purecov: inspected */
mysql_print_status();
query_logger.general_log_print(thd, command, NullS);
my_eof(thd);
break;
7、查看pt-stalk的代码
if [ "$mysql_error_log" -a ! "$OPT_MYSQL_ONLY" ]; then
log "The MySQL error log seems to be $mysql_error_log"
tail -f "$mysql_error_log" >"$d/$p-log_error" &
tail_error_log_pid=$!
$CMD_MYSQLADMIN $EXT_ARGV debug
else
log "Could not find the MySQL error log"
在调用mysqladmin时使用了debug模式
debug Instruct server to write debug information to log
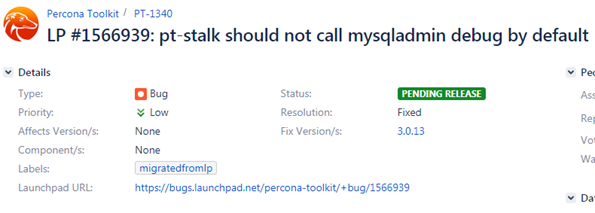
8、在percona官网上搜到了相关的bug描述,目前bug还未修复,会在下个版本中3.0.13中修复。
https://jira.percona.com/browse/PT-1340
【解决方案】
定位到问题后,实际修复也比较简单,将pt-stalk脚本中$CMD_MYSQLADMIN $EXT_ARGV debug中的debug去掉就可以了,测试生效。
总结:
(1) 通过mysql_print_status函数直接写到error log中
(2) 执行mysqladmin debug
(3) 资源紧张,kill session等 (同时参考: https://dev.mysql.com/doc/refman/5.7/en/server-signal-response.html)
Status information:
Current dir: /data/mysql/mysql3306/data/
Running threads: 7 Stack size: 262144
Current locks:
lock: 0x7fdcb0a44780:
lock: 0x7fdcaf0ea980:
lock: 0x1edb5a0:
..........
..........
Key caches:
default
Buffer_size: 8388608
Block_size: 1024
Division_limit: 100
Age_limit: 300
blocks used: 9
not flushed: 0
w_requests: 0
writes: 0
r_requests: 82
reads: 13
handler status:
read_key: 16981474
read_next: 33963080
read_rnd 6
read_first: 192
write: 21270
delete 0
update: 16981221
Table status:
Opened tables: 956
Open tables: 206
Open files: 13
Open streams: 0
Memory status:
<malloc version="1">
<heap nr="0">
<sizes>
<unsorted from="140586808432240" to="140585778669336" total="0" count="140585778669312"/>
</sizes>
<total type="fast" count="0" size="0"/>
<total type="rest" count="0" size="0"/>
<system type="current" size="0"/>
<system type="max" size="0"/>
<aspace type="total" size="0"/>
<aspace type="mprotect" size="0"/>
</heap>
<total type="fast" count="0" size="0"/>
<total type="rest" count="0" size="0"/>
<total type="mmap" count="0" size="0"/>
<system type="current" size="0"/>
<system type="max" size="0"/>
<aspace type="total" size="0"/>
<aspace type="mprotect" size="0"/>
</malloc>
Events status:
LLA = Last Locked At LUA = Last Unlocked At
WOC = Waiting On Condition DL = Data Locked
Event scheduler status:
State : INITIALIZED
Thread id : 0
LLA : n/a:0
LUA : n/a:0
WOC : NO
Workers : 0
Executed : 0
Data locked: NO
Event queue status:
Element count : 0
Data locked : NO
Attempting lock : NO
LLA : init_queue:96
LUA : init_queue:104
WOC : NO
Next activation : never
谁记录了mysql error log中的超长信息的更多相关文章
- 谁记录了mysql error log中的超长信息(记pt-stalk一个bug的定位过程)
[问题] 最近查看MySQL的error log文件时,发现有很多服务器的文件中有大量的如下日志,内容很长(大小在200K左右),从记录的内容看,并没有明显的异常信息. 有一台测试服务器也有类似的问题 ...
- MySQL Error Log 中IO写入瓶颈的警告分析
周末在一台MySQL实例上频繁做大批量的写入测试,无意中发现MySQL的errorlog中频繁出现如下的Note:page_cleaner: 1000ms intended loop took *** ...
- Sort aborted Error in MySQL Error Log
现象 [ERROR] lines containing "Sort aborted" are present in the MySQL error log file. [Warni ...
- Git 实战手册(一): 批量修改log中的提交信息
本文须知 教程所示图片使用的是 github 仓库图片,网速过慢的朋友请移步原文地址 有空就来看看个人技术小站, 我一直都在 背景介绍 事情的起源是这样的:迷恋的谷歌的我最近申请了一个新的 googl ...
- MySQL Error Log 文件丢失导致The server quit without updating PID file启动失败的场景
今天在做mysql sniff测试的时候,中间重启MySQL实例的过程中,出现了"The server quit without updating PID file"这个经典的错误 ...
- 记录一下 mysql 的查询中like字段的用法
SELECT * from t_yymp_auth_role where role_name not like '%测试%' and role_name not like '%部门%' and rol ...
- 【MySQL案例】error.log的Warning:If a crash happens thisconfiguration does not guarantee that the relay lo(转)
标签: 1.1.1. If a crash happens thisconfiguration does not guarantee that the relay log info will be c ...
- 【MySQL案例】error.log的Warning:If a crash happens thisconfiguration does not guarantee that the relay lo
1.1.1. If a crash happens thisconfiguration does not guarantee that the relay log info will be consi ...
- MySQL错误日志(Error Log)
错误日志是一个文本文件,记录了 MySQL Server 每次启动和关闭的详细信息以及运行过程中所有较为严重的警告和错误信息.在遇到问题时,应该首先查看这个文件. 如何开启 使用命令 SHOW VAR ...
随机推荐
- 【原创】《windows驱动开发技术详解》第4章实验总结二
1 实验要求(WDM驱动) 2 编写过程 2.1 确立整体架构 2.1.1 入口函数——DriverEntry (1)作用 设置pDriverObject结构体,注册AddDevi ...
- [机器学习]正则化方法 -- Regularization
那添加L1和L2正则化有什么用?下面是L1正则化和L2正则化的作用,这些表述可以在很多文章中找到. L1正则化可以产生稀疏权值矩阵,即产生一个稀疏模型,可以用于特征选择 L2正则化可以防止模型过拟合( ...
- Django学习笔记(3)——表单,测试和模板语法的学习
一,表单form 为了接收用户的投票选择,我们需要在前段页面显示一个投票界面,让我们重写之前的polls/detail.html文件,代码如下: <h1>{{ question.quest ...
- spring-boot-2.0.3之quartz集成,最佳实践
前言 开心一刻 快过年了,大街上,爷爷在给孙子示范摔炮怎么放,嘴里还不停念叨:要像这样,用劲甩才能响.示范了一个,两个,三个... 孙子终于忍不住了,抱着爷爷的腿哭起来:爷呀,你给我剩个吧! 新的一年 ...
- 结构型---享元模式(Flyweight Pattern)
引言 在软件开发过程,如果我们需要重复使用某个对象的时候,如果我们重复地使用new创建这个对象的话,这样我们在内存就需要多次地去申请内存空间了,这样可能会出现内存使用越来越多的情况,这样的问题是非常严 ...
- 【Java每日一题】20170315
20170314问题解析请点击今日问题下方的“[Java每日一题]20170315”查看(问题解析在公众号首发,公众号ID:weknow619) package Mar2017; public cla ...
- 【Java每日一题】20170223
20170222问题解析请点击今日问题下方的“[Java每日一题]20170223”查看(问题解析在公众号首发,公众号ID:weknow619) package Feb2017; public cla ...
- Java高并发--CPU多级缓存与Java内存模型
Java高并发--CPU多级缓存与Java内存模型 主要是学习慕课网实战视频<Java并发编程入门与高并发面试>的笔记 CPU多级缓存 为什么需要CPU缓存:CPU的频率太快,以至于主存跟 ...
- Hibernate入门(一)
1.导包 导入Hibernate最基本的包(不要忘记导入数据库驱动包了!) 下载文件名为黄色框框中的名称的压缩包在对应路径下,有个required包下的所有包就是必备的基本包 2.建表 USE TES ...
- JBoss应用服务器清理缓存
旭日Follow_24 的CSDN 博客 ,全文地址请点击: https://blog.csdn.net/xuri24/article/details/82220081 jboss跟tomcat一样, ...