Filebeat6.31整合Kafka集群消息队列(三)
wget https://artifacts.elastic.co/downloads/beats/filebeat/filebeat-6.3.2-linux-x86_64.tar.gz
[root@es-node1 ~]# tar zxvf filebeat-6.3.2-linux-x86_64.tar.gz -C /usr/local/
# mv /usr/local/filebeat-6.3.2-linux-x86_64/ /usr/local/filebeat
# egrep -v "#|^$" filebeat.yml
filebeat.prospectors         #用于定义数据原型,检测日志或是发现日志

- input_type: log            #指定数据的输入类型,默认为log,另外还可以指定stdin

  paths:                      #自定需要监控的日志文件路径;可以是完整的日志路径也可以是模糊的匹配格式

   - /var/log/messages        #指定系统日志位置

  fields:                      #定义日志来源,可以添加自定义字段,其实就是定义Kafka消息队列的topic主题名称,如果kafka消息队列中没有该名称,会自动生成

    log_topic: test

  paths:                    #与上述一样定义需要监控的日志文件路径,不够这次是定义apache-web服务的日志

   - /etc/httpd/logs/*

  fields:                    #定义日志来源,生成kafka消息队列topic主题

    log_topic: webapache

processors:            #这个地方需要注意,此配置是将日志输出格式过滤掉,一般情况下,一些无用的日志字段我们可以删除,只看关键性的信息

- drop_fields:

   fields: ["beat", "input_type", "source", "offset",]

name: "192.168.37.134"         #设置filebeat收集日志中对应的主机名称,,如果设置为空,这使用该机器的主机名称,这里这是本地IP,便于区分多台主机的日志信息

output.kafka:                  #多种输出类型,可支持想kafka,logstash,elasticsearch输出日志信,在这里是将日志信息输出到Kafka中,

  enabled: true                 启动该模块

  hosts: ["192.168.37.134:9092", "192.168.37.135:9092", "192.168.37.136:9092"]        #指定输出数据到kafka集群上,地址与端口号想对应

  version: "0.10"

  topic: '%{[fields][log_topic]}'    #指定要发送数据到kafka集群的哪个topic,与上述的"fields: log_topic:"相对应,这是6.x的配置

  partition.round_robin:         #开启kafka的partition分区

    reachable_only: true

  worker: 2

  required_acks: 1

  compression: gzip      #压缩格式

  max_message_bytes: 10000000    #压缩格式字节大小

logging.level: debug        #日志类型为debug
root@es-node1 bin]#nohup ./filebeat -e -c filebeat.yml &
[root@es-node1 bin]# ./kafka-topics.sh --zookeeper 192.168.37.129:2181,192.168.37.133,192.168.37.133:2181 --list
osmessages
test
webapache
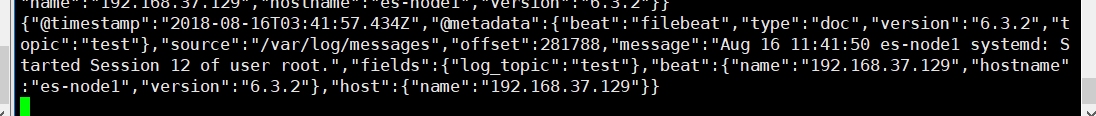
【Kafka节点 】启动消费,本次消费是
[root@es-node3 bin]# ./kafka-console-consumer.sh --bootstrap-server 192.168.37.134:9092,192.168.37.135:9092,192.168.37.136:9092 --topic test --from-beginning
{

    "@timestamp": "2018-08-16T04:24:19.871Z",

    "@metadata": {

        "beat": "filebeat",

        "type": "doc",

        "version": "6.3.2",

        "topic": "test"

    },

    "message": "Aug 16 12:24:13 es-node1 dbus[623]: [system] Successfully activated service 'org.freedesktop.nm_dispatcher'",

    "fields": {

        "log_topic": "test"

    },

    "beat": {

        "name": "192.168.37.134",

        "hostname": "es-node1",

        "version": "6.3.2"

    },

    "host": {

        "name": "192.168.37.134"

    },

    "source": "/var/log/messages",

    "offset":

}
以下是apache是通过json校验的日志输出信息
 {

     "@timestamp": "2018-08-16T04:19:34.153Z",

     "@metadata": {

         "beat": "filebeat",

         "type": "doc",

         "version": "6.3.2",

         "topic": "webapache"

     },

     "beat": {

         "name": "192.168.37.129",

         "hostname": "es-node1",

         "version": "6.3.2"

     },

     "host": {

         "name": "192.168.37.129"

     },

     "source": "/etc/httpd/logs/access_log",

     "offset": ,

     "message": "192.168.37.1 - - [16/Aug/2018:12:19:33 +0800] \"GET /noindex/css/fonts/Bold/OpenSans-Bold.ttf HTTP/1.1\" 404 238 \"http://192.168.37.129/noindex/css/open-sans.css\" \"Mozilla/5.0 (Windows NT 10.0; Win64; x64) AppleWebKit/537.36 (KHTML, like Gecko) Chrome/68.0.3440.106 Safari/537.36\"",

     "fields": {

         "log_topic": "webapache"

     }

 }

上述Filebeat收集到的日志格式信息量过大,我们只需要收集关键性的日志信息即可,无用的可以过滤掉,配置如下
processors:

- drop_fields:

   fields: ["beat", "input_type", "source", "offset",]
过滤到之后 的apache日志输出如下所示
 {

     "@timestamp": "2018-08-16T05:10:02.261Z",

     "@metadata": {

         "beat": "filebeat",

         "type": "doc",

         "version": "6.3.2",

         "topic": "webapache"

     },

     "message": "192.168.37.1 - - [16/Aug/2018:13:09:53 +0800] \"GET /noindex/css/fonts/Bold/OpenSans-Bold.ttf HTTP/1.1\" 404 238 \"http://192.168.37.129/noindex/css/open-sans.css\" \"Mozilla/5.0 (Windows NT 10.0; Win64; x64) AppleWebKit/537.36 (KHTML, like Gecko) Chrome/68.0.3440.106 Safari/537.36\"",

     "fields": {

         "log_topic": "webapache"

     },

     "host": {

         "name": "192.168.37.129"

     }

 }
【filebeat.yml配置文件】
文章最后结尾是filebeat的过滤和未过滤的配置,方便直接复制粘贴;
为什么这我们再次将filebeat的配置文件粘贴出来呢?因为我被这个坑了整整一天的时间,启动fiebeat一直报错,网上关于6.x版本和kafka整合的博客和资料几乎没有,出现报错,也没有解决方案,当时直接气晕,对外寻求帮助,也没有解决方案,最后上层技术大佬,才得以解决,这个filebeat,yml实在是太多坑了,都是因为JSON格式,下面是我具体的报错信息
error initializing publisher: missing required field accessing 'output.kafka.hosts'

提示缺少访问“输出. Kafka . hosts”的必需字段,就这个,我纠结了一天,好在问题解决了,心累~
[root@es-node1 filebeat]# egrep -v "#|^$" filebeat.yml

filebeat.prospectors:

- input_type: log

  paths:

   - /var/log/messages

  fields:

    log_topic: test

  paths:

   - /etc/httpd/logs/*

  fields:

    log_topic: webapache

processors:

- drop_fields:

   fields: ["beat", "input_type", "source", "offset",]

name: "192.168.37.134"

output.kafka:

  enabled: true

  hosts: ["192.168.37.134:9092", "192.168.37.135:9092", "192.168.37.136:9092"]

  version: "0.10"

  topic: '%{[fields][log_topic]}'

  partition.round_robin:

    reachable_only: true

  worker: 2

  required_acks: 1

  compression: gzip

  max_message_bytes: 10000000

logging.level: debug
###################### Filebeat Configuration Example #########################

# This file is an example configuration file highlighting only the most common

# options. The filebeat.full.yml file from the same directory contains all the

# supported options with more comments. You can use it as a reference.

#

# You can find the full configuration reference here:

# https://www.elastic.co/guide/en/beats/filebeat/index.html

#=========================== Filebeat prospectors =============================

filebeat.prospectors:

# Each - is a prospector. Most options can be set at the prospector level, so

# you can use different prospectors for various configurations.

# Below are the prospector specific configurations.

- input_type: log

  # Paths that should be crawled and fetched. Glob based paths.

  paths:

   - /var/log/messages

  fields:

    log_topic: test

  paths:

   - /etc/httpd/logs/*

  fields:

    log_topic: webapache

    #- c:\programdata\elasticsearch\logs\*

  # Exclude lines. A list of regular expressions to match. It drops the lines that are

  # matching any regular expression from the list.

  #exclude_lines: ["^DBG"]

  # Include lines. A list of regular expressions to match. It exports the lines that are

  # matching any regular expression from the list.

  #include_lines: ["^ERR", "^WARN"]

  # Exclude files. A list of regular expressions to match. Filebeat drops the files that

  # are matching any regular expression from the list. By default, no files are dropped.

  #exclude_files: [".gz$"]

  # Optional additional fields. These field can be freely picked

  # to add additional information to the crawled log files for filtering

  #fields:

  #  level: debug

  #  review: 1

  ### Multiline options

  # Mutiline can be used for log messages spanning multiple lines. This is common

  # for Java Stack Traces or C-Line Continuation

  # The regexp Pattern that has to be matched. The example pattern matches all lines starting with [

  #multiline.pattern: ^\[

  # Defines if the pattern set under pattern should be negated or not. Default is false.

  #multiline.negate: false

  # Match can be set to "after" or "before". It is used to define if lines should be append to a pattern

  # that was (not) matched before or after or as long as a pattern is not matched based on negate.

  # Note: After is the equivalent to previous and before is the equivalent to to next in Logstash

  #multiline.match: after

processors:

- drop_fields:

   fields: ["beat", "input_type", "source", "offset",]

#================================ General =====================================

# The name of the shipper that publishes the network data. It can be used to group

# all the transactions sent by a single shipper in the web interface.

name: "192.168.37.134"

# The tags of the shipper are included in their own field with each

# transaction published.

#tags: ["service-X", "web-tier"]

# Optional fields that you can specify to add additional information to the

# output.

#fields:

#  env: staging

#================================ Outputs =====================================

# Configure what outputs to use when sending the data collected by the beat.

# Multiple outputs may be used.

output.kafka:

  enabled: true

  hosts: ["192.168.37.134:9092", "192.168.37.135:9092", "192.168.37.136:9092"]

  version: "0.10"

  topic: '%{[fields][log_topic]}'

  partition.round_robin:

    reachable_only: true

  worker: 2

  required_acks: 1

  compression: gzip

  max_message_bytes: 10000000

#-------------------------- Elasticsearch output ------------------------------

#output.elasticsearch:

  # Array of hosts to connect to.

  #hosts: []

  # Optional protocol and basic auth credentials.

  #protocol: "https"

  #username: "elastic"

  #password: "changeme"

#----------------------------- Logstash output --------------------------------

#output.logstash:

  # The Logstash hosts

  #hosts: ["172.16.213.51:5044"]

  # Optional SSL. By default is off.

  # List of root certificates for HTTPS server verifications

  #ssl.certificate_authorities: ["/etc/pki/root/ca.pem"]

  # Certificate for SSL client authentication

  #ssl.certificate: "/etc/pki/client/cert.pem"

  # Client Certificate Key

  #ssl.key: "/etc/pki/client/cert.key"

#================================ Logging =====================================

# Sets log level. The default log level is info.

# Available log levels are: critical, error, warning, info, debug

logging.level: debug

# At debug level, you can selectively enable logging only for some components.

# To enable all selectors use ["*"]. Examples of other selectors are "beat",

# "publish", "service".

#logging.selectors: ["*"]
Filebeat6.31整合Kafka集群消息队列(三)的更多相关文章
- Kafka 集群消息监控系统:Kafka Eagle
Kafka Eagle 1.概述 在开发工作当中,消费 Kafka 集群中的消息时,数据的变动是我们所关心的,当业务并不复杂的前提下,我们可以使用 Kafka 提供的命令工具,配合 Zookeeper ...
- SpringBoot开发案例之整合Kafka实现消息队列
前言 最近在做一款秒杀的案例,涉及到了同步锁.数据库锁.分布式锁.进程内队列以及分布式消息队列,这里对SpringBoot集成Kafka实现消息队列做一个简单的记录. Kafka简介 Kafka是由A ...
- Kafka集群消息积压问题及处理策略
通常情况下,企业中会采取轮询或者随机的方式,通过Kafka的producer向Kafka集群生产数据,来尽可能保证Kafka分区之间的数据是均匀分布的. 在分区数据均匀分布的前提下,如果我们针对要处理 ...
- kafka学习(三)-kafka集群搭建
kafka集群搭建 下面简单的介绍一下kafka的集群搭建,单个kafka的安装更简单,下面以集群搭建为例子. 我们设置并部署有三个节点的 kafka 集合体,必须在每个节点上遵循下面的步骤来启动 k ...
- Kafka基础教程(三):C#使用Kafka消息队列
接上篇Kafka的安装,我安装的Kafka集群地址:192.168.209.133:9092,192.168.209.134:9092,192.168.209.135:9092,所以这里直接使用这个集 ...
- (三)kafka集群扩容后的topic分区迁移
kafka集群扩容后的topic分区迁移 kafka集群扩容后,新的broker上面不会数据进入这些节点,也就是说,这些节点是空闲的:它只有在创建新的topic时才会参与工作.除非将已有的partit ...
- kafka分布式消息队列介绍以及集群安装
简介 首先简单说下对kafka的理解: 1.kafka是一个分布式的消息缓存系统: 2.kafka集群中的服务器节点都被称作broker 3.kafka的客户端分为:一是producer(消息生产者) ...
- (七)整合 Redis集群 ,实现消息队列场景
整合 Redis集群 ,实现消息队列场景 1.Redis集群简介 1.1 RedisCluster概念 2.SpringBoot整合Redis集群 2.1 核心依赖 2.2 核心配置 2.3 参数渲染 ...
- 消息队列之 kafka 集群搭建
我们先弄清楚kafka集群环境首先需要些什么 JDK 10+ Zookeeper Kafka 2.x 首先准备三台虚拟机 centos7 ,更改IP地址为静态地址分别为,29.30.31 cd /et ...
随机推荐
- 制作缩略图java工具类
import java.awt.Image; import java.awt.image.BufferedImage; import java.io.File; import java.io.File ...
- LA 3263 (欧拉定理)
欧拉定理题意: 给你N 个点,按顺序一笔画完连成一个多边形 求这个平面被分为多少个区间 欧拉定理 : 平面上边为 n ,点为 c 则 区间为 n + 2 - c: 思路: 先扫,两两线段的交点,存下来 ...
- 数据库-mysql-DDL-表记录操作
- Android应用开发中三种常见的图片压缩方法
Android应用开发中三种常见的图片压缩方法,分别是:质量压缩法.比例压缩法(根据路径获取图片并压缩)和比例压缩法(根据Bitmap图片压缩). 一.质量压缩法 private Bitmap com ...
- (*(volatile unsigned long *)详解
(*(volatile unsigned long *) 对于不同的计算机体系结构,设备可能是端口映射,也可能是内存映射的.如果系统结构支持独立的IO地址空间,并且是端口映射,就必须使用汇编语言完成实 ...
- Oracle Blob查询和插入
注:本文来源于<Oracle Blob查询和插入> 插入 UPDATE cmm05 SET OUTFILE = to_blob('12345690'): 查询: SELECT utl_ra ...
- java.lang.NumberFormatException 错误及解决办法
package com.geelou.test; public class ErrTest { public static void main(String[] args) { String numS ...
- python之通过thread来实现多进程
代码如下: import threading, time class Test1(threading.Thread): def __init__(self, name): super().__init ...
- HTML&javaSkcript&CSS&jQuery&ajax(十)
HTML 1.SVG直接嵌入HTML网页 ,SVG 是使用XML描述2D图像的语言,Canvas通过JavaScript来绘制2D <svg xmlns="http://www.w3. ...
- poj3254 炮兵阵地弱化版,记数类dp
/* dp[i][j]表示到第i行的状态j有多少放置方式 */ #include<iostream> #include<cstring> #include<cstdio& ...