android如何查看cpu的占用率和内存泄漏
在分析内存优化的过程中,其中一个最重要的是我们如何查看cpu的占用率和内存的占用率呢,这在一定程度上很重要,经过查询资料,研究了一下,暂时了解到大概有以下几种方式,如果哪位高手有更好的办法,或者文中描述有错误,还望高手在下面留言,非常感谢!
一、 通过eclipse,ADT开发工具的DDMS来查看(Heap)
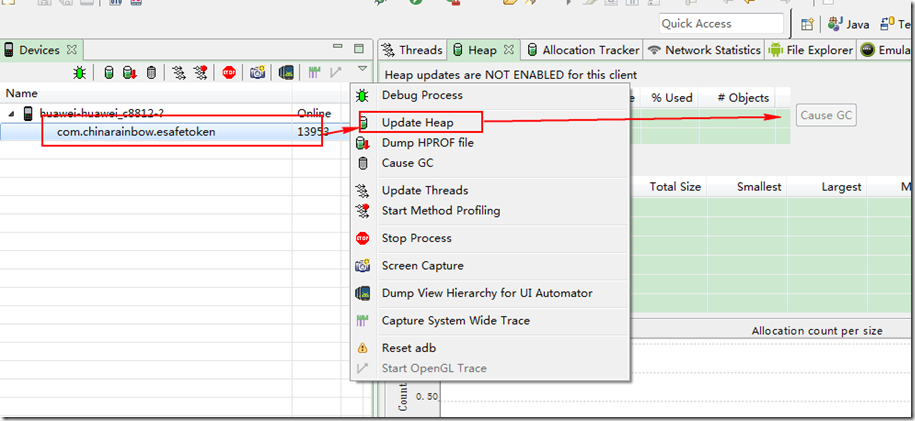
在“Devices”窗口中选择模拟器中的一个需要查看的程序,从工具条中选“Update heap”按钮,给这个程序设置上“heap Updates”,然后在Heap视图中点击Cause GC就可以实时显示这个程序的一些内存和cpu的使用情况了。
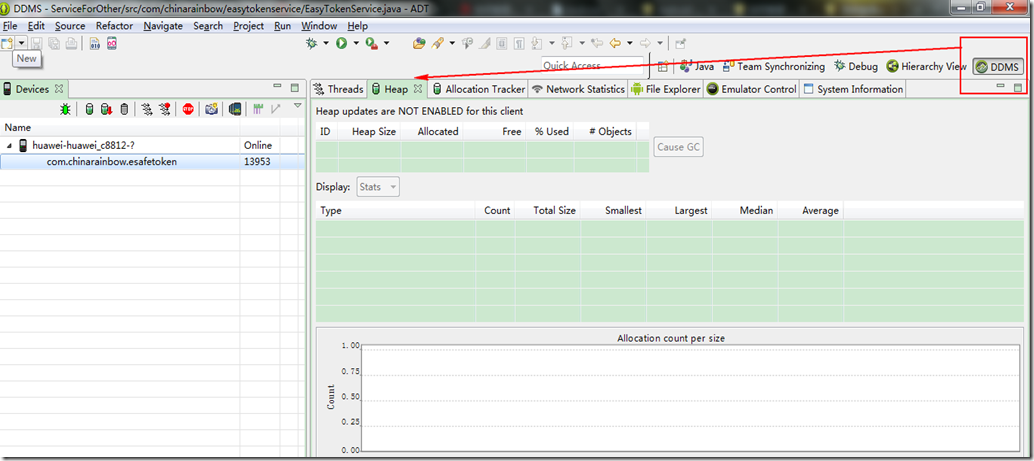
然后就会出现如下界面:
说明:
a) 点击“Cause GC”按钮相当于向虚拟机请求了一次gc操作;
b) 当内存使用信息第一次显示以后,无须再不断的点击“Cause GC”,Heap视图界面会定时刷新,在对应用的不断的操作过程中就可以看到内存使用的变化;
c) 内存使用信息的各项参数根据名称即可知道其意思,在此不再赘述。
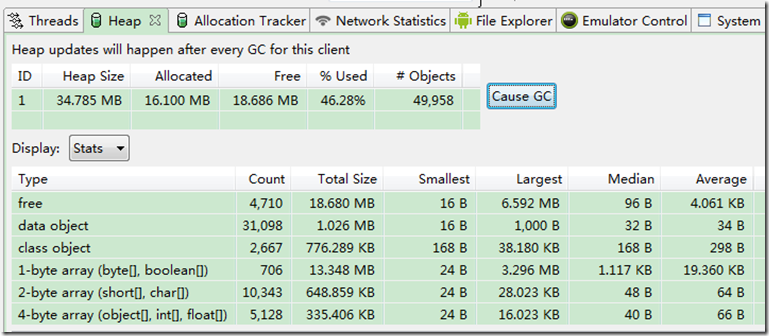
大致解析如下:
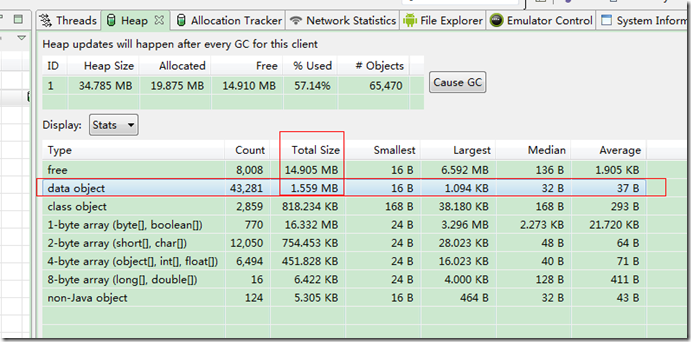
这个就是当前应用的内存占用,allocated 是已经分配的内存 free是空闲内存,
heap size 是虚拟机分配的 不是固定值
heap size 的最大值跟手机相关的

有网友说,
一般看1byte的大部分就是图片占用的
如何判断应用是否有内存泄漏的可能性呢?
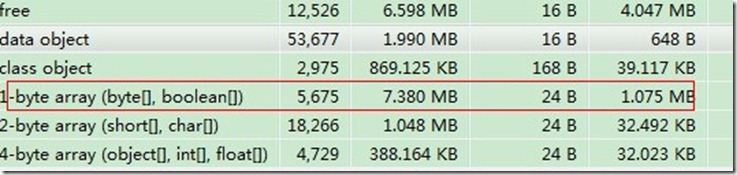
如何才能知道我们的程序是否有内存泄漏的可能性呢。这里需要注意一个值:Heap视图中部有一个Type叫做data object,即数据对象,也就是我们的程序中大量存在的类类型的对象。在data object一行中有一列是“Total Size”,其值就是当前进程中所有Java数据对象的内存总量,一般情况下,这个值的大小决定了是否会有内存泄漏。可以这样判断:
a) 不断的操作当前应用,同时注意观察data object的Total Size值;
b) 正常情况下Total Size值都会稳定在一个有限的范围内,也就是说由于程序中的的代码良好,没有造成对象不被垃圾回收的情况,所以说虽然我们不断的操作会不断的生成很多对 象,而在虚拟机不断的进行GC的过程中,这些对象都被回收了,内存占用量会会落到一个稳定的水平;
c) 反之如果代码中存在没有释放对象引用的情况,则data object的Total Size值在每次GC后不会有明显的回落,随着操作次数的增多Total Size的值会越来越大,
直到到达一个上限后导致进程被kill掉。
d) 此处已system_process进程为例,在我的测试环境中system_process进程所占用的内存的data object的Total Size正常情况下会稳定在2.2~2.8之间,而当其值超过3.55后进程就会被kill。
在如下的位置:
二、通过linux命令来查看
常用的命令有
adb shell
ps 是看进程的
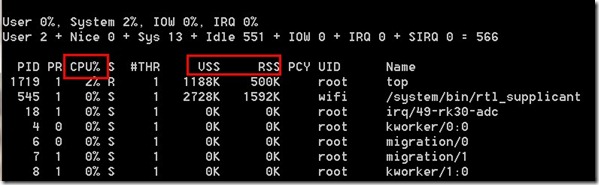
top命令是看占用率的
3.获取最大内存的方法
ActivityManager am = (ActivityManager) getSystemService(Context.ACTIVITY_SERVICE);
am.getMemoryClass();
这个是最大内存,如果超过这个内存就OOM了
---------------------------------------
内存耗用:VSS/RSS/PSS/USS 的介绍
- VSS - Virtual Set Size 虚拟耗用内存(包含共享库占用的内存)
- RSS - Resident Set Size 实际使用物理内存(包含共享库占用的内存)
- PSS - Proportional Set Size 实际使用的物理内存(比例分配共享库占用的内存)
- USS - Unique Set Size 进程独自占用的物理内存(不包含共享库占用的内存)
一般来说内存占用大小有如下规律:VSS >= RSS >= PSS >= USS
Overview
The aim of this post is to provide information that will assist in interpreting memory reports from various tools so the true memory usage for Linux processes and the system can be determined.
Android has a tool called procrank (/system/xbin/procrank), which lists out the memory usage of Linux processes in order from highest to lowest usage. The sizes reported per process are VSS, RSS, PSS, and USS.
For the sake of simplicity in this description, memory will be expressed in terms of pages, rather than bytes. Linux systems like ours manage memory in 4096 byte pages at the lowest level.
VSS (reported as VSZ from ps) is the total accessible address space of a process. This size also includes memory that may not be resident in RAM like mallocs that have been allocated but not written to. VSS is of very little use for determing real memory usage of a process.
RSS is the total memory actually held in RAM for a process. RSS can be misleading, because it reports the total all of the shared libraries that the process uses, even though a shared library is only loaded into memory once regardless of how many processes use it. RSS is not an accurate representation of the memory usage for a single process.
PSS differs from RSS in that it reports the proportional size of its shared libraries, i.e. if three processes all use a shared library that has 30 pages, that library will only contribute 10 pages to the PSS that is reported for each of the three processes. PSS is a very useful number because when the PSS for all processes in the system are summed together, that is a good representation for the total memory usage in the system. When a process is killed, the shared libraries that contributed to its PSS will be proportionally distributed to the PSS totals for the remaining processes still using that library. In this way PSS can be slightly misleading, because when a process is killed, PSS does not accurately represent the memory returned to the overall system.
USS is the total private memory for a process, i.e. that memory that is completely unique to that process. USS is an extremely useful number because it indicates the true incremental cost of running a particular process. When a process is killed, the USS is the total memory that is actually returned to the system. USS is the best number to watch when initially suspicious of memory leaks in a process.
For systems that have Python available, there is also a nice tool called smem that will report memory statistics including all of these categories.
# procrank
procrank
PID Vss Rss Pss Uss cmdline
481 31536K 30936K 14337K 9956K system_server
475 26128K 26128K 10046K 5992K zygote
526 25108K 25108K 9225K 5384K android.process.acore
523 22388K 22388K 7166K 3432K com.android.phone
574 21632K 21632K 6109K 2468K com.android.settings
521 20816K 20816K 6050K 2776K jp.co.omronsoft.openwnn
474 3304K 3304K 1097K 624K /system/bin/mediaserver
37 304K 304K 289K 288K /sbin/adbd
29 720K 720K 261K 212K /system/bin/rild
601 412K 412K 225K 216K procrank
1 204K 204K 185K 184K /init
35 388K 388K 182K 172K /system/bin/qemud
284 384K 384K 160K 148K top
27 376K 376K 148K 136K /system/bin/vold
261 332K 332K 123K 112K logcat
33 396K 396K 105K 80K /system/bin/keystore
32 316K 316K 100K 88K /system/bin/installd
269 328K 328K 95K 72K /system/bin/sh
26 280K 280K 93K 84K /system/bin/servicemanager
45 304K 304K 91K 80K /system/bin/qemu-props
34 324K 324K 91K 68K /system/bin/sh
260 324K 324K 91K 68K /system/bin/sh
600 324K 324K 91K 68K /system/bin/sh
25 308K 308K 88K 68K /system/bin/sh
28 232K 232K 67K 60K /system/bin/debuggerd
#
android如何查看cpu的占用率和内存泄漏的更多相关文章
- 【转】android如何查看cpu的占用率和内存泄漏
原文网址:http://www.cnblogs.com/yejiurui/p/3472765.html 在分析内存优化的过程中,其中一个最重要的是我们如何查看cpu的占用率和内存的占用率呢,这在一定程 ...
- linux上限制用户进程数、cpu占用率、内存使用率
限制进程CPU占用率的问题,给出了一个shell脚本代码如下: renice +10 `ps aux | awk '{ if ($3 > 0.8 && id -u $1 > ...
- C#获取CPU占用率、内存占用、磁盘占用、进程信息
代码: using System; using System.Collections.Generic; using System.Diagnostics; using System.Threading ...
- cpu真实占用率检測工具
windows任务管理器所示CPU占用,一直在不断的变动跳跃 ,并不能反应真实的平均CPU占用率.迅雷下载工具也是一样 ,有时这些知名软件,反倒是没有做的这么人性化,细致.或 许就是不想让人知道 ...
- Linux查看CPU《型号..》《内存..》《硬盘..》《系统..》
1.查看物理cpu个数 grep 'physical id' /proc/cpuinfo | sort -u | wc -l 2.查看核心数量grep 'core id' /proc/cpuinfo ...
- Android异常与性能优化相关面试问题-内存泄漏面试问题讲解
Java内存泄漏基础知识: Java的内存的分配策略 a.静态存储区:也叫方法区,主要是存放一些静态数据及全局变量等,在程序编译时就已经分配好了,并且在静态存储区中存放的变量在整个程序运行期间都存在. ...
- Android开发之漫漫长途 番外篇——内存泄漏分析与解决
该文章是一个系列文章,是本人在Android开发的漫漫长途上的一点感想和记录,我会尽量按照先易后难的顺序进行编写该系列.该系列引用了<Android开发艺术探索>以及<深入理解And ...
- Android中由Handler和内部类引起的内存泄漏
原文地址:http://johnnyshieh.github.io/android/2015/09/03/android-handler-memory-leak/ 在Android中我们经常用Hand ...
- Android Studio查看CPU使用率。
进入AS自带的CMD,依次输入: (1)进入Android Atudio安卓的目录: 1.H: 2.cd AndroidStudio\sdk\platform-tools (2)adb shell ( ...
随机推荐
- iOS开发调试篇—Print Description of "string"
Print Description of "string":把 string 的信息输出到控制台.Copy:复制 string 的信息,包含变量名,类名和值.View Value ...
- DevExpress的安装方法与破解教程【转】
DevExpress是一个界面控件套件,提供了一系列的界面控件套件的DotNet界面控件.DevExpress开发的控件有很强的实力,不仅功能丰富,应用简单,而且界面华丽,更可方便订制,对于编程人员来 ...
- 揭秘uc浏览器四
请问大家用过uc浏览器,他收藏一个网页是怎么操作的? 是不是这样,按菜单键——弹出添加网页,收藏网页等等的菜单操作,这个菜单操作很人性化了,并且在前面的篇幅已经说过了,这里不做太多的赘述了. 我这里只 ...
- GIT 如何在不提交Commit的情况下切换分支
最近遇到一个问题,事情是这样子的,刚刚接到客户说他的项目有问题,于是就打开本地的源码查看经过排查确定了问题,于是就开始进行修正工作 将问题修复好准备提交到git的时候发现当前的分支是不对的,但问题是我 ...
- Android7.0新特性,及Android N适配
新特性部分 Android 7.0 Nougat 提供新功能以提升性能.生产效率和安全性,主要新增了下面的新特性和优化: 一.新的Notification Android N 添加了很多新的notif ...
- C++ 函数适配器
1.考虑下面的需求,在一个int的vector中,找出一个比5的元素,容易想到的解决办法,定义一个方法对象,使用模板,如下:vector<int>::iterator iter = fin ...
- Elasticsearch之集群脑裂
https://www.cnblogs.com/zlslch/p/6477312.html
- poj2689 Prime Distance 有难度 埃拉托斯尼斯筛法的运用
我承认这道很难(对我来说),搞脑子啊,搞了好久,数论刚开始没多久,还不是很强大,思路有点死,主要是我 天赋太差,太菜了,希望多做做有所改善 开始解析: 首先要将在 [ l,u]内的所有素数找出来,还好 ...
- hadoop mahout 算法和API说明
org.apache.mahout.cf.taste.hadoop.item.RecommenderJob.main(args) --input 偏好数据路径,文本文件.格式 userid\t ite ...
- poj 1664 放苹果(递推)
题目链接:http://poj.org/problem? id=1664 放苹果 Time Limit: 1000MS Memory Limit: 10000K Total Submissions ...