ELK+Filebeat+redis整合
前面的博客,有具体的ELK安装配置步骤,此处在其基础上修改
修改配置文件并启动
[root@topcheer filebeat-6.2.3-linux-x86_64]# vim filebeat.yml

[root@topcheer filebeat-6.2.3-linux-x86_64]# ll

总用量 50772

drwxr-x---.  2 root root       39 12月  2 13:57 data

-rw-r--r--.  1 root root    44384 3月  13 2018 fields.yml

-rwxr-xr-x.  1 root root 49058867 3月  13 2018 filebeat

-rw-r--r--.  1 root root  1887159 12月  3 17:47 filebeat-7-5-0

-rw-r-----.  1 root root    52193 3月  13 2018 filebeat.reference.yml

-rw-------.  1 root root     7299 12月  3 17:58 filebeat.yml

drwxrwxr-x.  4 wgr  wgr        24 3月  13 2018 kibana

-rw-r--r--.  1 root root      583 3月  13 2018 LICENSE.txt

drwxr-xr-x. 14 wgr  wgr       179 3月  13 2018 module

drwxr-xr-x.  2 root root     4096 3月  13 2018 modules.d

-rw-------.  1 root root   604101 12月  3 17:58 nohup.out

-rw-r--r--.  1 root root   198236 3月  13 2018 NOTICE.txt

-rw-r--r--.  1 root root      802 3月  13 2018 README.md

[root@topcheer filebeat-6.2.3-linux-x86_64]# rm -rf nohup.out

[root@topcheer filebeat-6.2.3-linux-x86_64]# nohup ./filebeat -e -c filebeat.yml &

[1] 66345

[root@topcheer filebeat-6.2.3-linux-x86_64]# nohup: 忽略输入并把输出追加到"nohup.out"

[root@topcheer filebeat-6.2.3-linux-x86_64]# ll

总用量 50072

drwxr-x---.  2 root root       39 12月  3 17:58 data

-rw-r--r--.  1 root root    44384 3月  13 2018 fields.yml

-rwxr-xr-x.  1 root root 49058867 3月  13 2018 filebeat

-rw-r--r--.  1 root root  1887159 12月  3 17:47 filebeat-7-5-0

-rw-r-----.  1 root root    52193 3月  13 2018 filebeat.reference.yml

-rw-------.  1 root root     7299 12月  3 17:58 filebeat.yml

drwxrwxr-x.  4 wgr  wgr        24 3月  13 2018 kibana

-rw-r--r--.  1 root root      583 3月  13 2018 LICENSE.txt

drwxr-xr-x. 14 wgr  wgr       179 3月  13 2018 module

drwxr-xr-x.  2 root root     4096 3月  13 2018 modules.d

-rw-------.  1 root root     1708 12月  3 17:58 nohup.out

-rw-r--r--.  1 root root   198236 3月  13 2018 NOTICE.txt

-rw-r--r--.  1 root root      802 3月  13 2018 README.md

[root@topcheer filebeat-6.2.3-linux-x86_64]# tail -200f nohup.out

2019-12-03T17:58:50.916+0800    INFO    instance/beat.go:468    Home path: [/mnt/filebeat-6.2.3-linux-x86_64] Config path: [/mnt/filebeat-6.               2.3-linux-x86_64] Data path: [/mnt/filebeat-6.2.3-linux-x86_64/data] Logs path: [/mnt/filebeat-6.2.3-linux-x86_64/logs]

2019-12-03T17:58:50.926+0800    INFO    instance/beat.go:475    Beat UUID: 6e3ca243-535f-4f7b-946d-c1172536d8f5

2019-12-03T17:58:50.926+0800    INFO    instance/beat.go:213    Setup Beat: filebeat; Version: 6.2.3

2019-12-03T17:58:50.928+0800    INFO    pipeline/module.go:76   Beat name: topcheer

2019-12-03T17:58:50.980+0800    INFO    instance/beat.go:301    filebeat start running.

2019-12-03T17:58:50.981+0800    INFO    registrar/registrar.go:108      Loading registrar data from /mnt/filebeat-6.2.3-linux-x86_64/data/re               gistry

2019-12-03T17:58:50.981+0800    INFO    [monitoring]    log/log.go:97   Starting metrics logging every 30s

2019-12-03T17:58:50.993+0800    INFO    registrar/registrar.go:119      States Loaded from registrar: 2

2019-12-03T17:58:50.993+0800    WARN    beater/filebeat.go:261  Filebeat is unable to load the Ingest Node pipelines for the configured modu               les because the Elasticsearch output is not configured/enabled. If you have already loaded the Ingest Node pipelines or are using Logstash p               ipelines, you can ignore this warning.
配置文件信息filebeat.yml
- type: log

  # Change to true to enable this prospector configuration.

  enabled: true

  # Paths that should be crawled and fetched. Glob based paths.

  paths:

    - /var/log/nginx/*.log

    #- c:\programdata\elasticsearch\logs\*

output.redis:

  # The Redis hosts

  hosts: ["192.168.180.113:6379"]

  key: "nginx-log"

  db: 0
启动logstash
[root@topcheer logstash-6.2.3]# vim redis.conf

[root@topcheer logstash-6.2.3]# rm -rf nohup.out

[root@topcheer logstash-6.2.3]# nohup bin/logstash -f redis.conf &

[14] 37766

[root@topcheer logstash-6.2.3]# nohup: 忽略输入并把输出追加到"nohup.out"

[root@topcheer logstash-6.2.3]# tail -200f nohup.out

Sending Logstash's logs to /mnt/logstash-6.2.3/logs which is now configured via log4j2.properties

[2019-12-03T18:03:42,080][INFO ][logstash.modules.scaffold] Initializing module {:module_name=>"fb_apache", :directory=>"/mnt/logstash-6.2.3               /modules/fb_apache/configuration"}

[2019-12-03T18:03:42,268][INFO ][logstash.modules.scaffold] Initializing module {:module_name=>"netflow", :directory=>"/mnt/logstash-6.2.3/m               odules/netflow/configuration"}

[2019-12-03T18:03:45,727][WARN ][logstash.config.source.multilocal] Ignoring the 'pipelines.yml' file because modules or command line option               s are specified

[2019-12-03T18:03:52,276][INFO ][logstash.runner          ] Starting Logstash {"logstash.version"=>"6.2.3"}

[2019-12-03T18:03:54,771][INFO ][logstash.agent           ] Successfully started Logstash API endpoint {:port=>9600}

[2019-12-03T18:03:59,664][INFO ][logstash.pipeline        ] Starting pipeline {:pipeline_id=>"main", "pipeline.workers"=>4, "pipeline.batch.               size"=>125, "pipeline.batch.delay"=>50}

[2019-12-03T18:04:00,579][INFO ][logstash.outputs.elasticsearch] Elasticsearch pool URLs updated {:changes=>{:removed=>[], :added=>[http://1               27.0.0.1:9200/]}}

[2019-12-03T18:04:00,596][INFO ][logstash.outputs.elasticsearch] Running health check to see if an Elasticsearch connection is working {:hea               lthcheck_url=>http://127.0.0.1:9200/, :path=>"/"}

[2019-12-03T18:04:01,025][WARN ][logstash.outputs.elasticsearch] Restored connection to ES instance {:url=>"http://127.0.0.1:9200/"}

[2019-12-03T18:04:01,219][INFO ][logstash.outputs.elasticsearch] ES Output version determined {:es_version=>6}

[2019-12-03T18:04:01,224][WARN ][logstash.outputs.elasticsearch] Detected a 6.x and above cluster: the `type` event field won't be used to d               etermine the document _type {:es_version=>6}
logstash配置文件
[root@topcheer logstash-6.2.3]# cat redis.conf

input {

        redis {

        host => "192.168.180.113"

        data_type => "list"

        port => ""

        key => "nginx-log"

        type => "redis-input"

        codec => plain {

                charset => "UTF-8"

     }

    }

}

filter {

    json{

        source =>"message"

        }

}

output {

    elasticsearch {

        hosts => ["127.0.0.1:9200"]

        codec => "json"

    }

}

[root@topcheer logstash-6.2.3]#
启动Kibana
[root@topcheer kibana-6.2.3-linux-x86_64]# rm -rf nohup.out

[root@topcheer kibana-6.2.3-linux-x86_64]# nohup bin/kibana &

[16] 37870

[root@topcheer kibana-6.2.3-linux-x86_64]# nohup: 忽略输入并把输出追加到"nohup.out"

[root@topcheer kibana-6.2.3-linux-x86_64]# ll

总用量 1164

drwxr-xr-x   2 wgr  wgr       64 3月  13 2018 bin

drwxrwxr-x   2 wgr  wgr       24 12月  2 11:01 config

drwxrwxr-x   2 wgr  wgr       18 9月  21 23:35 data

-rw-rw-r--   1 wgr  wgr      562 3月  13 2018 LICENSE.txt

drwxrwxr-x   6 wgr  wgr      108 3月  13 2018 node

drwxrwxr-x 906 wgr  wgr    28672 3月  13 2018 node_modules

-rw-------   1 root root       0 12月  3 18:05 nohup.out

-rw-rw-r--   1 wgr  wgr  1129761 3月  13 2018 NOTICE.txt

drwxrwxr-x   3 wgr  wgr       45 3月  13 2018 optimize

-rw-rw-r--   1 wgr  wgr      721 3月  13 2018 package.json

drwxrwxr-x   2 wgr  wgr        6 3月  13 2018 plugins

-rw-rw-r--   1 wgr  wgr     4772 3月  13 2018 README.txt

drwxr-xr-x  15 wgr  wgr      225 3月  13 2018 src

drwxrwxr-x   5 wgr  wgr       47 3月  13 2018 ui_framework

drwxr-xr-x   2 wgr  wgr      290 3月  13 2018 webpackShims

[root@topcheer kibana-6.2.3-linux-x86_64]# tail -200f nohup.out

{"type":"log","@timestamp":"2019-12-03T10:06:46Z","tags":["status","plugin:kibana@6.2.3","info"],"pid":37870,"state":"green","message":"Stat               us changed from uninitialized to green - Ready","prevState":"uninitialized","prevMsg":"uninitialized"}

{"type":"log","@timestamp":"2019-12-03T10:06:46Z","tags":["status","plugin:elasticsearch@6.2.3","info"],"pid":37870,"state":"yellow","messag               e":"Status changed from uninitialized to yellow - Waiting for Elasticsearch","prevState":"uninitialized","prevMsg":"uninitialized"}

{"type":"log","@timestamp":"2019-12-03T10:06:47Z","tags":["status","plugin:console@6.2.3","info"],"pid":37870,"state":"green","message":"Sta               tus changed from uninitialized to green - Ready","prevState":"uninitialized","prevMsg":"uninitialized"}

{"type":"log","@timestamp":"2019-12-03T10:06:47Z","tags":["status","plugin:timelion@6.2.3","info"],"pid":37870,"state":"green","message":"St               atus changed from uninitialized to green - Ready","prevState":"uninitialized","prevMsg":"uninitialized"}

{"type":"log","@timestamp":"2019-12-03T10:06:48Z","tags":["status","plugin:metrics@6.2.3","info"],"pid":37870,"state":"green","message":"Sta               tus changed from uninitialized to green - Ready","prevState":"uninitialized","prevMsg":"uninitialized"}

{"type":"log","@timestamp":"2019-12-03T10:06:48Z","tags":["listening","info"],"pid":37870,"message":"Server running at http://192.168.180.11               3:5601"}

{"type":"log","@timestamp":"2019-12-03T10:06:50Z","tags":["status","plugin:elasticsearch@6.2.3","info"],"pid":37870,"state":"green","message               ":"Status changed from yellow to green - Ready","prevState":"yellow","prevMsg":"Waiting for Elasticsearch"}

{"type":"response","@timestamp":"2019-12-03T10:07:46Z","tags":[],"pid":37870,"method":"get","statusCode":200,"req":{"url":"/","method":"get"               ,"headers":{"host":"192.168.180.113:5601","connection":"keep-alive","upgrade-insecure-requests":"","user-agent":"Mozilla/5.0 (Windows NT 10               .0; Win64; x64) AppleWebKit/537.36 (KHTML, like Gecko) Chrome/73.0.3683.103 Safari/537.36","accept":"text/html,application/xhtml+xml,applica               tion/xml;q=0.9,image/webp,image/apng,*/*;q=0.8,application/signed-exchange;v=b3","accept-encoding":"gzip, deflate","accept-language":"zh-CN,               zh;q=0.9,en-US;q=0.8,en;q=0.7"},"remoteAddress":"192.168.180.1","userAgent":"192.168.180.1"},"res":{"statusCode":200,"responseTime":178,"con               tentLength":9},"message":"GET / 200 178ms - 9.0B"}
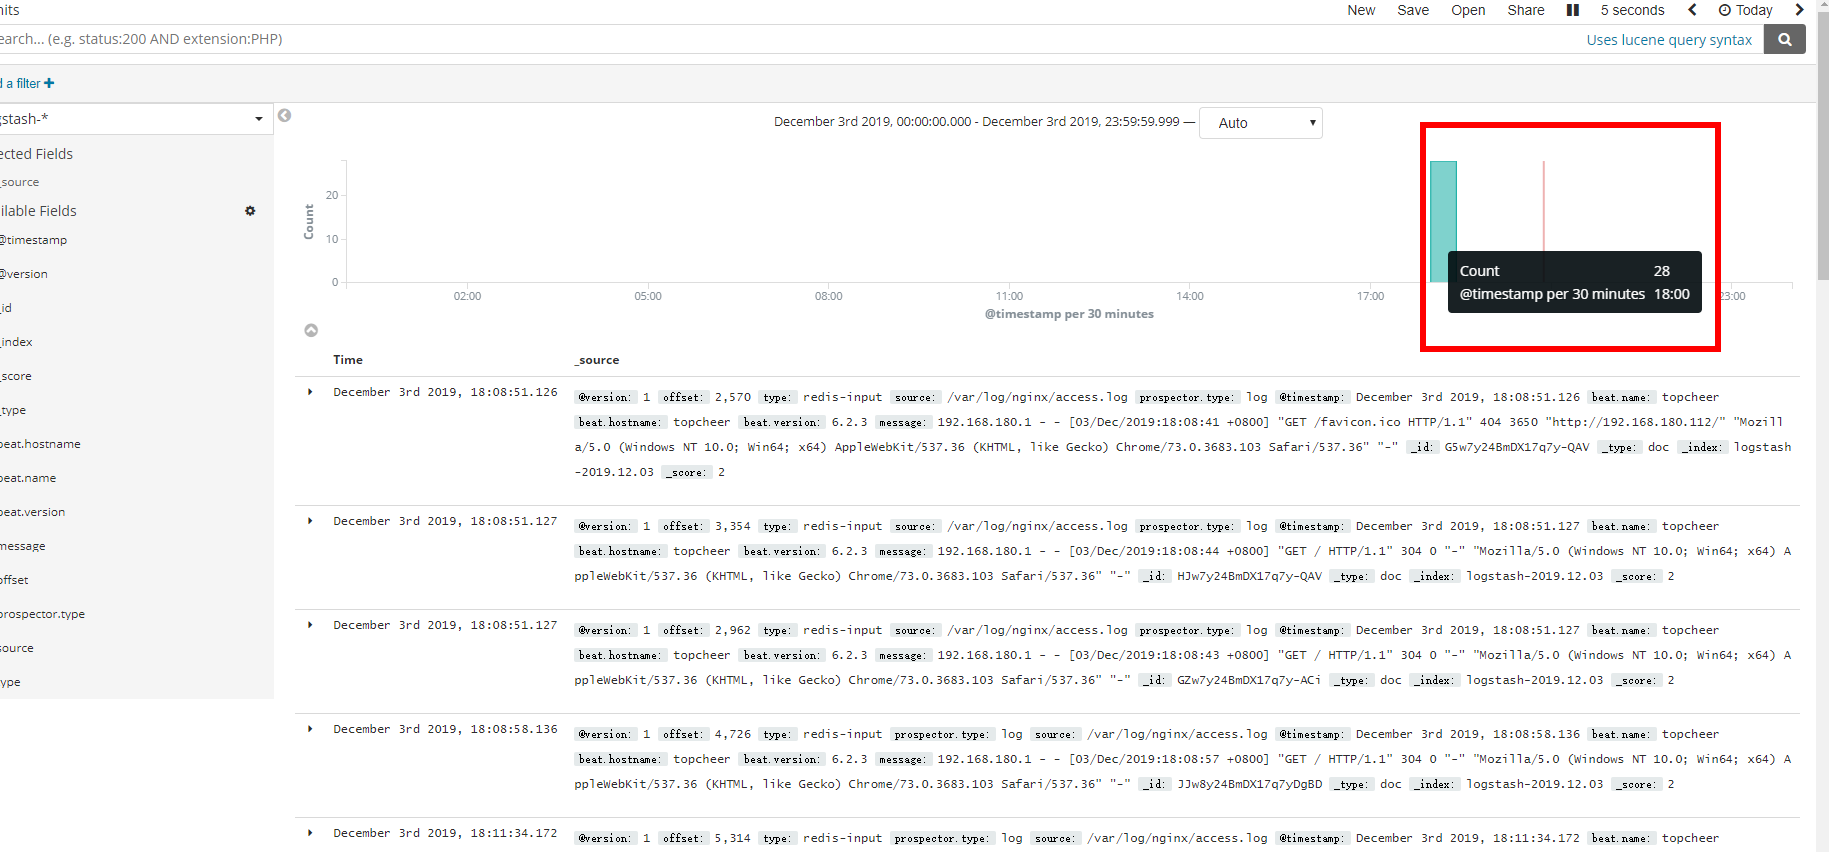
测试,多次发起请求
ELK+Filebeat+redis整合的更多相关文章
- ELK+filebeat+redis 日志分析平台
一.简介 ELK Stack是软件集合Elasticsearch.Logstash.Kibana的简称,由这三个软件及其相关的组件可以打造大规模日志实时处理系统. 其中,Elasticsearch 是 ...
- ELK+Filebeat+Kafka+ZooKeeper 构建海量日志分析平台(elk5.2+filebeat2.11)
ELK+Filebeat+Kafka+ZooKeeper 构建海量日志分析平台 参考:http://www.tuicool.com/articles/R77fieA 我在做ELK日志平台开始之初选择为 ...
- Docker 部署 elk + filebeat
Docker 部署 elk + filebeat kibana 开源的分析与可视化平台logstash 日志收集工具 logstash-forwarder(原名lubmberjack)elastics ...
- elk + filebeat,6.3.2版本简单搭建,实现我们自己的集中式日志系统
前言 刚从事开发那段时间不习惯输出日志,认为那是无用功,徒增代码量,总认为自己的代码无懈可击:老大的叮嘱.强调也都视为耳旁风,最终导致的结果是我加班排查问题,花的时间还挺长的,要复现问题.排查问题等, ...
- filebeat+redis+logstash+elasticsearch+kibana搭建日志分析系统
filebeat+redis+elk搭建日志分析系统 官网下载地址:https://www.elastic.co/downloads 1.下载安装filebeat wget https://artif ...
- ELK+FileBeat+Log4Net
ELK+FileBeat+Log4Net搭建日志系统 output { elasticsearch { hosts => ["localhost:9200"] } stdou ...
- ELK+FileBeat+Log4Net搭建日志系统
ELK+FileBeat+Log4Net搭建日志系统 来源:https://www.zybuluo.com/muyanfeixiang/note/608470 标签(空格分隔): ELK Log4Ne ...
- SpringMVC+redis整合
在网络上有一个很多人转载的springmvc+redis整合的案例,不过一直不完整,也是被各种人装来转去,现在基本将该框架搭建起来. package com.pudp.bae.base; import ...
- Nginx+Lua+Redis整合实现高性能API接口 - 网站服务器 - LinuxTone | 运维专家网论坛 - 最棒的Linux运维与开源架构技术交流社区! - Powered by Discuz!
Nginx+Lua+Redis整合实现高性能API接口 - 网站服务器 - LinuxTone | 运维专家网论坛 - 最棒的Linux运维与开源架构技术交流社区! - Powered by Disc ...
随机推荐
- Python pymysql对数据库的基础操作
示例数据库名demo,表名info select * from info; 查看该表数据 +----+-------+--------+-----+---------------------+---- ...
- python 并发编程 多线程 死锁现象与递归锁
一 死锁现象 所谓死锁: 是指两个或两个以上的进程或线程在执行过程中,因争夺资源而造成的一种互相等待的现象,若无外力作用,它们都将无法推进下去.此时称系统处于死锁状态或系统产生了死锁,这些永远在互相等 ...
- 2019JAVA第三次实验报告
Java实验报告 班级 计科二班 学号 20188442 姓名 吴怡君 完成时间 2019.9.24 评分等级 实验三 String类的应用 一.实验目的 掌握类String类的使用: 学会使用JDK ...
- python 传址 与传值(暂时保存,后续做分类)
# python 传址 与 传值 # 定义一个函数 用于将 list 下标为2的数据加100 并进行打印 该list def test1(list): list[2]+=100 print(list) ...
- idea运行时 Process finished with exit code -1073741819 (0xC0000005)
问题描述: idea中启动项目报 Process finished with exit code -1073741819 (0xC0000005) ,如图所示: 问题解决: ...
- Axios 的基本使用
Axios 是一个基于 promise 的HTTP 库, 可以用在浏览器和 node.js 中. 1. 从浏览器创建 XMLHttpRequests 2. 从node.js 创建 http 请求 3. ...
- Spring Security框架进阶、自定义登录
1.Spring Security框架进阶 1.1 Spring Security简介 Spring Security是一个能够为基于Spring的企业应用系统提供声明式的安全访问控制解决方案的安 ...
- MARKDOWN使用文档
ISSUE引用 引用当前项目内的ISSUE #1 markdown写法 #1 引用当前命名空间下的其他项目内的ISSUE projectname#1 sofa_ta#1 markdown写法 sofa ...
- ExpressionTree学习笔记
概述: 这段时间需要制定自定义查询条件,感觉有必要学习ExpressionTree. 学习参考资料:https://msdn.microsoft.com/en-us/library/mt654263. ...
- Linux 查看系统相关信息(系统发型版本及内核版本等)
以下为 Linux 以下信息查看命令,记录以备用 # uname -a # 查看内核/操作系统/CPU信息 # /etc/issue # 查看操作系统版本 # cat /proc/cpuinfo # ...