使用 Prometheus Alertmanager 模块发送 Doris 异常信息至钉钉报警群
基础环境
1.Prometheus 版本:2.22.2
下载地址:
2.Alertmanager 版本:0.23
下载地址:
3.prometheus-webhook-dingtalk :1.4
下载地址:
1.新增用户和用户组
➜ groupadd prometheus

➜ useradd -g prometheus -M -s /sbin/nologin prometheus
2.安装配置 Prometheus Server
详细 Prometheus 安装流程请参考:https://mp.weixin.qq.com/s/BcKN4s7qDokG_YmXn8Q-zQ需要确保服务启动完成后,可以正常访问:http://localhost:9090,且 Doris 的 metrics 已经打入 Prometheus 中。
3.安装 AlertManager 模块
3.1 下载安装包
➜ wget https://github.com/prometheus/alertmanager/releases/download/v0.23.0/alertmanager-0.23.0.linux-amd64.tar.gz

➜ tar xf alertmanager-0.23.0.linux-amd64.tar.gz -C /soft

➜ cd /soft

➜ mv alertmanager-0.23.0.linux-amd64 alertmanager

➜ cd alertmanager

➜ mkdir data #系统文件持久化路径

➜ chown -R prometheus.prometheus /soft/alertmanager
说明:创建 data 目录是必须要操作的,不然后期启动 alertmanager 会异常。
3.2 配置 alertmanager.yml 文
route:

  group_by: ['alertname']

  group_wait: 1s

  group_interval: 1m

  repeat_interval: 4h

  receiver: 'webhook2'

receivers:

- name: 'webhook2'

  webhook_configs:

    - &dingtalk_config

       send_resolved: true

       url: http://localhost:8060/dingtalk/webhook2/send

#An inhibition rule mutes an alert (target) matching a set of matchers when an alert (source) exists that matches another set of matchers. Both target and source alerts must have the same label values for the label names in the equal list.

inhibit_rules:

  - source_match:

      severity: 'critical'

    target_match:

      severity: 'warning'

    equal: ['alertname', 'dev', 'instance']
名词解释:
- group_wait :设置等待时间,如果在等待时间内当前 Group 接收到了新的告警,这些告警将会合并为一个通知向 Receiver 发送。
- group_interval :用于定义相同的 Group 之间发送告警通知的时间间隔。
- repeat_interval:用于表示当一个规则成功被发送,重复发送报警的第二次间隔时间。
3.3 检查配置文件配置
很重要,关乎程序能否正常启动。当出现如下图片时,说明 alertmanager.yml 文件配置正常。
➜ cd /soft/alertmanager

➜ ./amtool check-config ./alertmanager.yml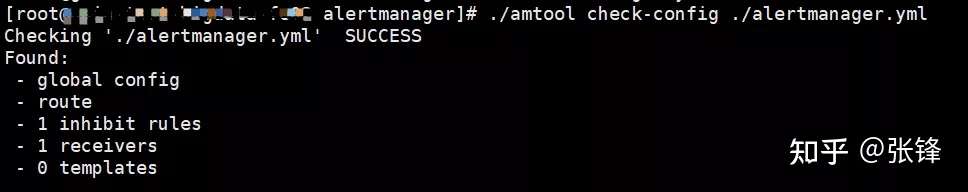
3.4 创建 Alertmanager 系统服务启动文件
➜ vim /usr/lib/systemd/system/alertmanager.service

[Unit]

Description=alertmanager

Documentation=https://prometheus.io/

After=network.target

[Service]

User=prometheus

Group=prometheus

ExecStart=/soft/alertmanager/alertmanager --config.file=/soft/alertmanager/alertmanager.yml --storage.path=/soft/alertmanager/data

Restart=on-failure

[Install]

WantedBy=multi-user.target
3.5 启动服务
systemctl daemon-reload

systemctl enable alertmanager.service

systemctl start alertmanager.service

systemctl status alertmanager.service #查看服务状态

systemctl restart alertmanager.service #重启服务使用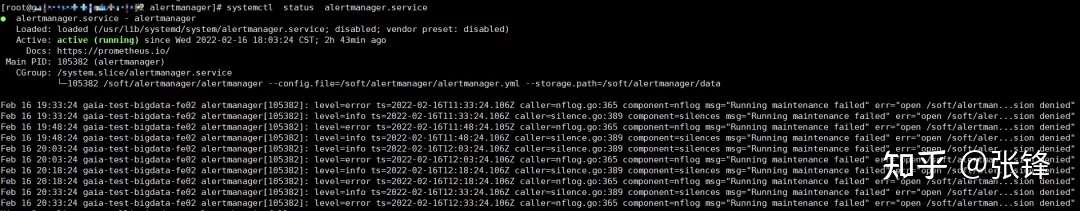
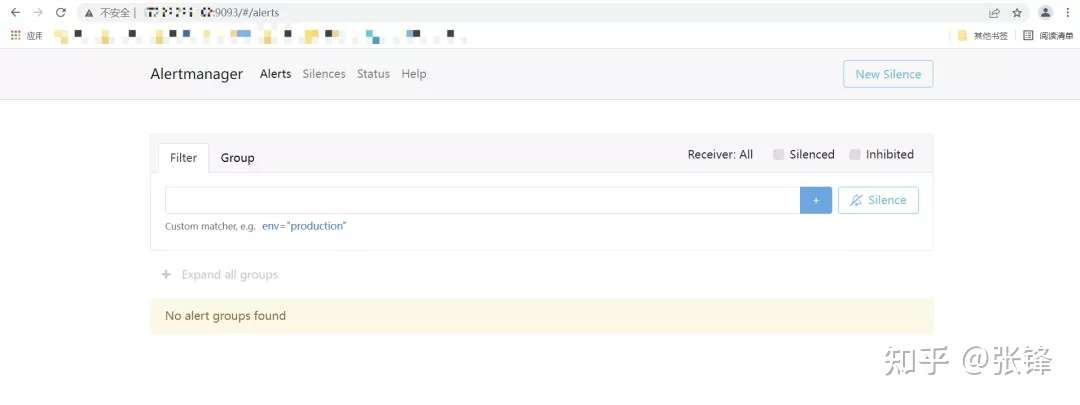
3.6 启动服务后
服务启动后,可以在http://localhost:9093查看ui界面
3.7 在 Prometheus 中配置 Alertmanager 模块需要在 Prometheus 的安装目录下的 prometheus.yml 文件中加入 Alertmanager 通信地址和端口号,同时配置 alert rules 目录,该目录主要存放配置的报警规则。
vim prometheus.yml

alerting:

  alertmanagers:

  - static_configs:

    - targets: ['localhost:9093']  #根据实际alertmanager服务地址配置。

rule_files:

   - "rule/*.yml"   #自定义规则存储目录,可以通过*.yml来通配该目录下所有规则。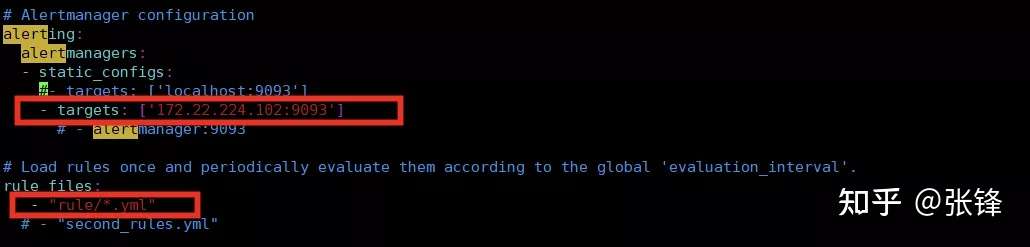
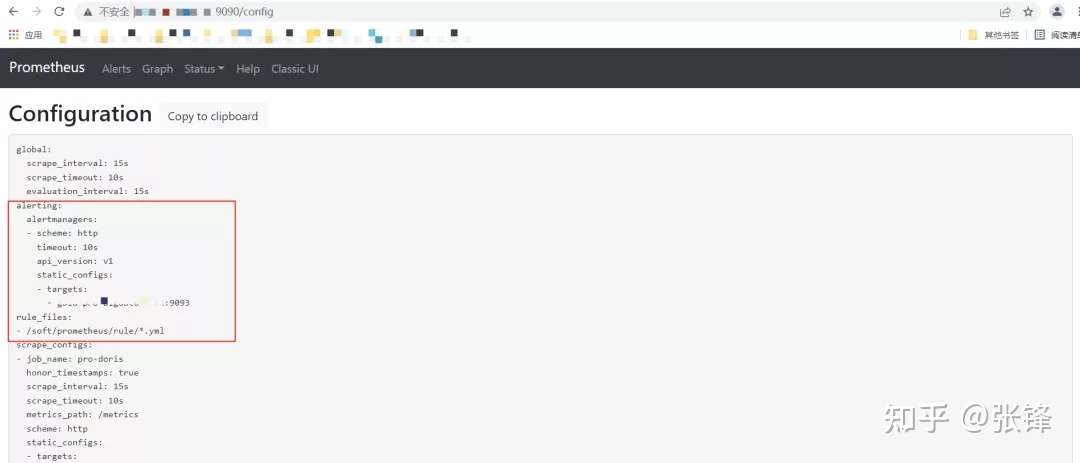
3.8 重新加载 Prometheus 配置文件,查看 alerting 配置是否生效
Prometheus 服务支持热加载。当配置文件发生改变时,可以通过以下命令重新加载配置文件:
➜ ./promtool check config  prometheus.yml

➜ systemctl reload prometheus.service
重启成功后,可以通过:http://localhost:9090/config查看 alerting 配置是否生效。
4.安装 prometheus-webhook-dingtalk 插件
4.1 下载插件
➜ wget https://github.com/timonwong/prometheus-webhook-dingtalk/releases/download/v1.4.0/prometheus-webhook-dingtalk-1.4.0.linux-amd64.tar.gz
➜ tar -xf prometheus-webhook-dingtalk-1.4.0.linux-amd64.tar.gz -C /soft
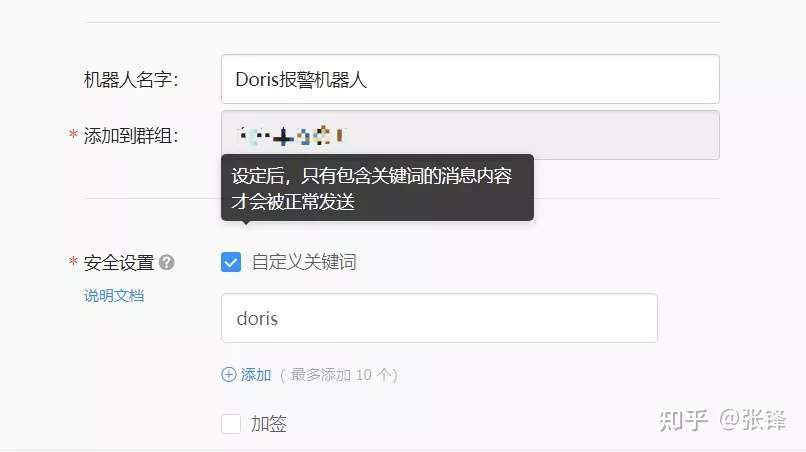
➜ mv prometheus-webhook-dingtalk-1.4.0.linux-amd64 prometheus-webhook-dingtalk4.2 在钉钉群配置机器人配置机器人时,需要添加自定义关键词,这个关键词后期在配置规则报警信息时,也同样需要出现,不然无法发送报警。
4.3 修该配置文件在 webhook2 中配置刚才申请的机器人的地址,需要注意的是你的机器人路径配置在哪,那么 alertmanager.yml 中的 url 路径也要随之改变。
➜ cp  config.example.yml  config.yml

## Request timeout

# timeout: 5s

## Customizable templates path   自定义模板位置

templates:

  - /soft/alertmanager/alarm_template/webhook.tmpl

## You can also override default template using `default_message`

## The following example to use the 'legacy' template from v0.3.0

# default_message:

#   title: '{{ template "legacy.title" . }}'

#   text: '{{ template "legacy.content" . }}'

## Targets, previously was known as "profiles"

targets:

  webhook1:   #加签的钉钉,需要同时配置加签机器人的密钥信息

    url: https://oapi.dingtalk.com/robot/send?access_token=xxxxxxxxxxxx

    # secret for signature

    secret: SEC000000000000000000000

  webhook2:  #不加签钉钉

    url: https://oapi.dingtalk.com/robot/send?access_token=cf9c2fd69723661108b7fd7******

  webhook_legacy:

    url: https://oapi.dingtalk.com/robot/send?access_token=xxxxxxxxxxxx

    # Customize template content

    message:

      # Use legacy template

      title: '{{ template "legacy.title" . }}'

      text: '{{ template "legacy.content" . }}'

  webhook_mention_all:  #@所有人钉钉

    url: https://oapi.dingtalk.com/robot/send?access_token=xxxxxxxxxxxx

    mention:

      all: true

  webhook_mention_users:  #@指定用户钉钉

    url: https://oapi.dingtalk.com/robot/send?access_token=cf9c2fd69723661108b7fd7****

    mention:

      mobiles: ['152****30', '134****74']
4.4 创建 webhook-dingtalk 系统服务启动文件
vim /usr/lib/systemd/system/webhook-dingtalk.service

[Unit]

[Unit]

Description=prometheus-webhook-dingtalk

Documentation=https://github.com/timonwong/prometheus-webhook-dingtalk

After=network.target

[Service]

User=prometheus

Group=prometheus

ExecStart=/soft/prometheus-webhook-dingtalk/prometheus-webhook-dingtalk  --config.file=/soft/prometheus-webhook-dingtalk/config.yml

Restart=on-failure

[Install]

WantedBy=multi-user.target
4.5 启动服务
systemctl daemon-reload
systemctl enable webhook-dingtalk.service
systemctl start webhook-dingtalk.service
systemctl status webhook-dingtalk.service
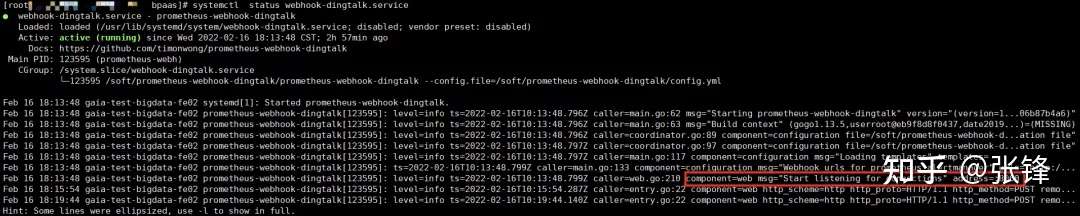
systemctl restart webhook-dingtalk.service4.6 查看 webhook-dingtalk 服务状态
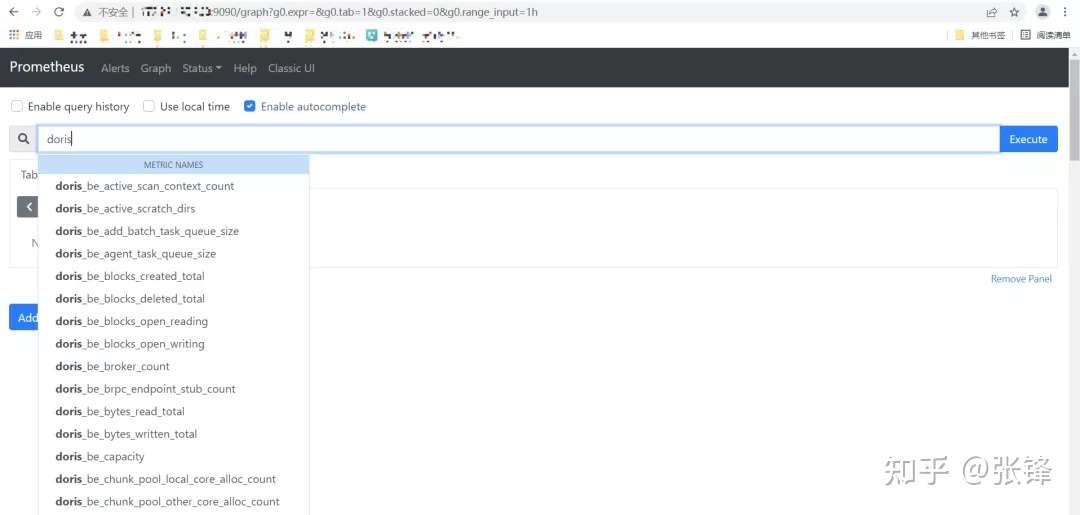
5.配置报警规则
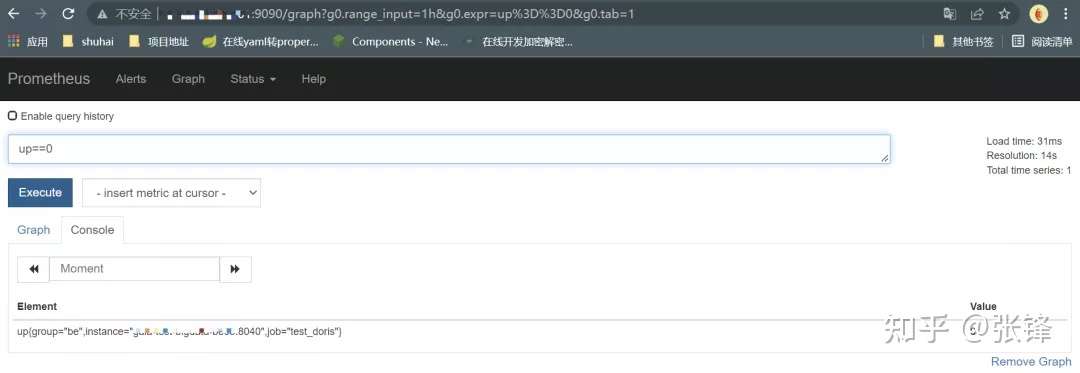
在 Prometheus 安装目录下的 prometheus.yml 文件中查看“rule_files”对应配置的目录地址,在该目录下新建报警规则。如果不清楚规则如何配置,可以在你安装的 Prometheus 的 UI 地址:http://localhost:9090/graph下查看 metrics 信息。example:
5.1 配置 Doris fe 和 be 报警规则当 Doris instance 是正常状态时,up ==1;当instance down机后,up ==0注意:配置报警规则时,报警机器人自定义的关键字,在配置规则文件的 description 中必须要出现,不然钉钉群无法接收到报警信息。
➜ vim doris_instance.yml

groups:

  - name: doris_instance_down

    rules:

      - alert: Doris Backends Down

        expr: up {group="be", job="pro-doris"} == 0

        for: 20s

        labels:

          user: doris

          severity: error

        annotations:

          summary: "doris Instance {{ $labels.instance }} down"

          description: "doris {{ $labels.instance }} of job {{ $labels.job }} has been down for more than 20s."

      - alert: Doris Frontends Down

        expr: up {group="fe", job="pro-doris"} == 0

        for: 20s

        labels:

          user: doris

          severity: error

        annotations:

          summary: "doris Instance {{ $labels.instance }} down"

          description: "doris {{ $labels.instance }} of job {{ $labels.job }} has been down for more than 20s."
5.2 校验规则文件如果是规则文件是 “SUCCESS” 状态,则说明规则文件配置正确,否则则需要检查配置对应的配置文件。
➜ cd /soft/prometheus

➜ ./promtool check config  prometheus.yml
5.3 重新加载 Prometheus 配置文件
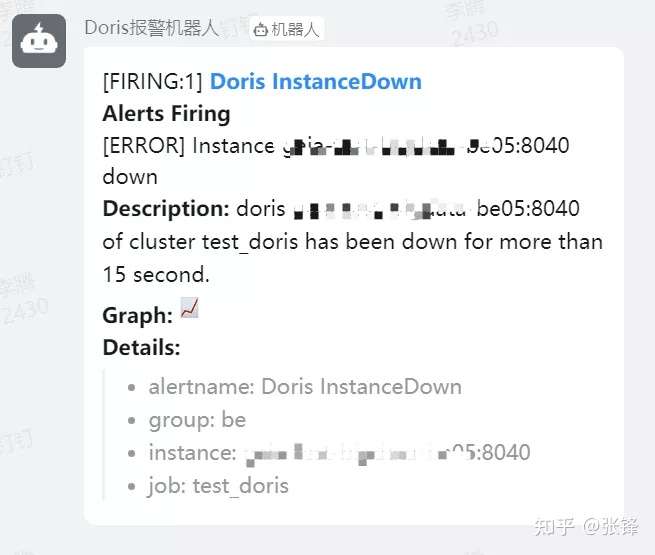
➜ systemctl reload prometheus.service6.测试
当 Doris 集群中的 instance 出现 down 机后,钉钉群里新建的机器人会发出报警信息。
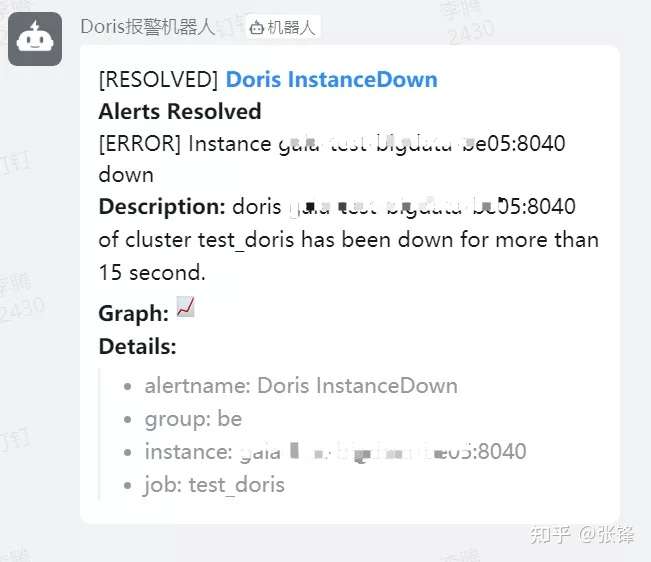
当在 alertmanager.yml 文件中配置了 send_resolved = true,异常解除同样会发送钉钉警告信息,否则则不发送。
至此,Prometheus 监控 Doris 异常信息并发送报警至钉钉流程结束
使用 Prometheus Alertmanager 模块发送 Doris 异常信息至钉钉报警群的更多相关文章
- Prometheus alertmanager邮件发送+grafana告警展示
前言 前面一篇博客,我已经介绍了prometheus如何监控mysql. 这一篇我来介绍如何通过alertmanger进行告警邮件发送(微信或钉钉类似,因为需要企业帐户,我就不试了),以及如何通过gr ...
- 验证Prometheus alertmanager邮件发送
新环境上配置alertmanager时出现了“Client was not authenticated to send anonymous mail during MAIL FROM”错误,但老环境上 ...
- 通过GSM模块发送经纬度求救信息。
本博客作为实验笔记,仅供学习交流.(转载请注明出处) 本实验通过GSM模块:SIM900a,实现向特定手机发送sos求救信号,并且利用GPS模块:微科VK2828U7G5LF,将经纬度信息同时发送到手 ...
- PHP 错误与异常 笔记与总结(14 )记录和发送异常信息
当发生异常时,把异常信息记录到日志文件中: <?php header('content-type:text/html; charset=utf-8'); class LogException e ...
- Prometheus + Alertmanager 实现企微告警
上一篇:二进制安装Prometheus 下面准备在监控的流程中呈现到告警到企微 查看企业ID,用于后续配置文件 四.安装Alertmanager1.准备安装的包 --选择上面链接给的Linux的ta ...
- Longhorn,企业级云原生容器分布式存储 - 监控(Prometheus+AlertManager+Grafana)
内容来源于官方 Longhorn 1.1.2 英文技术手册. 系列 Longhorn 是什么? Longhorn 企业级云原生容器分布式存储解决方案设计架构和概念 Longhorn 企业级云原生容器分 ...
- [置顶]
个人微信号发送zabbix告警信息
之前使用邮件和短信发送zabbix告警信息,但告警信息无法实时查看或者无法发送,故障无法及时通知运维人员. 后来使用第三方微信接口发送信息,愉快地用了一年多,突然收费了. zabbix告警一直是我的痛 ...
- prometheus学习系列十: Prometheus AlertManager配置文件说明
alertmanager配置文件说明 alertmanager是通过命令行标记和配置文件配置的,命令行标记配置不可变的系统参数,配置文件定义抑制规则.通知路由和通知接收器.可以通过官方提供的routi ...
- prometheus学习系列九: Prometheus AlertManager使用
在Prometheus的报警系统中,是分为2个部分的, 规则是配置是在prometheus中的, prometheus组件完成报警推送给alertmanager的, alertmanager然后管理这 ...
随机推荐
- winform 代码生成textbox ,checkbox
参考地址:https://jingyan.baidu.com/article/380abd0a6b80701d90192cde.html 首先搭建好Winform项目框架后,创建窗体页面后自行布局 这 ...
- 浅析MySQL恶意服务器读取文件原理
前言 注:本文不涉及对MySQL协议报文研究,仅讲解原理,并且做部分演示. 搭建MySQL恶意服务器读取文件这件事,虽然直接利用门槛较高,但是由于在网上看到了一种比较新颖的利用方式(利用社会工程学引诱 ...
- 《Win10——如何进入高级启动选项?》
Win10--如何进入高级启动选项? 第一种方法: 管理员命令提示符输入如下代码,自动重启并进入高级启动选项. shutdown /r /o /f /t 00 第二种方法: 1. ...
- Vue中图片的加载方式
一.前言 VUE项目中图片的加载是必须的,那么vue中图片的加载方式有哪些呢,今天博主就抽点时间来为大家大概地捋一捋. 二.图片的加载方法 1.在本地加载图片(静态加载) 图片存放assets文件夹中 ...
- HarmonyOS USB DDK助你轻松实现USB驱动开发
HDF(Hardware Driver Foundation)驱动框架是HarmonyOS硬件生态开放的基础,为开发者提供了驱动加载.驱动服务管理和驱动消息机制等驱动能力,让开发者能精准且高效地开发驱 ...
- Oracle入门基础(七)一一集合运算
SQL> /* SQL> 查询10和20号部门的员工 SQL> 1. select * from emp where deptno=10 or deptno=20; SQL> ...
- java程序如何确保多线程的运行安全?
线程的安全问题体现在: 原子性:一个或多个操作在CPU执行过程中不被中断的特性 可见性:一个线程对共享变量的修改,另一个线程能立刻看到 有序性:程序执行的顺序按照代码的先后顺序执行 导致线程存在安全问 ...
- 判断集合中存在String字符串 或 判断集合中不存在String字符串
一.使用场景 用于集合中有多个相近的字符,无法使用包含判断 如: 这里如果我想判断以上集合中是否包含"信封件-DE"就会被"信封件-DE2"影响到 毕竟:&qu ...
- MySQL碎片整理小节--实例演示
MYSQL之磁盘碎片整理 清澈,细流涓涓的爱 数据库引擎以InnoDB为主 1.磁盘碎片是什么 InnoDB表的数据存储在页中,每个页可以存放多条记录,这些记录以树形结构组织,这棵树称为B+树. ...
- mysql学习 | LeetCode数据库简单查询练习
力扣:https://leetcode-cn.com/ 力扣网数据库练习:https://leetcode-cn.com/problemset/database/ 文章目录 175. 组合两个表 题解 ...