
VITAM POST MORTEM – ANALYZING DEADLOCKED SCHEDULERS MINI DUMP FROM SQL SERVER
https://gennadny.wordpress.com/2014/11/
Since SQL Server 7.0, SQL Server has its own scheduling mechanism, In SQL 7.0 and 2000 it was called UMS (User Mode Scheduling) and later was renamed to SOS (SQL OS Scheduler). UMS\SOS is non-preemptive\cooperative scheduler, which means it relying on threads to voluntarily five up control – or yield – to the next thread waiting in line vs. preemptively taking control from the threads.
- Preemptive scheduling: The preemptive scheduling is prioritized. The highest priority process should always be the process that is currently utilized.
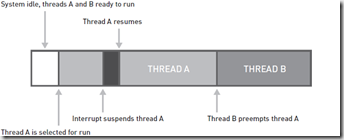
- Non-Preemptive scheduling: When a process enters the state of running, the state of that process is not deleted from the scheduler until it finishes its service time.
That means that there are locations in the SQL Server code where the Microsoft developer built in yield points, causing execution to “pause” and gracefully let another citizen in the SQL kingdom to exercise its right to execute. Of course, once a thread “leaves” SQL Server SOS kingdom, that thread is still handed off to the Windows preemptive scheduler. The goal of SOS is for SQL Server to expose only one thread at a time per CPU and thus minimize competition among SQL threads exposed to the OS. The ultimate goal is to reduce the very expensive kernel-mode context switching from one thread to another.
Since SQL Server uses a cooperative scheduler, it relies on the good heart of each developer who writes code in SQL Server to call a Yield() function of some kind that prevents the thread from monopolizing the CPU. That doesn’t always happen despite best intentions, moreover as there are calls to resources outside SQL Server (Disk IO best example) a SQL thread could be at the mercy of some external component. Because of that, the SOS scheduler has a dedicated thread -Scheduler Monitor – that periodically checks the state of each scheduler and reports any “irregularities”. Examples of irregularities include a thread not yielding voluntarily (a non-yielding scheduler) or all schedulers are “stuck” not processing any requests (deadlocked schedulers). Typically this Scheduler Monitor thread will report problems every 60 seconds, though it monitors the IOCP thread that accepts connections every 15 seconds. A very good white paper is actually written on SQL Server scheduling and can be found here – http://technet.microsoft.com/en-us/library/cc917684.aspx
So, deadlocked scheduler. A deadlocked scheduler scenario is reported when ALL SOS Schedulers are reported to be “stuck”. Technically, this means that since the last Scheduler Monitor check – say about 60 seconds earlier – nothing has changed and no work is being processed. Here is what is being checked by Scheduler Monitor:
- Are there any tasks waiting to be processed? (check if sys.dm_os_schedulers.work_queue_count > 0)
- Have any new worker threads been created since last check?
- Has any work been processed since last check (i.e. have any new tasks been assigned to workers)?
If any of these conditions is met (not all), the Scheduler Monitor declares that schedulers are stuck – deadlocked. This is also somewhat NUMA dependent – SQL Server can report Deadlocked Schedulers if all the SOS schedulers on a single NUMA node are stuck, even if other NUMA nodes are processing tasks just fine.
So away from theory to practice. As deadlocked scheduler condition is reported by Scheduler Monitor SQL Server usually generates a mini dump and entry in Error Log. Through the years I have received a fare amount of these dumps from customers for this condition, non-yielding scheduler, non-yielding IOCP listener, etc. Here are some pointers on how to look at these.
The dumps generated by SQL Server by default for such condition are usually minidumps. A minidump file does not contain as much information as a full crash dump file, but it contains enough information to perform basic debugging operations. We can open this dump in Windows Debugger and granted we setup symbols correctly do some analysis on this dump. I will not go here into Windbg, symbol path to MS public symbol server, and other basics. However you can read excellent tutorial here – http://www.codeproject.com/Articles/6084/Windows-Debuggers-Part-A-WinDbg-Tutorial and some resources here – http://msdn.microsoft.com/en-us/library/windows/desktop/ee416588(v=vs.85).aspx,http://blogs.msdn.com/b/ntdebugging/archive/2008/08/28/basics-of-debugging-windows.aspx (Huge fan of NtDebugging blog myself)
So now I have a minidump and wonderful message in SQL Server Error Log like this:
2014-02-07 09:18:14.54 Server      Using 'dbghelp.dll' version '4.0.5'

2014-02-07 09:18:14.55 Server      **Dump thread - spid = 0, EC = 0x0000000000000000

2014-02-07 09:18:14.55 Server      ***Stack Dump being sent to O:\MSSQL10_50.PRD_SQL_CLA_1\MSSQL\LOG\SQLDump0005.txt

2014-02-07 09:18:14.55 Server      * *******************************************************************************

2014-02-07 09:18:14.55 Server      *

2014-02-07 09:18:14.55 Server      * BEGIN STACK DUMP:

2014-02-07 09:18:14.55 Server      *   02/07/14 09:18:14 spid 11416

2014-02-07 09:18:14.55 Server      *

2014-02-07 09:18:14.55 Server      * Deadlocked Schedulers

2014-02-07 09:18:14.55 Server      *

2014-02-07 09:18:14.55 Server      * *******************************************************************************

2014-02-07 09:18:14.55 Server      * -------------------------------------------------------------------------------

2014-02-07 09:18:14.55 Server      * Short Stack Dump

2014-02-07 09:18:14.61 Server      Stack Signature for the dump is 0x00000000000002B4
Once we open the dump in Debugger lets look for patterns here. First lets take a look what we are working with here. Looks like we have 40 threads
0:004> ~*

   0  Id: 770.774 Suspend: 1 Teb: 7ffdd000 Unfrozen

      Start: sqlservr!wmainCRTStartup (024489f8)

      Priority: 0  Priority class: 32  Affinity: f

   1  Id: 770.cc Suspend: 1 Teb: 7ffda000 Unfrozen

      Start: msvcr80!_threadstartex (781329e1)

      Priority: 0  Priority class: 32  Affinity: f

   2  Id: 770.e0 Suspend: 1 Teb: 7ffd9000 Unfrozen

      Start: msvcr80!_threadstartex (781329e1)

      Priority: 0  Priority class: 32  Affinity: f

   3  Id: 770.e8 Suspend: 1 Teb: 7ffd8000 Unfrozen

      Start: msvcr80!_threadstartex (781329e1)

      Priority: 0  Priority class: 32  Affinity: f

.  4  Id: 770.f0 Suspend: 1 Teb: 7ffd7000 Unfrozen

      Start: msvcr80!_threadstartex (781329e1)

      Priority: 1  Priority class: 32  Affinity: f

   5  Id: 770.b8 Suspend: 1 Teb: 7ffd6000 Unfrozen

      Start: msvcr80!_threadstartex (781329e1)

      Priority: 0  Priority class: 32  Affinity: f

   6  Id: 770.108 Suspend: 1 Teb: 7ffd5000 Unfrozen

      Start: msvcr80!_threadstartex (781329e1)

      Priority: 0  Priority class: 32  Affinity: f

   7  Id: 770.104 Suspend: 1 Teb: 7ffd4000 Unfrozen

      Start: msvcr80!_threadstartex (781329e1)

      Priority: 0  Priority class: 32  Affinity: f

   8  Id: 770.144 Suspend: 1 Teb: 7ffaf000 Unfrozen

      Start: msvcr80!_threadstartex (781329e1)

      Priority: 0  Priority class: 32  Affinity: f

   9  Id: 770.140 Suspend: 1 Teb: 7ffae000 Unfrozen

      Start: msvcr80!_threadstartex (781329e1)

      Priority: 0  Priority class: 32  Affinity: f

  10  Id: 770.14c Suspend: 1 Teb: 7ffad000 Unfrozen

      Start: msvcr80!_threadstartex (781329e1)

      Priority: 0  Priority class: 32  Affinity: f

  11  Id: 770.c0 Suspend: 1 Teb: 7ffac000 Unfrozen

      Start: msvcr80!_threadstartex (781329e1)

      Priority: 0  Priority class: 32  Affinity: f

  12  Id: 770.264 Suspend: 1 Teb: 7ffab000 Unfrozen

      Start: msvcr80!_threadstartex (781329e1)

      Priority: 0  Priority class: 32  Affinity: f

  13  Id: 770.28c Suspend: 1 Teb: 7ffaa000 Unfrozen

      Start: msvcr80!_threadstartex (781329e1)

      Priority: 0  Priority class: 32  Affinity: f

  14  Id: 770.2a8 Suspend: 1 Teb: 7ffa9000 Unfrozen

      Start: msvcr80!_threadstartex (781329e1)

      Priority: 0  Priority class: 32  Affinity: f

  15  Id: 770.2bc Suspend: 1 Teb: 7ffa8000 Unfrozen

      Start: msvcr80!_threadstartex (781329e1)

      Priority: 0  Priority class: 32  Affinity: f

  16  Id: 770.1d4 Suspend: 1 Teb: 7ffa7000 Unfrozen

      Start: msvcr80!_threadstartex (781329e1)

      Priority: 0  Priority class: 32  Affinity: f

  17  Id: 770.8ec Suspend: 1 Teb: 7ffa5000 Unfrozen

      Start: msdtcprx!CConnectionManager::TimerProc (62a6ae8b)

      Priority: 0  Priority class: 32  Affinity: f

  18  Id: 770.8f0 Suspend: 1 Teb: 7ffa4000 Unfrozen

      Priority: 0  Priority class: 32  Affinity: f

  19  Id: 770.8f4 Suspend: 1 Teb: 7ffa3000 Unfrozen

      Start: msdtcprx!CSessionObject::MaintainSession (62ab1061)

      Priority: 0  Priority class: 32  Affinity: f

  20  Id: 770.900 Suspend: 1 Teb: 7ffa2000 Unfrozen

      Priority: 0  Priority class: 32  Affinity: f

  21  Id: 770.940 Suspend: 1 Teb: 7ffa1000 Unfrozen

      Start: msvcr80!_threadstartex (781329e1)

      Priority: 0  Priority class: 32  Affinity: f

  22  Id: 770.954 Suspend: 1 Teb: 7ff9f000 Unfrozen

      Start: msvcr80!_threadstartex (781329e1)

      Priority: 2  Priority class: 32  Affinity: f

  23  Id: 770.95c Suspend: 1 Teb: 7ff9d000 Unfrozen

      Start: msvcr80!_threadstartex (781329e1)

      Priority: 0  Priority class: 32  Affinity: f

  24  Id: 770.960 Suspend: 1 Teb: 7ff9c000 Unfrozen

      Start: msvcr80!_threadstartex (781329e1)

      Priority: 0  Priority class: 32  Affinity: f

  25  Id: 770.aa8 Suspend: 1 Teb: 7ff9b000 Unfrozen

      Start: msvcr80!_threadstartex (781329e1)

      Priority: 0  Priority class: 32  Affinity: f

  26  Id: 770.ad0 Suspend: 1 Teb: 7ff9a000 Unfrozen

      Start: msvcr80!_threadstartex (781329e1)

      Priority: 0  Priority class: 32  Affinity: f

  27  Id: 770.c80 Suspend: 1 Teb: 7ff91000 Unfrozen

      Start: netapi32!NetbiosWaiter (71c5110d)

      Priority: 0  Priority class: 32  Affinity: f

  28  Id: 770.e54 Suspend: 1 Teb: 7ff82000 Unfrozen

      Start: msvcr80!_threadstart (7813286e)

      Priority: 0  Priority class: 32  Affinity: f

  29  Id: 770.10cc Suspend: 1 Teb: 7ff81000 Unfrozen

      Start: 00070cbe

      Priority: 0  Priority class: 32  Affinity: f

  30  Id: 770.e2c Suspend: 1 Teb: 7ffa6000 Unfrozen

      Start: msvcr80!_threadstartex (781329e1)

      Priority: 0  Priority class: 32  Affinity: f

  31  Id: 770.360 Suspend: 1 Teb: 7ff92000 Unfrozen

      Start: msvcr80!_threadstartex (781329e1)

      Priority: 0  Priority class: 32  Affinity: f

  32  Id: 770.12b4 Suspend: 1 Teb: 7ff93000 Unfrozen

      Start: msvcr80!_threadstartex (781329e1)

      Priority: 0  Priority class: 32  Affinity: f

  33  Id: 770.2b8 Suspend: 1 Teb: 7ff83000 Unfrozen

      Start: msvcr80!_threadstartex (781329e1)

      Priority: 0  Priority class: 32  Affinity: f

  34  Id: 770.7a8 Suspend: 1 Teb: 7ffdb000 Unfrozen

      Start: msvcr80!_threadstartex (781329e1)

      Priority: 0  Priority class: 32  Affinity: f

  35  Id: 770.1cfc Suspend: 1 Teb: 7ff96000 Unfrozen

      Start: msvcr80!_threadstartex (781329e1)

      Priority: 0  Priority class: 32  Affinity: f

  36  Id: 770.1360 Suspend: 1 Teb: 7ff97000 Unfrozen

      Start: msvcr80!_threadstartex (781329e1)

      Priority: 0  Priority class: 32  Affinity: f

  37  Id: 770.ef0 Suspend: 1 Teb: 7ff94000 Unfrozen

      Start: msvcr80!_threadstartex (781329e1)

      Priority: 0  Priority class: 32  Affinity: f

  38  Id: 770.18c8 Suspend: 1 Teb: 7ff9e000 Unfrozen

      Start: msvcr80!_threadstartex (781329e1)

      Priority: 0  Priority class: 32  Affinity: f

  39  Id: 770.1c00 Suspend: 1 Teb: 7ff8e000 Unfrozen

      Start: msvcr80!_threadstartex (781329e1)

      Priority: 0  Priority class: 32  Affinity: f

  40  Id: 770.1dc0 Suspend: 1 Teb: 7ffa0000 Unfrozen

      Start: msvcr80!_threadstartex (781329e1)

      Priority: 0  Priority class: 32  Affinity: f
Next I will dump stacks on the threads and look for patterns here:
~*kL100
For sake of brevity I will not list my output here, but majority of my threads have following calls on the stacks, as this example with thread 40:
40  Id: 770.1dc0 Suspend: 1 Teb: 7ffa0000 Unfrozen

ChildEBP RetAddr

4dd6f460 7c827a19 ntdll!KiFastSystemCallRet

4dd6f464 77ea4a4c ntdll!NtSignalAndWaitForSingleObject+0xc

4dd6f4d8 01008721 kernel32!SignalObjectAndWait+0xaf

4dd6f4fc 01002166 sqlservr!SOS_Scheduler::Switch+0x81

4dd6f678 010028b2 sqlservr!SOS_Scheduler::SwitchContext+0x337

4dd6f694 01001b7a sqlservr!SOS_Scheduler::SuspendNonPreemptive+0xb5

4dd6f6ac 01002aea sqlservr!SOS_Scheduler::Suspend+0x2d

4dd6f6d0 012d58ce sqlservr!SOS_Event::Wait+0x14d

4dd6f708 012d7c34 sqlservr!SOS_Event::WaitAllowPrematureWakeup+0x71

4dd6f784 012d7fe9 sqlservr!XchngWait<31,10> >+0xfe

4dd6f7a8 012d7d3b sqlservr!CXPort::Open+0x13b

4dd6f7bc 012dff7a sqlservr!CQScanExchangeNew::Open+0x88

4dd6f7f4 012e0aaf sqlservr!CQScanHash::ConsumeBuild+0xca

4dd6f818 012e1246 sqlservr!CQScanHash::Iterate+0x43

4dd6f83c 012e2a15 sqlservr!CQScanHash::Open+0x6a

4dd6f85c 012e04fe sqlservr!CQScanHash::ConsumeProbe+0x128

4dd6f884 012e1246 sqlservr!CQScanHash::Iterate+0x54

4dd6f8a8 01025745 sqlservr!CQScanHash::Open+0x6a

4dd6f8bc 012d7d8f sqlservr!CQScanNew::OpenHelper+0x1f

4dd6f930 012d7e7d sqlservr!CQScanXProducerNew::Open+0x49

4dd6f950 012d7a17 sqlservr!FnProducerOpen+0x5b

4dd6fa10 012d754f sqlservr!FnProducerThread+0x381

4dd6fd4c 010069f3 sqlservr!SubprocEntrypoint+0x5cc

4dd6fdbc 01006b19 sqlservr!SOS_Task::Param::Execute+0xe2

4dd6fdf0 01006829 sqlservr!SOS_Scheduler::RunTask+0xb9

4dd6fe30 0145ca28 sqlservr!SOS_Scheduler::ProcessTasks+0x141

4dd6fe98 0145c948 sqlservr!SchedulerManager::WorkerEntryPoint+0x1ad

4dd6feb0 0145c610 sqlservr!SystemThread::RunWorker+0x7f

4dd6ff10 0145c7ad sqlservr!SystemThreadDispatcher::ProcessWorker+0x246

4dd6ff78 781329bb sqlservr!SchedulerManager::ThreadEntryPoint+0x143

4dd6ffb0 78132a47 msvcr80!_callthreadstartex+0x1b

4dd6ffb8 77e6482f msvcr80!_threadstartex+0x66
Note calls to sqlservr!CQScanXProducerNew::Open above. This or its related calls like sqlservr!FnProducerOpen, sqlservr!FnProducerThread, sqlservr!SubprocEntrypoint point to excessive parallelism waits in SQL Server (CXPACKET wait) as a culprit in my case.
There are other patterns that I could have seen in the dump as well that would have pointed out other issues that can cause Deadlocked Schedulers condition:
- Blocking. Usually majority of stacks on your threads would have LockOwner::Sleep() function and lck_lockInternal:
ntdll!ZwSignalAndWaitForSingleObject

kernel32!SignalObjectAndWait

sqlservr!SOS_Scheduler::SwitchContext

sqlservr!SOS_Scheduler::Suspend

sqlservr!SOS_Event::Wait

sqlservr!LockOwner::Sleep

sqlservr!lck_lockInternal

sqlservr!GetLock
- Buffer Pool Memory Issue or Lazy Writer IO waits – look for sqlservr!BPool::Steal calls
sqlservr!BPool::Steal

sqlservr!SQLSinglePageAllocator::AllocatePages

sqlservr!MemoryNode::AllocatePagesInternal

sqlservr!MemoryClerkInternal::AllocatePages

sqlservr!IMemObj::PbGetNewPages

sqlservr!CSlotPageMgr::PbAllocate
- Other reasons for the condition may include super slow disk IO, very liberal use of SQL Server Profiler to capture profiler traces, etc.
Check out very detailed article on Deadlock Scheduler Analysis on MSSQLWIKI –http://mssqlwiki.com/2010/06/15/how-to-analyze-deadlocked-schedulers-dumps/, Troubleshooting SQL blog –http://troubleshootingsql.com/2011/08/16/debugging-the-deadlock-but-for-the-scheduler-part-2-of-2/, as well ashttps://blog.basefarm.com/blog/sql-server-deadlocked-schedulers-leads-to-unexpected-cluster-failoverpart-1/
VITAM POST MORTEM – ANALYZING DEADLOCKED SCHEDULERS MINI DUMP FROM SQL SERVER的更多相关文章
- How can I create a dump of SQL Server?
https://blogs.msdn.microsoft.com/askjay/2009/12/29/basic-debugging-concepts-and-setup/ You can creat ...
- mini filter driver sql server
https://blogs.msdn.microsoft.com/sql_pfe_blog/2013/04/23/identifying-the-cause-of-sql-server-io-bott ...
- How to Analyze "Deadlocked Schedulers" Dumps?---WINDBG
https://blogs.msdn.microsoft.com/karthick_pk/2010/06/22/how-to-analyze-deadlocked-schedulers-dumps/ ...
- SQL Server 2008 中收缩数据库(DUMP,TRANSACTION,TRAN,无效,语法错误)
从SQL SERVER 2008 开始,我们已经不能再用以前 DUMP TRAN 数据库名 WITH NO_LOG 的这种方式来收缩数据库,但是,可以用另外一种替代的方法,SQL语句如下: ALTER ...
- 数据库备份出现警告:Warning: Using a password on the command line interface can be insecure. Warning: A partial dump from a server that has GTIDs will by default include the GTIDs of all transactions, even thos
1.先来看原备份数据库语句: mysqldump -h 127.0.0.1 -uroot -ppassword database > /usr/microStorage/dbbackup/cap ...
- mysqldump 备份某张表 Warning: A partial dump from a server that has GTIDs will by default include the GTIDs of all transactions,
[root@NB ok]# mysqldump -uemove -h xx.xx.xx.xx -P9906 DBname t_name -p >2t_tname.sqlWarning: A pa ...
- Opera mini for S60 custom server
Opera mini for S60 custom server 在线改服 http://yourshell.info/mo/mini/ 本人贫穷一族,一直在用S60V2,这种手机启动JAVA很占内存 ...
- How do I find what queries were executing in a SQL memory dump?-----stack
https://blogs.msdn.microsoft.com/askjay/2010/10/03/how-do-i-find-what-queries-were-executing-in-a-s ...
- Server-side Query interception with MS SQL Server
up vote15down votefavorite 5 I'm researching into intercepting queries that arrive at the SQL Serv ...
随机推荐
- Django2.0如何配置urls文件
刚开始学django,创建的第一个工程无法启动,后来发现是由于教程是针对较低版本的Django,我用的是Django2.0和Python3.6,两个都是发文为止的最新版本,urls文件设置方法和旧版本 ...
- win10安装提示“我们无法创建新的分区”
今日于笔记本安装win10时突然出现提示:我们无法创建新的分区.网上搜了不少建议,尝试了都无果. 由于我的笔记本是固态硬盘与机械硬盘混合,所以情况可能更加特殊. 最后成功的方法是: 1. 先将Win1 ...
- 过渡&动画
进入/离开&列表过渡 概述 Vue在插入,更新或者移除Dom时,提供多种不同方式的应用过渡效果.包括以下工具 在css过渡和动画中自动应用class 可以配合使用第三方css动画库,如Anim ...
- aspxpivotgrid 导出excel时,非绑定咧显示为0的情况
using DevExpress.XtraPrinting; Exporter.ExportXlsToResponse(this.Title,TextExportMode.Text,true); // ...
- JavaScript中常用的BOM属性
window 窗口 window.open():打开窗口.返回一个指向新窗口的引用. window.close():关闭窗口. window.resizeTo():调整窗口尺寸到指定值 window. ...
- P2885
2885 code[class*="language-"] { padding: .1em; border-radius: .3em; white-space: normal; b ...
- HUD-5379
Mahjong tree Time Limit: 6000/3000 MS (Java/Others) Memory Limit: 65536/65536 K (Java/Others)Tota ...
- Fel表达式使用过程中需要注意的问题
精度问题: 我们知道java中直接使用float和double参与的计算都可能会产生精度问题,比如0.1+0.3.1.0-0.9 等.所以一般财务系统,都会使用BigDecimal进行加减乘除. 在调 ...
- SEO优化:WordPress发布文章主动推送到百度,加快收录保护原创
工作实在太忙,也没时间打理网站.最近公司额外交待了一些网站 SEO 方面的优化任务让我关注(这就是啥都要会.啥都要做的苦逼运维的真实写照了...). 于是抽空看了下百度站长平台,至少看到了2个新消息: ...
- 自动选择profile
cobbler system list cobbler profile list 方式一:自动选择profile cobbler system add --name="linux-node1 ...