TChart-图表编辑器的测试
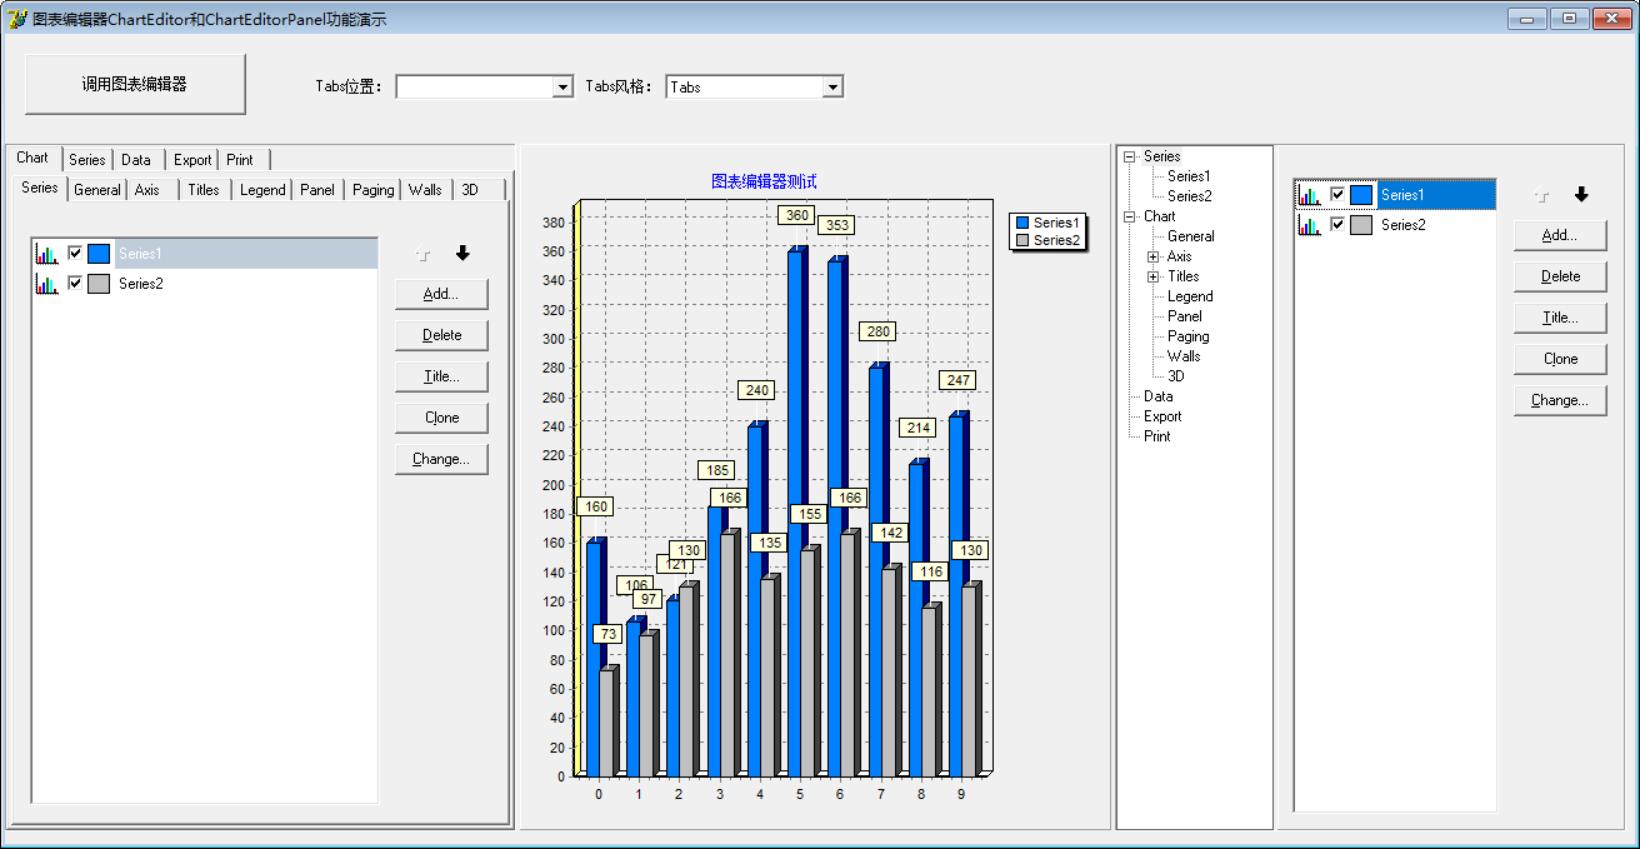
最近不知怎么的,想研究一下图表。先上效果图:
功能代码:
unit Unit1;

interface

uses

  Windows, Messages, SysUtils, Variants, Classes, Graphics, Controls, Forms,

  Dialogs, TeeEdit, ExtCtrls, TeeProcs, TeEngine, Series, Chart, StdCtrls,

  ComCtrls;

type

  TForm1 = class(TForm)

    ChartEditorPanel1: TChartEditorPanel;

    ChartEditor1: TChartEditor;

    ChartEditorPanel2: TChartEditorPanel;

    Chart1: TChart;

    Series1: TBarSeries;

    Series2: TBarSeries;

    Button1: TButton;

    ComboBox1: TComboBox;

    Label1: TLabel;

    ComboBox2: TComboBox;

    Label2: TLabel;

    procedure FormCreate(Sender: TObject);

    procedure Button1Click(Sender: TObject);

    procedure ComboBox1Change(Sender: TObject);

    procedure ComboBox2Change(Sender: TObject);

    procedure Chart1ClickAxis(Sender: TCustomChart; Axis: TChartAxis;

      Button: TMouseButton; Shift: TShiftState; X, Y: Integer);

    procedure Chart1ClickLegend(Sender: TCustomChart; Button: TMouseButton;

      Shift: TShiftState; X, Y: Integer);

  private

    { Private declarations }

  public

    { Public declarations }

  end;

var

  Form1: TForm1;

implementation

{$R *.dfm}

procedure TForm1.FormCreate(Sender: TObject);

begin

  Self.Position := poScreenCenter;

  //右下角图表编辑器树形显示

  ChartEditorPanel2.Editor.Tree.Visible := True;

  //随机添加10个数

  Series1.FillSampleValues();

  Series2.FillSampleValues();

end;

procedure TForm1.Button1Click(Sender: TObject);

begin

  ChartEditor1.Execute;

end;

procedure TForm1.ComboBox1Change(Sender: TObject);

var

  Pos: TTabPosition;

begin

  Pos := tpTop;

  case ComboBox1.ItemIndex of

    : Pos := tpTop;

    : Pos := tpBottom;

    : Pos := tpLeft;

    : Pos := tpRight;

  end;

  ChartEditorPanel1.Editor.TabGeneral.PageControl.TabPosition := Pos;

end;

procedure TForm1.ComboBox2Change(Sender: TObject);

var

  ts: TTabStyle;

begin

  ts := tsTabs;

  case ComboBox2.ItemIndex of

    : ts := tsTabs;

    : ts := tsButtons;

    : ts := tsFlatButtons;

  end;

  ChartEditorPanel1.Editor.TabGeneral.PageControl.Style := ts;

end;

procedure TForm1.Chart1ClickAxis(Sender: TCustomChart; Axis: TChartAxis;

  Button: TMouseButton; Shift: TShiftState; X, Y: Integer);

begin

  ChartEditorPanel1.Editor.TabAxis.Show;

  ChartEditorPanel1.Editor.TabAxis.PageControl.ActivePage.PageIndex;

end;

procedure TForm1.Chart1ClickLegend(Sender: TCustomChart;

  Button: TMouseButton; Shift: TShiftState; X, Y: Integer);

begin

  ChartEditorPanel1.Editor.TabLegend.Show;

end;

end.
界面代码:
object Form1: TForm1

  Left =

  Top =

  Width =

  Height =

  Caption = '图表编辑器ChartEditor和ChartEditorPanel功能演示'

  Color = clBtnFace

  Font.Charset = DEFAULT_CHARSET

  Font.Color = clWindowText

  Font.Height = -

  Font.Name = 'MS Sans Serif'

  Font.Style = []

  OldCreateOrder = False

  OnCreate = FormCreate

  PixelsPerInch =

  TextHeight =

  object Label1: TLabel

    Left =

    Top =

    Width =

    Height =

    Caption = 'Tabs位置:'

  end

  object Label2: TLabel

    Left =

    Top =

    Width =

    Height =

    Caption = 'Tabs风格:'

  end

  object ChartEditorPanel1: TChartEditorPanel

    Left =

    Top =

    Width =

    Height =

    Chart = Chart1

    TabOrder =

  end

  object ChartEditorPanel2: TChartEditorPanel

    Left =

    Top =

    Width =

    Height =

    Chart = Chart1

    TabOrder =

  end

  object Chart1: TChart

    Left =

    Top =

    Width =

    Height =

    Title.Text.Strings = (

      '图表编辑器测试')

    OnClickAxis = Chart1ClickAxis

    OnClickLegend = Chart1ClickLegend

    TabOrder =

    object Series1: TBarSeries

      Marks.Callout.Brush.Color = clBlack

      Marks.Visible = True

      SeriesColor =

      Gradient.Direction = gdTopBottom

      XValues.Name = 'X'

      XValues.Order = loAscending

      YValues.Name = 'Bar'

      YValues.Order = loNone

    end

    object Series2: TBarSeries

      Marks.Callout.Brush.Color = clBlack

      Marks.Visible = True

      SeriesColor = clSilver

      Gradient.Direction = gdTopBottom

      XValues.Name = 'X'

      XValues.Order = loAscending

      YValues.Name = 'Bar'

      YValues.Order = loNone

    end

  end

  object Button1: TButton

    Left =

    Top =

    Width =

    Height =

    Caption = '调用图表编辑器'

    TabOrder =

    OnClick = Button1Click

  end

  object ComboBox1: TComboBox

    Left =

    Top =

    Width =

    Height =

    Style = csDropDownList

    ItemHeight =

    TabOrder =

    OnChange = ComboBox1Change

    Items.Strings = (

      'Top'

      'Bottom'

      'Left'

      'Right')

  end

  object ComboBox2: TComboBox

    Left =

    Top =

    Width =

    Height =

    Style = csDropDownList

    ItemHeight =

    ItemIndex =

    TabOrder =

    Text = 'Tabs'

    OnChange = ComboBox2Change

    Items.Strings = (

      'Tabs'

      'Buttons'

      'FlatButtons')

  end

  object ChartEditor1: TChartEditor

    Chart = Chart1

    Left =

    Top =

  end

end
TChart-图表编辑器的测试的更多相关文章
- Cocos2d-x中常用粒子编辑器ParticleDesigner测试例子
打开 ParticleDesigner 随意选择一种效果 选择save. 类型选择 cocosd(plist)类型保存至桌面 命名为myplist导出至桌面 选择右侧Emitter Config可设置 ...
- [译]如何在Unity编辑器中添加你自己的工具
在这篇教程中你会学习如何扩展你的Unity3D编辑器,以便在你的项目中更好的使用它.你将会学习如何绘制你自己的gizmo,用代码来实现创建和删除物体,创建编辑器窗口,使用组件,并且允许用户撤销他们所作 ...
- android测试分析1
Android测试框架,开发环境中集成的一部分,提供一个架构和强有力的工具 可以帮助测试你的应用从单元到框架的每个方面. 测试框架有这些主要特征: 1.Android测试组件基于Junit.你可以使用 ...
- iozone测试磁盘性能
什么是iozone? iozone是一个文件系统的benchmark工具,可以测试不同的操作系统中文件系统的读写性能. 可以测试 Read, write, re-read,re-write, read ...
- Unity StreamingMipmaps 简单测试
StreamingMipmaps是Unity2018.2中加入的新功能,意指通过CPU控制,只加载部分Mipmap图片以节省更多的内存及显存空间. 我测试时遇到了问题,后来发现必须打包出来测才有效(注 ...
- [开发笔记]-Jqplot图表初体验
文章内容为初次使用Jqplot图表插件的测试代码,仅供参考. <html xmlns="http://www.w3.org/1999/xhtml"> <head& ...
- 使用iozone测试磁盘性能
IOzone是一个文件系统测试基准工具.可以测试不同的操作系统中文件系统的读写性能.可以通过 write, re-write, read, re-read, random read, random w ...
- FastReport.Net使用:[23]图表(Chart)控件
图表基本设置 1.拖放一个图表控件到报表设计界面中. 2.右键菜单“编辑”或者双击图表进入图表编辑器 3.将原有的簇状柱状图删除,添加圆环图 4.绑定数据源,并且指定X,Y轴数据. X轴数据为科目名称 ...
- 使用iozone测试磁盘性能(测试文件读写)
IOzone是一个文件系统测试基准工具.可以测试不同的操作系统中文件系统的读写性能.可以通过 write, re-write, read, re-read, random read, random w ...
随机推荐
- error C2662
原因:关于const的问题 具体错误:函数的参数列表中参数签名为const,但是却调用了该参数的非const的成员函数 例子: 即使我们知道NoConst()并不会改变类的data成员,编译器依旧会报 ...
- postman之存储测试结果
前言 在Jmeter的随笔中,我跟大家讲过利用Jmeter工具存储测试结果,那么,postman工具要该如何存储测试结果呢?下面一起来学习吧! 一:添加一个登录请求,填入接口参数点击send 二:点击 ...
- abp(net core)+easyui+efcore实现仓储管理系统——入库管理之一(三十七)
abp(net core)+easyui+efcore实现仓储管理系统目录 abp(net core)+easyui+efcore实现仓储管理系统——ABP总体介绍(一) abp(net core)+ ...
- 浅谈无线局域网WLAN
无线局域网WLAN 一.概述 有线局域网的组成如下图所示,多台计算机通过双绞线连接到一个集线器(hub)或交换机(switch)上,组成一个有限局域网. 无线局域网的组成如下图所示,多台计算机通过无线 ...
- SpringBoot图文教程5—SpringBoot 中使用Aop
有天上飞的概念,就要有落地的实现 概念+代码实现是本文的特点,教程将涵盖完整的图文教程,代码案例 文章结尾配套自测面试题,学完技术自我测试更扎实 概念十遍不如代码一遍,朋友,希望你把文中所有的代码案例 ...
- 卫星轨道相关笔记SGP4
由卫星历书确定卫星轨道状态向量 卫星历书的表示方法有2种: TLE(Two Line Element),和轨道根数表示方法 由卫星历书计算出卫星轨道状态向量的方法有2种: SGP方法,NORAD的方法 ...
- tomcat 日志
1.Tomcat的日志(./tomca/logs/) 分为5类,这里面 1和5比较重要 .catalina.--.log 或者 catalina.out: 引擎的日志文件 .host-manager. ...
- Zookeeper 介绍 原理
简介: ZooKeeper是一个分布式的,开放源码的分布式应用程序协调服务. 它Google的Chubby一个开源的实现,在分布式协调技术方面做得比较好的就是Google的Chubby还有 ...
- light oj 1214 - Large Division 大数除法
1214 - Large Division Given two integers, a and b, you should check whether a is divisible by b or n ...
- centos输入正确密码后依旧无法登陆问题
输入正确用户名和密码时依旧无法登录. 进入单用户模式重置密码: 开机启动时,按‘E’键(倒计时结束前)进入界面 选择第二项,按‘E’键再次进入 在最后一行添加‘ 1’(空格 1) 回车键保存,回到该界 ...