
[Python] Python 学习 - 可视化数据操作(一)
Python 学习 - 可视化数据操作(一)
GitHub:https://github.com/liqingwen2015/my_data_view
目录
- 折线图
- 散点图
- 随机漫步
- 骰子点数概率
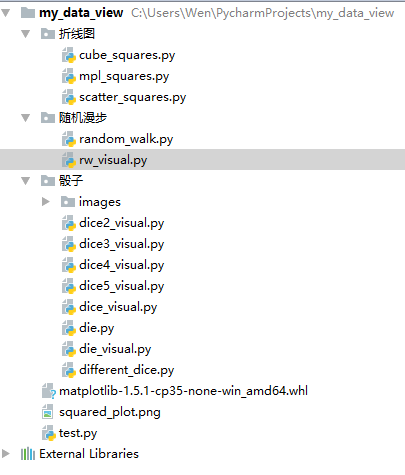
- 文件目录
折线图
cube_squares.py
import matplotlib.pyplot as plt

x_values=list(range(1, 5000))

y_values=[pow(x, 3) for x in x_values]

plt.scatter(x_values, y_values, c=y_values, cmap=plt.cm.Blues, edgecolor='none', s=40)

# 设置标题和样式

plt.title("Square Numbers", fontsize=24)

plt.xlabel("Value", fontsize=14)

plt.ylabel("Square of Value", fontsize=14)

# 设置刻度标记的大小

plt.tick_params(axis='both', which='major', labelsize=14)

plt.show()

mpl_squares.py
# 简单的折线图
import matplotlib.pyplot as plt

input_values=[1, 2, 3, 4, 5 ]

squares = [1, 4, 9, 16, 25]

# 绘制线条的粗细

plt.plot(input_values, squares, linewidth=5)

# 设置图表标题,并给坐标轴加上标签

plt.title("Square Numbers", fontsize=24)

plt.xlabel("Value", fontsize=14)

plt.ylabel("Square of Value", fontsize=14)

# 设置刻度标记的大小,axis='both' 表示指定的实参影响 x 轴和 y 轴上的刻度

plt.tick_params(axis='both', labelsize=14)

plt.show()

散点图
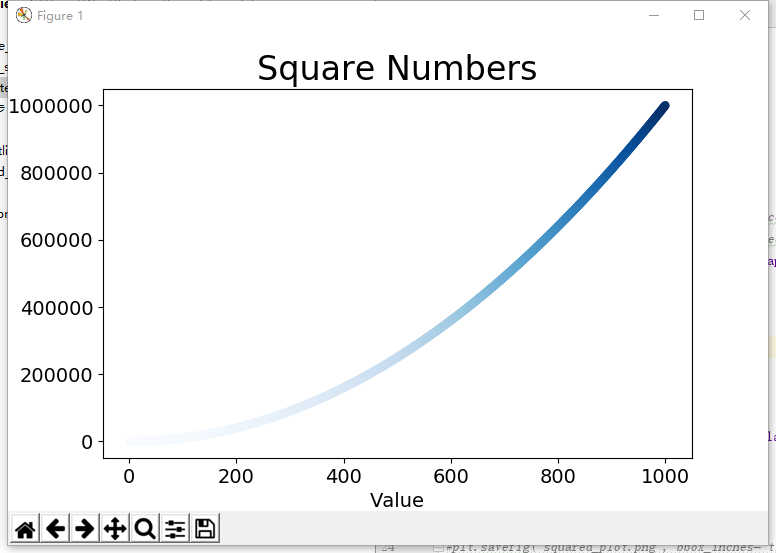
scatter_squares.py
# 散点图

import matplotlib.pyplot as plt

x_values = list(range(1, 1001))

y_values = [x**2 for x in x_values]

# c:颜色

#plt.scatter(x_values, y_values, c='red', edgecolor='none', s=40)

#plt.scatter(x_values, y_values, c=(0, 0, 8), edgecolor='none', s=40)

plt.scatter(x_values, y_values, c=y_values, cmap=plt.cm.Blues, edgecolor='none', s=40)

# 设置标题和样式

plt.title("Square Numbers", fontsize=24)

plt.xlabel("Value", fontsize=14)

plt.ylabel("Square of Value", fontsize=14)

# 设置刻度标记的大小

plt.tick_params(axis='both', which='major', labelsize=14)

plt.show()

# 保存图表

#plt.savefig('squared_plot.png', bbox_inches='tight')
随机漫步
random_walk.py
from random import choice

class RandomWalk():

    def __init__(self, num_points=5000):

        # 初始化随机漫步的属性

        self.num_points = num_points

        # 所有随机漫步都始于(0, 0)

        self.x_values = [0]

        self.y_values = [0]

    def fill_walk(self):

        # 不断漫步,直到列表达到指定的长度

        while len(self.x_values) < self.num_points:

            x_step = self.get_step();

            y_step = self.get_step();

            # 拒绝原地踏步

            if x_step == 0 and y_step == 0:

                continue

            # 计算下一个点的 x 和 y 值

            next_x = self.x_values[-1] + x_step

            next_y = self.y_values[-1] + y_step

            self.x_values.append(next_x)

            self.y_values.append(next_y)

    def get_step(self):

        # 决定前进方向以及沿这个方向前进的距离

        direction = choice([1, -1])  # 随机选 1 或 -1

        distance = choice([0, 1, 2, 3, 4])  # 随机选 0, 1, 2, 3, 4

        return direction * distance  # 正数:右移,负数:左移
rw_visual.py
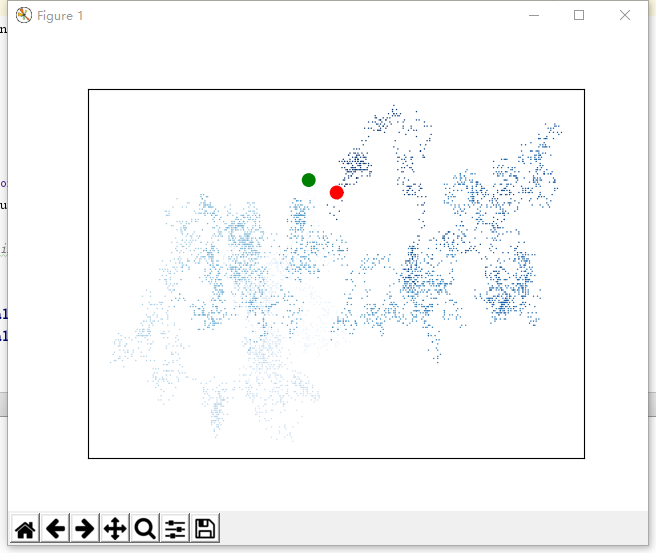
import matplotlib.pyplot as plt

from 随机漫步.random_walk import RandomWalk

while True:

    # 创建一个 RandomWalk 实例,并将其包含的点都绘制出来

    rw = RandomWalk(5000)

    rw.fill_walk()

    point_numbers = list(range(rw.num_points))

    plt.scatter(rw.x_values, rw.y_values, c=point_numbers, cmap=plt.cm.Blues, edgecolors='none', s=1)

    # 设置绘图窗口的尺寸

    #plt.figure(dpi=128, figsize=(10, 6))

    # 突出起点和终点

    plt.scatter(0, 0, c='green', edgecolors='none', s=100)

    plt.scatter(rw.x_values[-1], rw.y_values[-1], c='red', edgecolors='none', s=100)

    #plt.plot(rw.x_values, rw.y_values, linewidth=10)

    # 隐藏坐标轴

    plt.axes().get_xaxis().set_visible(False)

    plt.axes().get_yaxis().set_visible(False)

    plt.show()

    keep_running = input("继续?(y/n):")

    if keep_running == 'n':

        break
骰子点数概率
die.py
from random import randint

class Die():

    # 表示一个骰子类

    def __init__(self, num_sides=6):

        # 6 面

        self.num_sides = num_sides

    def roll(self):

        # 返回 1~6

        return randint(1, self.num_sides)
die_visual.py
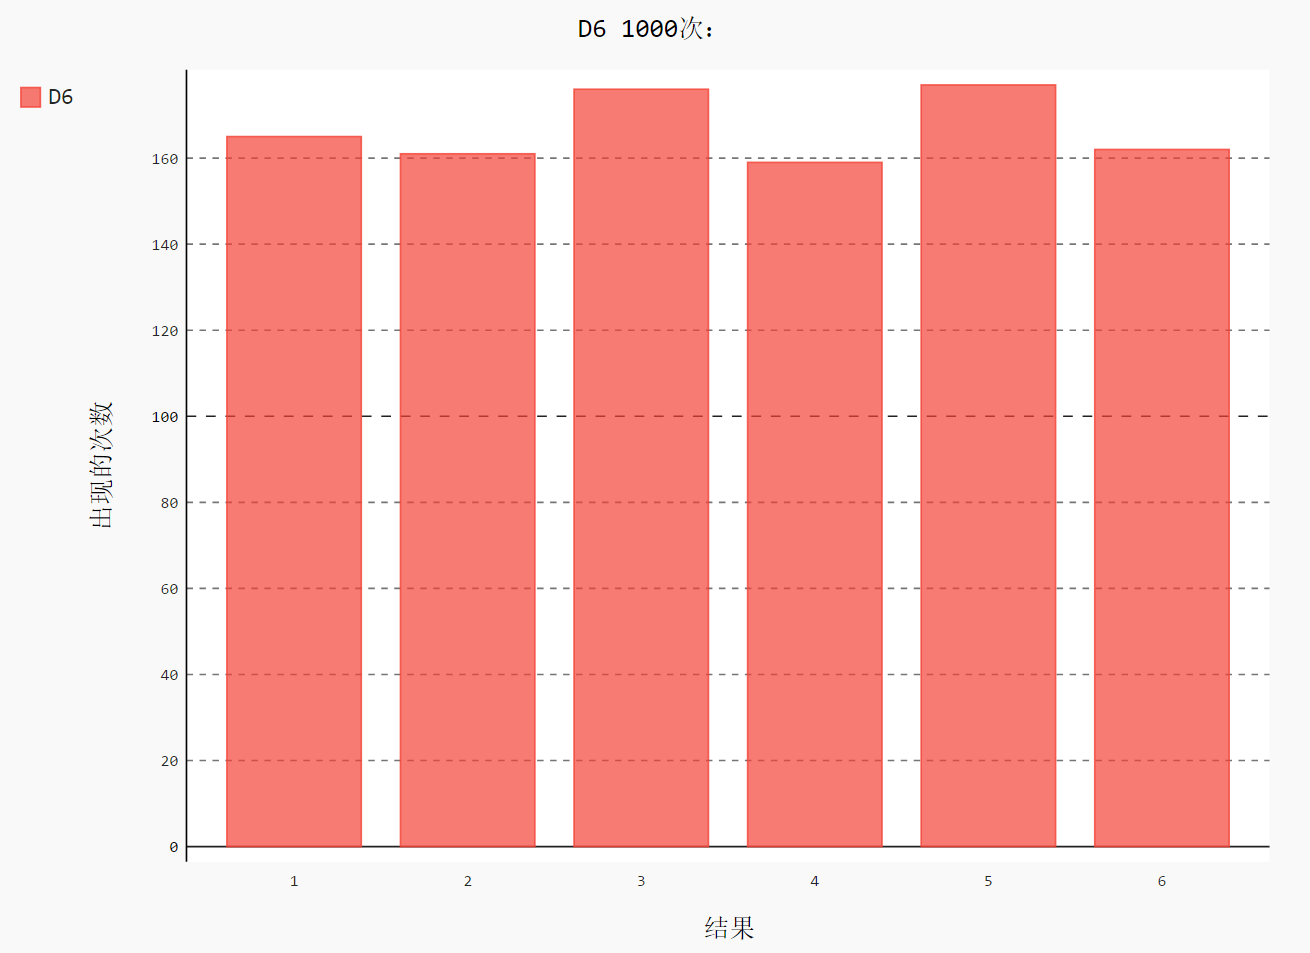
import pygal

from 骰子.die import Die

# 创建一个 D6

die = Die()

results = []

for roll_num in range(1000):

    result = die.roll()

    results.append(result)

frequencies = []

for value in range(1, die.num_sides+1):

    # 计算某个值出现同样的次数

    frequency = results.count(value)

    frequencies.append(frequency)

# 对结果进行可视化

hist = pygal.Bar()

hist.title = "D6 1000次:"

hist.x_labels = [str(num) for num in range(1, 7)] #['1', '2', '3', '4', '5', '6']

hist.x_title = "结果"

hist.y_title = "概率"

hist.add('D6', frequencies)

hist.render_to_file('images/die_visual.svg')
dice_visual.py
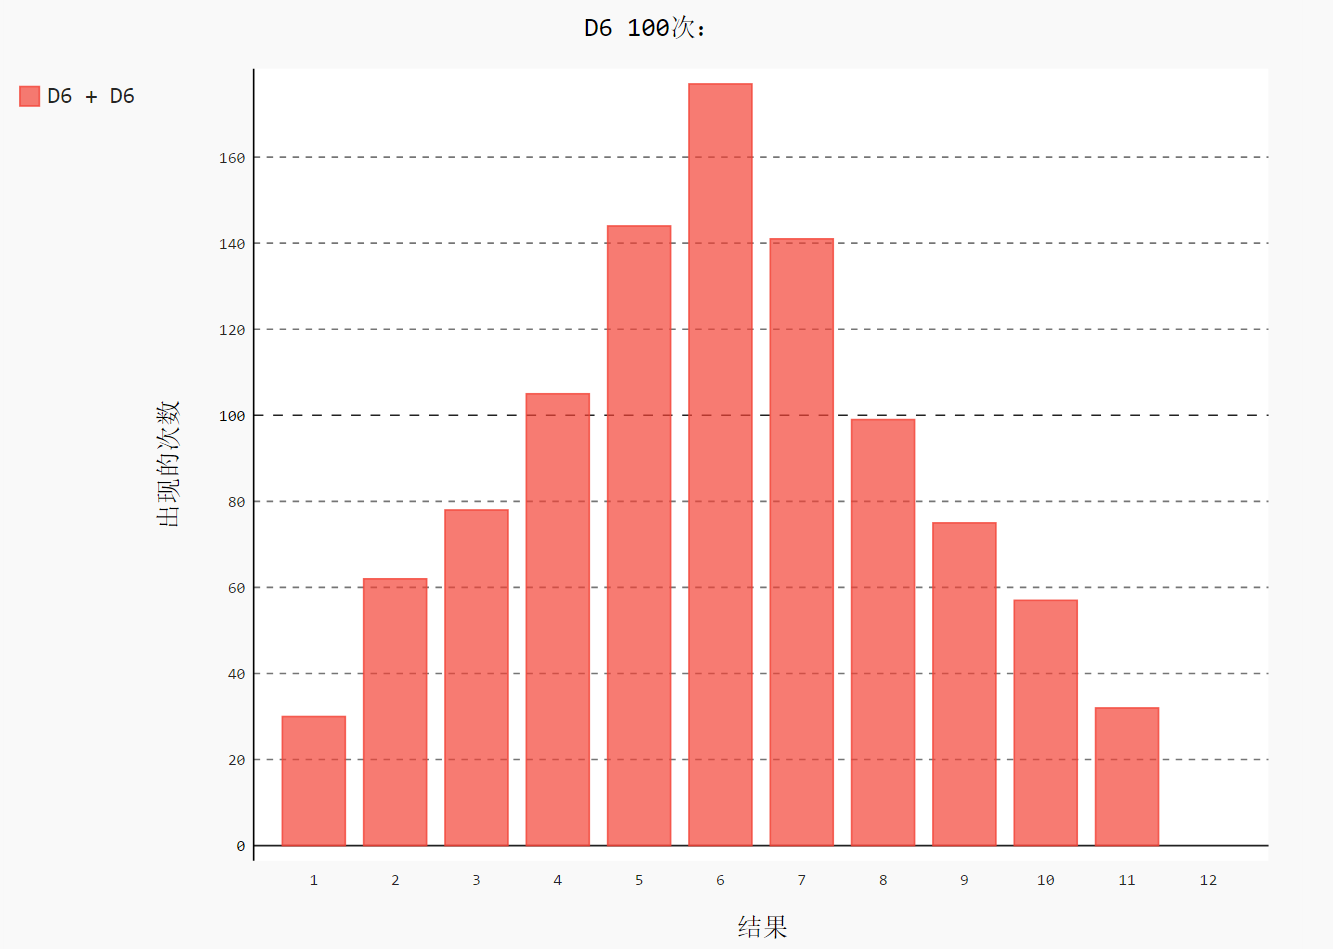
import pygal

from 骰子.die import Die

# 创建 2 个 D6

die_1 = Die()

die_2 = Die()

results = []

for roll_num in range(1000):

    result = die_1.roll() + die_2.roll()

    results.append(result)

frequencies = []

max_results = die_1.num_sides + die_2.num_sides

for value in range(2, max_results+1):

    # 计算某个值出现同样的次数

    frequency = results.count(value)

    frequencies.append(frequency)

# 对结果进行可视化

hist = pygal.Bar()

hist.title = "D6 100次:"

hist.x_labels = [str(num) for num in range(1, 13)] #['1', '2', '3', '4', '5', '6', '7', '8', '9', '10', '11', '12']

hist.x_title = "结果"

hist.y_title = "出现的次数"

hist.add('D6 + D6', frequencies)

hist.render_to_file('images/dice_visual.svg')
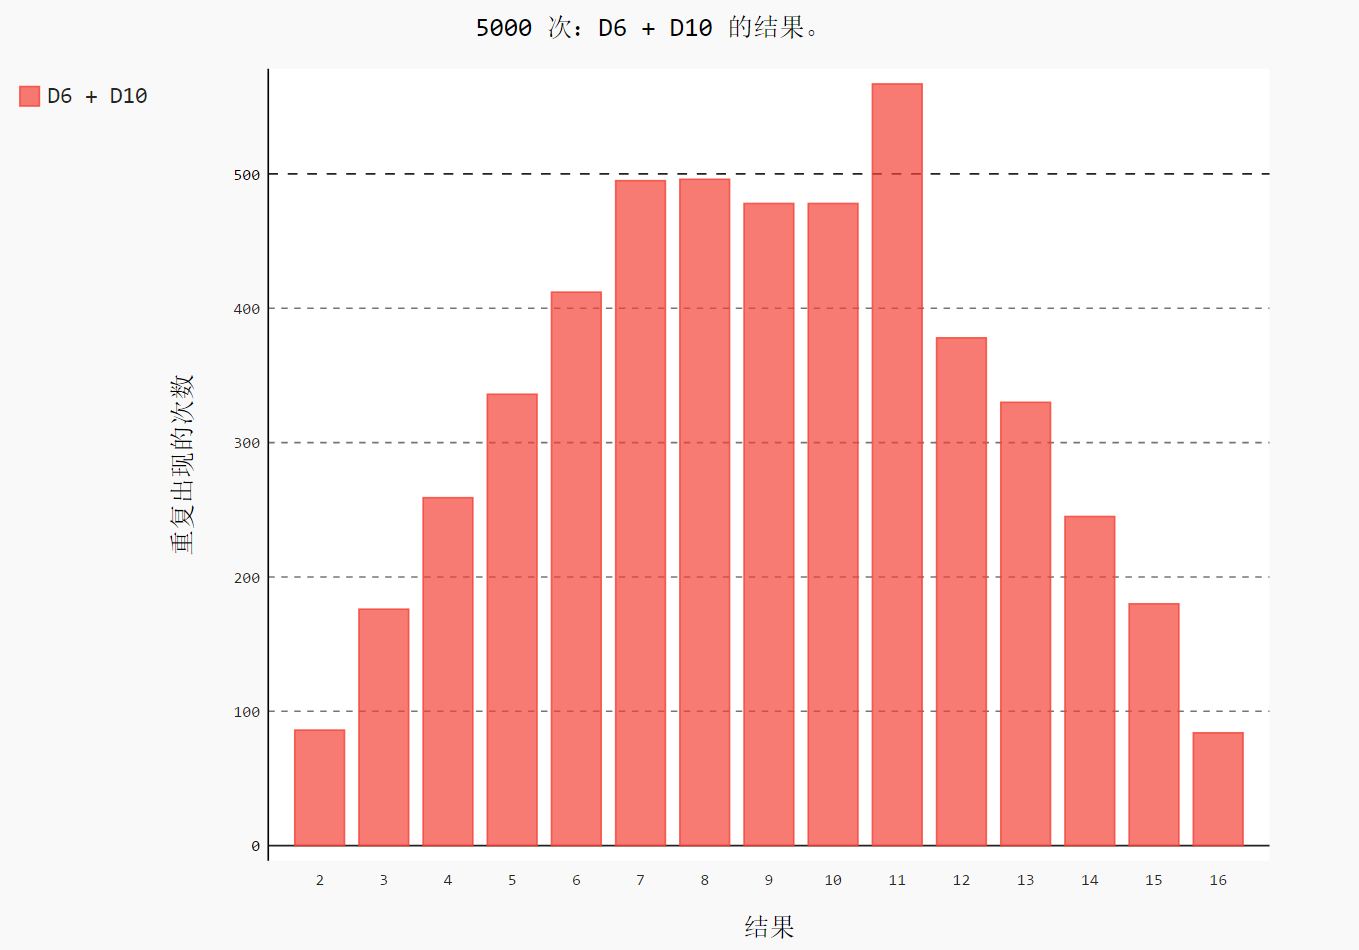
different_dice.py
import pygal

from 骰子.die import Die

# 创建一个 D6 和 D10

die_1 = Die()

die_2 = Die(10)

results = []

for roll_num in range(5000):

    result = die_1.roll() + die_2.roll()

    results.append(result)

frequencies = []

max_results = die_1.num_sides + die_2.num_sides

for value in range(2, max_results+1):

    # 计算某个值出现同样的次数

    frequency = results.count(value)

    frequencies.append(frequency)

# 对结果进行可视化

hist = pygal.Bar()

hist.title = "5000 次:D6 + D10 的结果。"

hist.x_labels = [str(num) for num in range(2, 17)]

hist.x_title = "结果"

hist.y_title = "重复出现的次数"

hist.add('D6 + D10', frequencies)

hist.render_to_file('images/different_visual.svg')
文件目录
GitHub:https://github.com/liqingwen2015/my_data_view
[Python] Python 学习 - 可视化数据操作(一)的更多相关文章
- python入门学习:3.操作列表
python入门学习:3.操作列表 关键点:列表 3.1 遍历整个列表3.2 创建数值列表3.3 使用列表3.4 元组 3.1 遍历整个列表 循环这种概念很重要,因为它是计算机自动完成重复工作的常 ...
- Python进阶学习_连接操作Redis数据库
安装导入第三方模块Redis pip3 install redis import redis 操作String类型 """ redis 基本命令 String set(n ...
- linux学习之——数据操作:添加与查询
说明: 在linux系统中,利用搭建的服务器,编写两个页面,一个添加信息,一个展现信息: 主要涉及到:php+mysql的操作: 数据添加页面: <html> <head> & ...
- python基础学习之文件操作&函数
1.文件处理相关 1.编码问题 ①python2与python3中的默认编码: py2默认使用ASCII码,py3默认使用utf-8 ②为什么会出现中文乱码,中文乱码的情况有哪些? #sys.stdo ...
- Python基础学习七 Excel操作
python操作excel,python操作excel使用xlrd.xlwt和xlutils模块, xlrd模块是读取excel的,xlwt模块是写excel的,xlutils是用来修改excel的. ...
- python基础学习笔记——文件操作
文件操作 初始文件操作 使用Python来读写文件是非常简单的操作,我们使用open()函数来打开一个文件,获取到文件句柄,然后通过文件句柄就可以进行各种各样的操作了 根据打开方式的不同能够执行的操作 ...
- python自动化测试学习笔记-6excel操作xlwt、xlrd、xlutils模块
python中通过xlwt.xlrd和xlutils操作xls xlwt模块用于在内存中生成一个xls/xlsx对象,增加表格数据,并把内存中的xls对象保存为本地磁盘xls文件; xlrd模块用于把 ...
- [python][django学习篇][6]操作数据库
查询(取)数据 >>> Category.objects.all() <QuerySet [<Category: Category object>]> > ...
- 莫烦python教程学习笔记——数据预处理之normalization
# View more python learning tutorial on my Youtube and Youku channel!!! # Youtube video tutorial: ht ...
随机推荐
- 使用Jacksum对文件夹和文件生成checksum
Jacksum 是一个java开源工具, 用来 给单个文件生成checksum, 也可以给整个文件中所有文件生成checksum,生产的checksum 可以是MD系列,也可sha. 你可以参考 官 ...
- extremecomponents
具体教程: http://www.cnblogs.com/QQParadise/articles/1488920.html 教程中涉及到springmvc的相关知识 下载地址:http://sourc ...
- Python基础之函数参数
一.实参 1.实参分类: 2.实参基础代码: def fun01(a, b, c): print(a) print(b) print(c) # 位置传参:实参与形参的位置依次对应 fun01(1, 2 ...
- Lesson 25 Do the English speak English?
Text I arrived London at last. The railway station was big, black and dark. I did not know the way t ...
- 2018,你与 i 春秋的故事都在这
年终岁末,深思回顾,过去的一年我们共同创造了很多回忆,有欢乐,有感动,更有收获.回首2018年,伴随着激情与挑战,我们共创了很多佳绩,一起来看看吧. 课程&实验 2018新增原创录制实战视频课 ...
- [Swift]LeetCode233. 数字1的个数 | Number of Digit One
Given an integer n, count the total number of digit 1 appearing in all non-negative integers less th ...
- [Swift]LeetCode280. 摆动排序 $ Wiggle Sort
Given an unsorted array nums, reorder it in-place such that nums[0] <= nums[1] >= nums[2] < ...
- iOS学习——核心动画之Layer基础
iOS学习——核心动画之Layer基础 1.CALayer是什么? CALayer我们又称它叫做层.在每个UIView内部都有一个layer这样一个属性,UIView之所以能够显示,就是因为它里面有这 ...
- 前端打包成桌面应用、以及chrome扩展
前段时间在利用工作之余开发了tomato timer这个蕃茄钟,然后部署到github.io上,由于greatway太厉害,偶尔会有打不开的情况.上周末对比做了扩展和改进,使其成为chrome的插件, ...
- 对vue源码的初步认识和理解
根据vue的官网介绍,可以得知vue是一个mvvm框架,且是响应式的.为了更深入了理解其内涵,本人以及理解实现了一个简单的mvvm学习的demo.下面分享给大家,欢迎大家一起讨论. 一.mvvm至少包 ...