promethus监控nginx
一、摘要
promethues监控nginx可选两个exporter,通过nginx_exporter主要是获取nginx-status中的内建的指标,nginx自身提供status信息,较为简单,promethues中对应的metrics也较少,想要监控更多的指标可以通过nginx-vts-exporter采集信息,依赖在编译nginx的时候添加nginx-module-vts模块来实现。
nginx virtual host traffic status模块是nginx第三方模块之一,vts提供了访问虚拟主机状态的信息,包含server,upstream以及cache的当前状态,类似于NGINX Plus 提供的在线活动监控功能。
二、Nginx_exporter安装
下载链接:
https://github.com/discordianfish/nginx_exporter
nginx_exporter.go,需要使用go语言环境将源码编译成二进制可执行文件。
虽然我尝试安装了golang,使用
go build 代码.go
build编译未能成功,果断放弃了。
这里,介绍一个很简单的办法,先下载nginx_exporter的docker镜像。
docker pull fish/nginx-exporter
先run一下,执行之后,会hold住,先不要关闭窗口。
docker run -it fish/nginx-exporter
新开一个窗口,查看docker进程
root@ubuntu:~# docker ps|grep nginx-exporter

5baa06db43d9        fish/nginx-exporter   "/usr/local/bin/ngin…"    minutes ago      Up  minutes       /tcp            lucid_germain
复制编译后的文件到/opt
docker cp 5baa06db43d9:/usr/local/bin/nginx_exporter /opt/
执行帮助命令:
root@ubuntu:~# /opt/nginx_exporter --help

Usage of /opt/nginx_exporter:

  -insecure

        Ignore server certificate if using https (default true)

  -nginx.scrape_uri string

        URI to nginx stub status page (default "http://localhost/nginx_status")

  -telemetry.address string

        Address on which to expose metrics. (default ":9113")

  -telemetry.endpoint string

        Path under which to expose metrics. (default "/metrics")
如果能执行成功,说明脚本可以运行了。
然后使用Ctrl+c 关闭docker容器。
三、Nginx开启状态
在线安装nginx
安装nginx
apt-get install -y nginx
编译安装nginx
wget -c http://mirror.nienbo.com/nginx/nginx-1.12.1.tar.gz

tar -zxvf nginx-1.12..tar.gz

cd nginx-1.12.

./configure --prefix=/usr/local/nginx --with-http_stub_status_module

make

make install
编辑配置文件
vi /etc/nginx/sites-enabled/status.conf
注意:这是在线安装nginx的路径。请根据实际情况修改。
内容如下:
server {

       listen ;

       server_name localhost;

       location /nginx_status {

           stub_status on;

           access_log off;

           allow 127.0.0.1;

       }

}
重新加载配置文件
nginx -s reload
访问nginx状态页面
root@ubuntu:/etc/nginx/sites-enabled# curl 127.0.0.1:8011/nginx_status

Active connections:

server accepts handled requests

Reading:  Writing:  Waiting:
四、nginx_exporter封装service服务
创建nginx_exporter目录,移动文件
mkdir -p /etc/nginx_exporter/bin/

mv /opt/nginx_exporter /etc/nginx_exporter/bin/
封装service
vim /lib/systemd/system/nginx_exporter.service
内容如下:
[Unit]

Description=nginx monitor

After=network.target

[Service]

ExecStart=/etc/nginx_exporter/bin/nginx_exporter -nginx.scrape_uri="http://127.0.0.1:8011/nginx_status"

ExecStop=-/sbin/start-stop-daemon --quiet --stop --retry QUIT/5

TimeoutStopSec=5

KillMode=mixed

[Install]

WantedBy=multi-user.target
重新加载service配置文件,设置开机自启动,并启动服务
systemctl daemon-reload

systemctl enable nginx_exporter.service

systemctl start nginx_exporter.service
查看端口
root@ubuntu:/etc/nginx/sites-enabled# netstat -anpt|grep nginx_exporte

tcp               127.0.0.1:         127.0.0.1:          ESTABLISHED /nginx_exporte

tcp6              :::                 :::*                    LISTEN      /nginx_exporte

tcp6              192.168.1.24:       172.17.0.2:        ESTABLISHED /nginx_exporte
使用网页访问metrics
http://192.168.1.24:9113/metrics
效果如下:
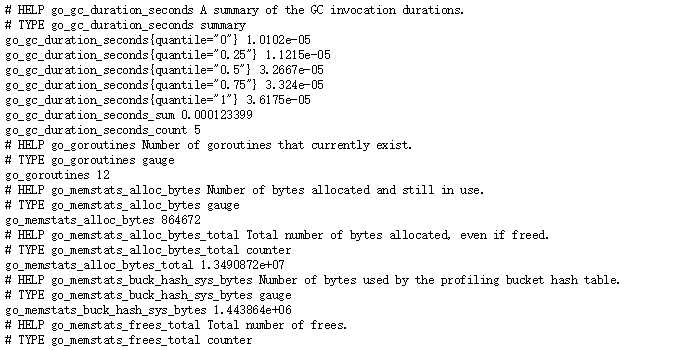
如果数据输出正常,则表示成功。
五、promethus增加job
vim /opt/prometheus/prometheus.yml
增加以下内容:
- job_name: nginx_exporter

static_configs:

  - targets:

    - 192.168.1.24:

    labels:

      instance: nginx-
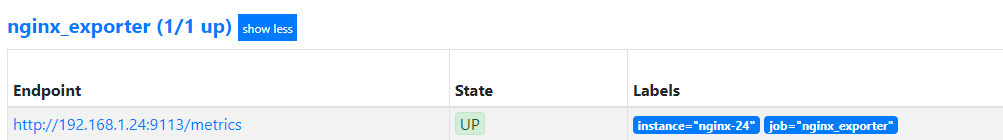
重启prometheus,访问页面:
http://192.168.1.24:9090/targets
确保nginx_exporter状态为UP
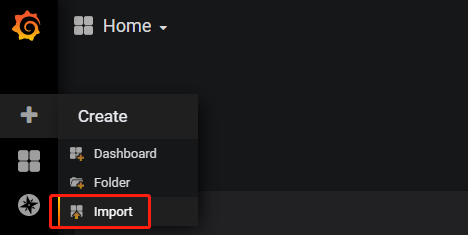
六、Grafana导入Dashboards
下载json文件
https://files.cnblogs.com/files/xiao987334176/Nginx%E7%9B%91%E6%8E%A7-1563001010074.zip
解压之后,里面就是一个json文件
点击import
上传json文件,设置Name,选择prometheus,点击import
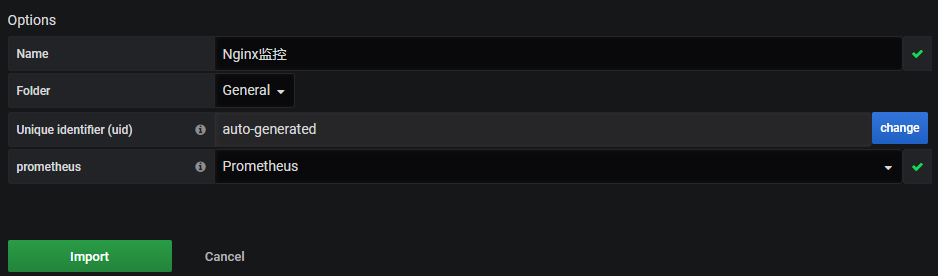
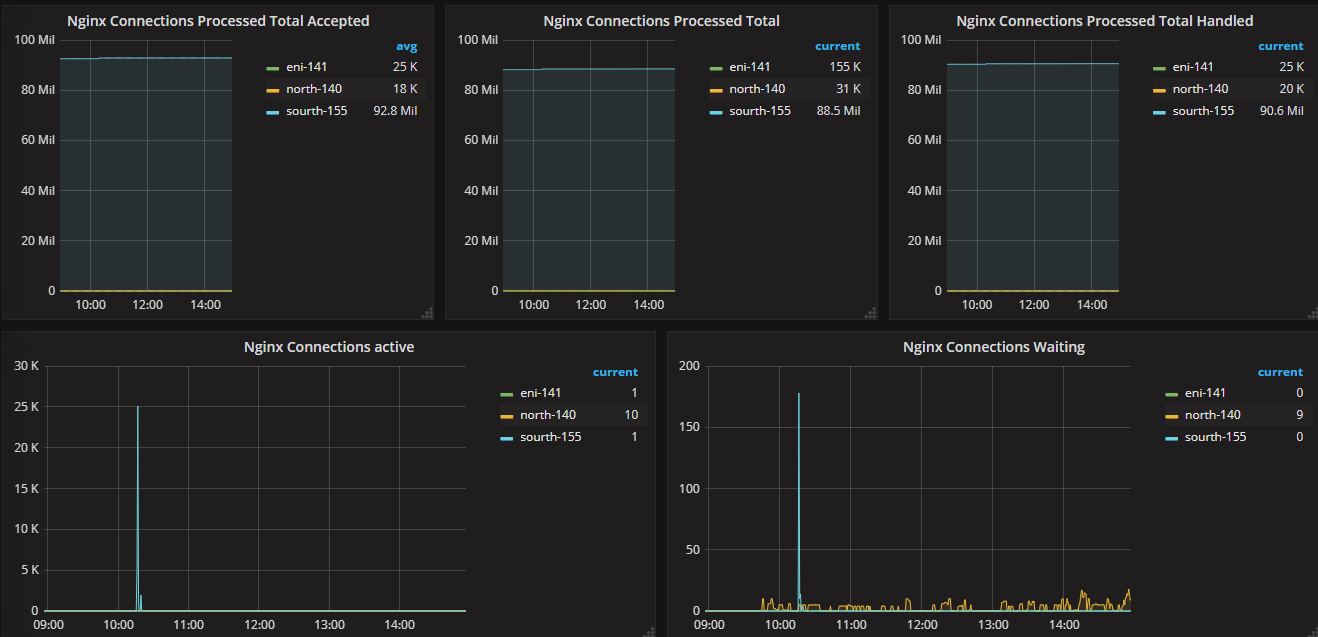
等待一段时间,数据多了之后,效果如下:
注意:TOP10 是没有数据的,据说需要使用脚本实现,具体怎么实现,我也不太清理。
可以直接将没有数据的图标删除掉!
本文参考链接:
https://it.baiked.com/nginx/2697.html
promethus监控nginx的更多相关文章
- Zabbix 监控 Nginx(四)
简介: 如何使用 Zabbix 监控 Nginx 状态 ? 1.获取 Nginx 状态( HTTP Stub Status ) [root@localhost ~]# /apps/product/ng ...
- Python 监控nginx服务是否正常
Python 监控nginx服务是否正常 #!/usr/bin/env python import os, sys, time from time import strftime while True ...
- 让keepalived监控NginX的状态
经过前面的配置,如果主服务器的keepalived停止服务,从服务器会自动接管VIP对外服务:一旦主服务器的keepalived恢复,会重新接管VIP. 但这并不是我们需要的,我们需要的是当NginX ...
- ngxtop:在命令行实时监控 Nginx 的神器
Nginx网站服务器在生产环境中运行的时候需要进行实时监控.实际上,诸如Nagios, Zabbix, Munin 的网络监控软件是支持 Nginx 监控的. 如果你不需要以上软件提供的综合性报告或者 ...
- PHP实现简单的监控nginx日志文件功能
此功能是为了实现,定时监控nginx生成的日志数据,并将新增的数据提交到一个接口(比如大数据的接口,让大数据来进行分析) define("MAX_SHOW", 8192*5); / ...
- Zabbix 监控 Nginx 状态
简介: 如何使用 Zabbix 监控 Nginx 状态 ? 1.获取 Nginx 状态( HTTP Stub Status ) shell > /usr/local/nginx/sbin/ngi ...
- zabbix监控nginx
nginx status详解 active connections – 活跃的连接数量server accepts handled requests — 总共处理了11989个连接 , 成功创建11 ...
- 如何监控 Nginx?
什么是 Nginx? Nginx("engine-x")是一个 HTTP 和反向代理服务器,同时也是一个邮件代理服务器和通用的 TCP 代理服务器.作为一个免费开源的服务器,Ngi ...
- 使用zabbix监控nginx
在zabbix agentd客户端上,查看nginx是否加载了--with-http_stub_status_module.因为zabbix监控nginx是根据 nginx的Stub Status模块 ...
随机推荐
- 洛谷P1577 切绳子题解
洛谷P1577 切绳子题解 题目描述 有N条绳子,它们的长度分别为Li.如果从它们中切割出K条长度相同的 绳子,这K条绳子每条最长能有多长?答案保留到小数点后2位(直接舍掉2为后的小数). 输入输出格 ...
- 使用Sublime Text 写Processing
本来以为是个很简单的事情,没想到一波三折~ 1.下载Sublime Text 3(中文版)并且安装,没啥好说的 2.打开[工具 - 命令面板 - install package],接着就报错了 “Th ...
- NuxtJS如何利用axios异步请求
第一种:使用nuxt 提供的 Axios插件 @nuxtjs/axios 1.安装:npm install @nuxtjs/axios -d 2.配置 nuxt.config.js exports d ...
- shell脚本编程基础之自定义函数库
脚本编程知识点 ${#VAR_NAME}:引用变量中字符的长度 A="25 90 100 120": echo ${A#* }:针对A变量,#表示从左往右,*空格表示以空格为分隔符 ...
- USACO 奶牛抗议 Generic Cow Protests
USACO 奶牛抗议 Generic Cow Protests Description 约翰家的N头奶牛聚集在一起,排成一列,正在进行一项抗议活动.第i头奶牛的理智度 为Ai,Ai可能是负数.约翰希望 ...
- mysql 唯一键
唯一键特点: 1.唯一键在一张表中可以有多个. 2.唯一键允许字段数据为NULL,NULL可以有多个(NULL不参与比较) //一个表中允许存在多个唯一键,唯一键允许为空,在不为空的情况下,不允许重复 ...
- CFD-Post批量添加截面
有时候我们需要在一个算例中截取多个面 我们打开CFD-Post 我们编写如下的Python代码来实现在一个算例当中截取多个面 源代码如下: 上述代码完成以后,我们重新打开CFD-Post
- MetaPruning: Meta Learning for Automatic Neural Network Channel Pruning
MetaPruning: Meta Learning for Automatic Neural Network Channel Pruning 2019-08-11 19:48:17 Paper: h ...
- 【vue】npm、node版本查看及npm常用命令
1,版本查看 node -v npm -v 2,修改NPM的缓存目录和全局目录路径 D盘node目录下创建两个目录,分别是node_cache和node_global,这是用来放安装过程的缓存文件以及 ...
- 从ReentrantLock的实现看AQS的原理及应用 可重入锁
https://mp.weixin.qq.com/s/sA01gxC4EbgypCsQt5pVog