ELK实战部署
环境 :
一台 centos 6.7
IP地址:
192.168.88.250
软件版本 :
ElasticSearch 2.1.0 Logstash 2.1.1 Kibana 4.3.1 JDK 1.8.0.77
JDK 我这里没有地址 就不连接了
下载好JDK 放在路径/usr/local/java
编辑配置文件 /etc/profile
export JAVA_HOME=/usr/local/java/jdk1.8.0_77
export PATH=$JAVA_HOME/bin:$PATH
加入这两句以后 然后 source /etc/profile
确认生效 java -version
[root@master ~]# java -version
java version "1.8.0_77"
Java(TM) SE Runtime Environment (build 1.8.0_77-b03)
Java HotSpot(TM) 64-Bit Server VM (build 25.77-b03, mixed mode)
1、 搭建 ElasticSearch
wget https://download.elasticsearch.org/elasticsearch/release/org/elasticsearch/distribution/tar/elasticsearch/2.1.0/elasticsearch-2.1.0.tar.gz
tar xf elasticsearch-2.1.0.tar.gz
cd /usr/local/elasticsearch-2.1.0/bin
./plugin  -install mobz/elasticsearch-head  # web集群管理插件  安装好了以后可以在plugin文件发现多了一个head
./elasticsearch  -Des.insecure.allow.root=true  #加这个参数才可以root启动

curl -X GET 192.168.88.250:9200   #curl 测试
{
 "name" : "Reeva Payge",
 "cluster_name" : "elasticsearch",
 "version" : {
   "number" : "2.1.0",
   "build_hash" : "72cd1f1a3eee09505e036106146dc1949dc5dc87",
   "build_timestamp" : "2015-11-18T22:40:03Z",
   "build_snapshot" : false,
   "lucene_version" : "5.3.1"
 },
 "tagline" : "You Know, for Search"
}
web地址  http://192.168.88.250:9200/_plugin/head/
2、搭建NGINX
wget   搭建nginx之前需要安装 pcre
tar xf nginx-1.7.8.tar.gz
cd /usr/local/nginx
vim /usr/local/nginx/conf/nginx.conf
#user  nobody;
worker_processes  1;

#error_log  logs/error.log  notice;
#error_log  logs/error.log  info;

#pid        logs/nginx.pid;

events {
  worker_connections  1024;
}

http {

upstream kibana4 {  #对Kibana做代理
       server 127.0.0.1:5601 fail_timeout=0;
}
   include       mime.types;
   default_type  application/octet-stream;

   #log_format  main  '$remote_addr - $remote_user [$time_local] "$request" '
   #                  '$status $body_bytes_sent "$http_referer" '
   #                  '"$http_user_agent" "$http_x_forwarded_for"';

    log_format json '{"@timestamp":"$time_iso8601",'   #配置NGINX的日志格式 json
                       '"host":"$server_addr",'
                       '"clientip":"$remote_addr",'
                       '"size":$body_bytes_sent,'
                       '"responsetime":$request_time,'
                       '"upstreamtime":"$upstream_response_time",'
                       '"upstreamhost":"$upstream_addr",'
                       '"http_host":"$host",'
                       '"url":"$uri",'
                       '"xff":"$http_x_forwarded_for",'
                       '"referer":"$http_referer",'
                       '"agent":"$http_user_agent",'
                       '"status":"$status"}';
    access_log /var/log/nginx/access.log_json json;   #配置日志路径 json格式
    error_log /var/log/nginx/error.log;

   sendfile        on;
   #tcp_nopush     on;

   #keepalive_timeout  0;
   keepalive_timeout  65;

   #gzip  on;

   server {
       listen       80;
       server_name  localhost;

       #charset koi8-r;

       #access_log  logs/host.access.log  main;

       location / {
           root   html;
           index  index.html index.htm;
       }

       #error_page  404              /404.html;

       # redirect server error pages to the static page /50x.html
       #
       error_page   500 502 503 504  /50x.html;
       location = /50x.html {
           root   html;
       }

       # proxy the PHP scripts to Apache listening on 127.0.0.1:80
       #
       #location ~ \.php$ {
       #    proxy_pass   http://127.0.0.1;
       #}

       # pass the PHP scripts to FastCGI server listening on 127.0.0.1:9000
       #
       #location ~ \.php$ {
       #    root           html;
       #    fastcgi_pass   127.0.0.1:9000;
       #    fastcgi_index  index.php;
       #    fastcgi_param  SCRIPT_FILENAME  /scripts$fastcgi_script_name;
       #    include        fastcgi_params;
       #}

       # deny access to .htaccess files, if Apache's document root
       # concurs with nginx's one
       #
       #location ~ /\.ht {
       #    deny  all;
       #}
   }

   # another virtual host using mix of IP-, name-, and port-based configuration
   #
   #server {
   #    listen       8000;
   #    listen       somename:8080;
   #    server_name  somename  alias  another.alias;

   #    location / {
   #        root   html;
   #        index  index.html index.htm;
   #    }
   #}

   # HTTPS server
   #
   #server {
   #    listen       443 ssl;
   #    server_name  localhost;

   #    ssl_certificate      cert.pem;
   #    ssl_certificate_key  cert.key;

   #    ssl_session_cache    shared:SSL:1m;
   #    ssl_session_timeout  5m;

   #    ssl_ciphers  HIGH:!aNULL:!MD5;
   #    ssl_prefer_server_ciphers  on;

   #    location / {
   #        root   html;
   #        index  index.html index.htm;
   #    }
   #}


server {
   listen               *:80;
   server_name          kibana_server;
   access_log           /var/log/nginx/kibana.srv-log-dev.log;
   error_log            /var/log/nginx/kibana.srv-log-dev.error.log;

   location / {
       root   /var/www/kibana;
       index  index.html  index.htm;
   }

   location ~ ^/kibana4/.* {
       proxy_pass           http://kibana4;
       rewrite             ^/kibana4/(.*)  /$1 break;       proxy_set_header     X-Forwarded-For $proxy_add_x_forwarded_for;       proxy_set_header     Host            $host;       auth_basic           "Restricted";       auth_basic_user_file /etc/nginx/conf.d/kibana.myhost.org.htpasswd;   }}}
3、搭建 Logstash
wget https://download.elastic.co/logstash/logstash/logstash-2.1.1.tar.gz
tar xf logstash-2.1.1.tar.gz
cd /usr/local/logstash-2.1.1/bin
vim stdin.conf #编写配置文件
input{
       file {
               path => "/var/log/nginx/access.log_json"  #NGINX日志地址 json格式
              codec => "json"  json编码
       }
}
filter {
       mutate {
               split => ["upstreamtime", ","]
       }
       mutate {
               convert => ["upstreamtime", "float"]
       }
}
output{

       elasticsearch {
               hosts => ["192.168.88.250:9200"]   #elasticsearch地址
               index => "logstash-%{type}-%{+YYYY.MM.dd}"   #索引
               document_type => "%{type}"
               workers => 1
               flush_size => 20000        #传输数量 默认500
               idle_flush_time => 10      #传输秒数  默认1秒
               template_overwrite => true
       }
}
./logstash -f stdin.conf &  #后台启动
启动成功以后 打开刚才搭建的web服务器  es就能看到数据
4、搭建Kibana
wget https://download.elastic.co/kibana/kibana/kibana-4.3.1-linux-x64.tar.gz
tar xf kibana-4.3.1-linux-x64.tar.gz
cd /usr/local/kibana-4.3.1-linux-x64/
vim ./config/kibana.yml

elasticsearch.url: "   只需要修改URL为ElasticSearch的IP地址
./kibana &  后台启动

启动成功以后 会监听 5601端口
全部搭建好了以后就可以用Kibana查看
地址 : 192.168.88.250:5601
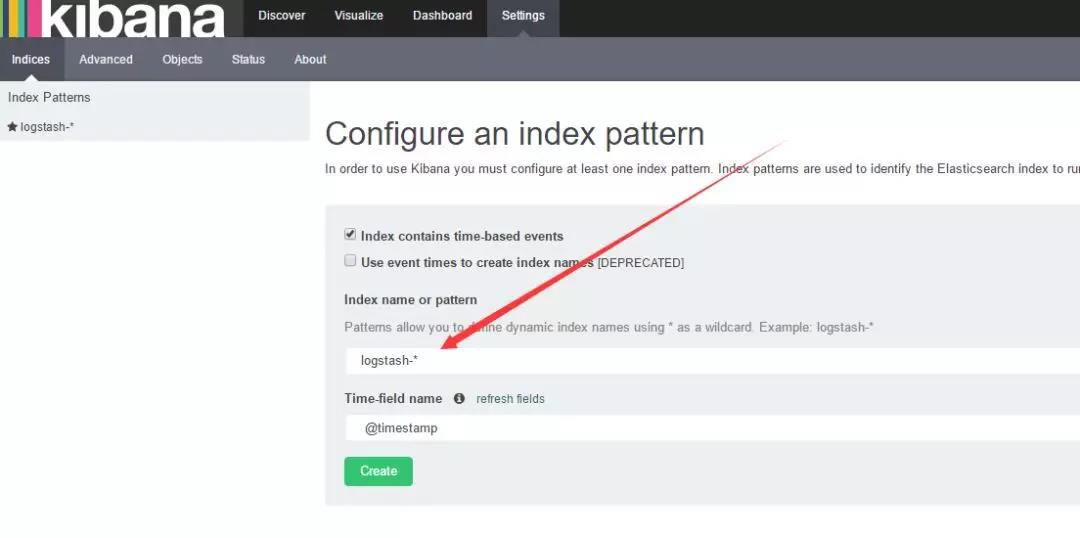
如果create灰色的 说明没有创建索引 打开你的nginx服务器 刷新几下 采集一下数据
然后 选择 左上角的 Discover
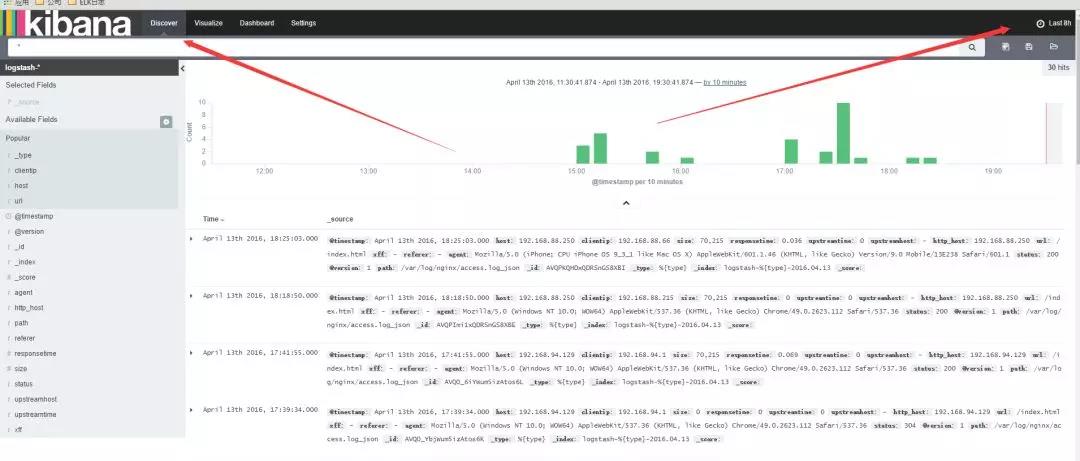
数据可能会出不来 那是因为 Kibana 是根据时间来匹配的 并且 因为 Logstash的采集时间使用的UTC 永远早8个小时
所以设置时间 要设置晚8个小时以后

设置好了时间以后 。数据基本就会看的到
这里可以设置你想看到的任意 数据 选择 add 就能看到的 不想看 可以remove
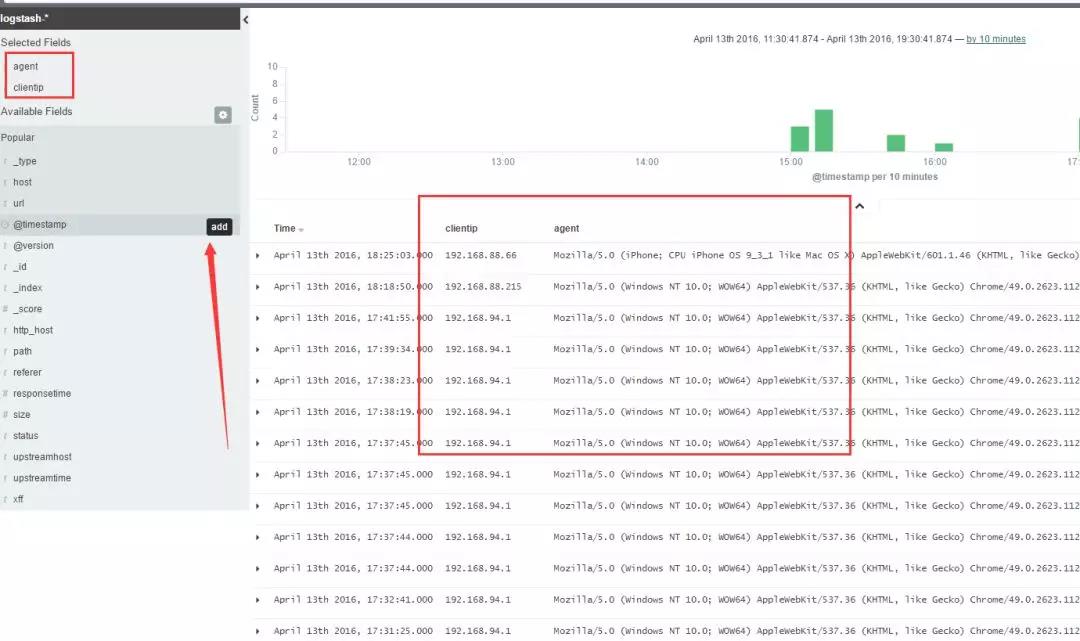
还有后面的 Visualize 也可以个性化定制图标

基本就到此结束了,另外如果 Kibana出不来数据 一般都是因为时间设置不正确。
ELK实战部署的更多相关文章
- ELK 安装部署实战 (最新6.4.0版本)
一.实战背景 根据公司平台的发展速度,对于ELK日志分析日益迫切.主要的需求有: 1.用户行为分析 2.运营活动点击率分析 作为上述2点需求,安装最新版本6.4.0是非常有必要的,大家可根据本人之前博 ...
- elk实战分析nginx日志文档
elk实战分析nginx日志文档 架构: kibana <--- es-cluster <--- logstash <--- filebeat 环境准备:192.168.3.1 no ...
- Docker环境 ELK 快速部署
Docker环境 ELK快速部署 环境 Centos 7.4 , Docker version 17.12 Docker至少3GB内存: #内核配置 echo ' vm.max_map_count = ...
- Zookeeper+Kafka完全分布式实战部署
Zookeeper+Kafka完全分布式实战部署 作者:尹正杰 版权声明:原创作品,谢绝转载!否则将追究法律责任. 其实我之前部署过kafak和zookeeper的完全分布式,集群是可以正常使用没错, ...
- Docker swarm 实战-部署wordpress
Docker swarm 实战-部署wordpress 创建一个overlay的网络 docker network create -d overlay demo 6imq8da3vcwvj2n499k ...
- mfs分布式系统从理论简介到实战部署
文章前面想说的话:这篇博客写出来真是有点累到了,本来昨天就基本就写好了,放在草稿里面,今天打开就没有了!!唉,就尼玛离我而去了,只有重写,然后中间虚拟机还“爆炸”重启又搞了一会,不容易呀!!希望各位博 ...
- 精讲 使用ELK堆栈部署Kafka
使用ELK堆栈部署Kafka 通过优锐课的java架构学习分享,在本文中,我将展示如何使用ELK Stack和Kafka部署建立弹性数据管道所需的所有组件. 在发生生产事件后,恰恰在你最需要它们时,日 ...
- K8S(13)监控实战-部署prometheus
k8s监控实战-部署prometheus 目录 k8s监控实战-部署prometheus 1 prometheus前言相关 1.1 Prometheus的特点 1.2 基本原理 1.2.1 原理说明 ...
- ELK快速部署及使用~
Elastic Stack 开发人员不能登陆线上服务器查看详细日志 各个系统都有日志,日志数据分散难以查找 日志数据量大,查询速度慢,或者数据不够实时 官网地址:https://www.elastic ...
随机推荐
- 一文搞懂Java/Spring/Dubbo框架中的SPI机制
几天前和一位前辈聊起了Spring技术,大佬突然说了SPI,作为一个熟练使用Spring的民工,心中一紧,咱也不敢说不懂,而是在聊完之后赶紧打开了浏览器,开始的学习之路,所以也就有了这篇文章.废话不多 ...
- 第11篇-认识Stub与StubQueue
在 第10篇-初始化模板表 我们介绍过TemplateInterpreter::initialize()函数,在这个函数中会调用TemplateTable::initialize()函数初始化模板表, ...
- 个人笔记-----Vue中多个router-view应用
单个 <router-view/> 和多个 <router-view/> 的区别,单个 <router-view/> 只是一个区域的变化,不需要设置name属性,在 ...
- centos7 添加磁盘到/(根目录下),扩展VG卷和lv
转载自:http://blog.itpub.net/25469263/viewspace-2662215/ centos7中使用vg方式扩充root分区 1.创建pv fdisk /dev/sdb 输 ...
- 快速排序的Partition函数
1 //数组中两个数的交换 2 static void swap(int[] nums, int pos1, int pos2){ 3 int temp = nums[pos1]; 4 nums[po ...
- hdfs中数据迁移
1.hdfs集群间数据迁移 hadoop distcp hdfs://192.128.112.66:8020/user/hive/warehouse/data.db/dwi_xxxx_d /user ...
- OVN架构
原文地址 OVN架构 1.简介 OVN,即Open Virtual Network,是一个支持虚拟网络抽象的系统. OVN补充了OVS的现有功能,增加了对虚拟网络抽象的原生(native)支持,比如虚 ...
- centos7 wget安装jdk
2021-07-151. 环境介绍 操作系统:centos7 jdk版本:jdk1.8.0.211 2. 下载 进入 https://www.oracle.com/java/technologies/ ...
- Python文件(File)及读写操作及生成器yield
open函数在内存中创建缓存区,将磁盘上的内容复制到此处.文件内容读入到文件对象缓冲区后,文件对象将缓冲区视为非常大的列表,其中每个元素都有一个索引.文件对象按字节(大约每个字符)来对文件对象缓冲区索 ...
- win+R 中的命令
cmd------CMD命令提示符 MSConfig------系统配置实用程序 regedit------注册表编辑器 notepad------打开记事本 calc------启动计算器 msts ...