小程序中多个echarts折线图在同一个页面的使用
最近做小程序的业务中遇到一个页面要同时显示几个echarts图,刚开始遇到各种冲突,死数据可以,动态数据就报错的问题,折磨了一天,仔细看了官网和查在各种资料之后,终于解决了。
直接上代码:
commin.js

/***

 * echartName : echarts的别名

 * func :渲染函数的函数名

 * ***/

function wxCharts(echartName,fun) {

  this.chart1 = echartName; //去获取echarts    这里的id就是echarts的id

  this.chart1.init((canvas, width, height, dpr) => {

    // 初始化图表

    let barChart = echarts.init(canvas, null, { //echarts会继承父元素的宽高

      width: width,

      height: height,

      devicePixelRatio: dpr // 像素

    });

    barChart.setOption(fun);

    return barChart; //一定要return出去

  });

}

module.exports.wxCharts = wxCharts;
html :

  <!--圆环 -->

  <ec-canvas id="tendency" canvas-id="tendency" force-use-old-canvas="true" ec="{{ tendency }}" ></ec-canvas>

  <!--或者:-->

  <ec-canvas id="tendency" canvas-id="tendency"  ec="{{ tendency }}" ></ec-canvas>
js:
data:{
//圆环
tendency: {
disableTouch: true,
lazyLoad: true
} },
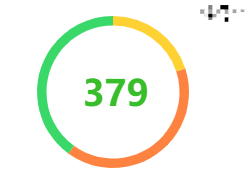
//圆
tendencyInit:function (chartData) {
this.chart = this.selectComponent('#tendency'); //去获取echarts 这里的id就是echarts的id
commin.wxCharts(this.chart,this.tendencyvray(chartData))
},
// 这里换成 所需折现图的配置就可以了
tendencyvray: function (chartData) {
var option = {
backgroundColor: "#ffffff",
series: [{
type: 'pie',
label: {
normal: {
position: 'inner'
}
},
center: ['50%', '50%'],
radius: ['80%', '70%'],
data: chartData
}]
}
return option
}, //这里是折现图的数据就可以了
tendencyInitData:function () {
let chartData = [
{
value:20,
itemStyle: { color: '#FFD234' }
},
{
value:40,
itemStyle: { color: '#FF8340' }
},
{
value: 40,
itemStyle: { color: '#3AD868' }
}
]
this.tendencyInit(chartData)
},
html :
<!--叠加柱状图-->

  <ec-canvas id="stat" canvas-id="stat" force-use-old-canvas="true" ec="{{ stat }}" ></ec-canvas>

  <!--或者-->

  <ec-canvas id="stat" canvas-id="stat"  ec="{{ stat }}" ></ec-canvas>
js:
data:{
//叠加柱状图
stat:{
disableTouch: true,
lazyLoad: true
}
},
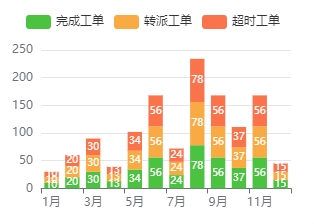
//叠加柱状图 --- chart图
chargeYears:function (chartData) {
this.chart = this.selectComponent('#stat'); //去获取echarts 这里的id就是echarts的id
commin.wxCharts(this.chart,this.chargevrayYears(chartData))
},
chargevrayYears:function (chartData) {
let option = {
legend: {
data: ['完成工单', '转派工单','超时工单']
},
tooltip:{
axisPointer:{
type:"shadow"
},
trigger:"axis"
},
label:{
position:"insideRight",
show:true
},
grid:{
top:'40',
bottom:"20%",
containLabel:true,
left:"3%",
right:"4%"
},
xAxis:{
data:['1月','2月','3月','4月','5月','6月','7月','8月','9月','10月','11月','12月'],
type:"category"
},
yAxis:{
type:"value"
},
series: chartData.seriesData
}
return option
},
chargeInitYears() {
var dataArr = [
{
data:[10,20,30,13,34,56,24,78,56,37,56,15],
label:{
"position":"insideRight",
},
name:"完成工单",
stack:"总量",
type:"bar",
color:"#4CC340",
},
{
data:[10,20,30,13,34,56,24,78,56,37,56,15],
label:{
"position":"insideRight",
},
name:"转派工单",
stack:"总量",
type:"bar",
color:"#FAAA42"
},
{
data:[10,20,30,13,34,56,24,78,56,37,56,15],
label:{
"position":"insideRight",
},
name:"超时工单",
stack:"总量",
type:"bar",
color:"#FA734B"
},
]
for (var i = 0; i < dataArr.length; i++) {
var dic = dataArr[i];
dic['type'] = 'bar';
dic['itemStyle'] = {
normal: {
label: {
show: true, //开启显示
position: 'inside', //在上方显示
distance: i == 0 ? 5 : 10,
formatter: function (val) {
if (val.value !== 0) {
return val.value;
} else {
return '';
}
},
textStyle: { //数值样式
fontSize: 10,
color: '#fff'
}
},
}
}
}
var chartData = {
seriesData: dataArr
};
this.chargeYears(chartData)
},
html :
  <!--柱状图-->

  <ec-canvas id="station" canvas-id="station" force-use-old-canvas="true" ec="{{ station }}" ></ec-canvas>

  <!--或者-->

  <ec-canvas id="station" canvas-id="station"  ec="{{ station }}" ></ec-canvas>
JS :
data:{
//柱状图
station:{
disableTouch: true,
lazyLoad: true
},
},
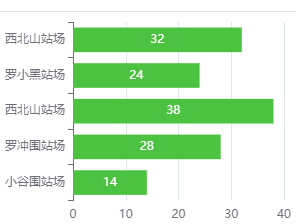
//柱状图 --- chart图
station: function (chartData) {
this.chart = this.selectComponent('#station'); //去获取echarts 这里的id就是echarts的id
commin.wxCharts(this.chart,this.stationvray(chartData))
},
stationvray: function (chartData) {
var option = {
color:'#4CC340',
type: 'bar',
label: {
normal: {
show: true,
position: 'top'
}
},
grid: {
top:'0',
left: '3%',
right: '4%',
bottom: '20%',
containLabel: true
},
tooltip: {
trigger: 'axis'
},
xAxis: {
type: 'value',
},
yAxis: {
type: 'category',
data: ['小谷围站场','罗冲围站场','西北山站场','罗小黑站场','西北山站场'],
},
series: chartData.seriesData
}
return option
},
stationInitChart(){
var chartData = {
seriesData: [{
type:'bar',
label: {
show: true, //开启显示
position: 'inside', //在上方显示
color:"#fff"
},
data: [14,28,38,24,32],
},
]
};
this.station(chartData)
}
 index.html

<!--圆-->

  <ec-canvas id="warn" canvas-id="warn" force-use-old-canvas="true" ec="{{ warn }}" ></ec-canvas>

  <!--或者-->

  <ec-canvas id="warn" canvas-id="warn" ec="{{ warn }}" ></ec-canvas>
Js :
data:{
//圆
warn:{
disableTouch: true,
lazyLoad: true
}
},
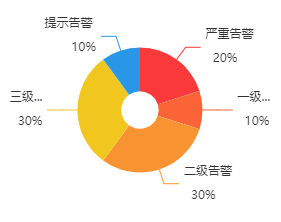
// 圆
warnInit:function (chartData) {
this.chart = this.selectComponent('#warn'); //去获取echarts 这里的id就是echarts的id
commin.wxCharts(this.chart,this.warnvray(chartData))
},
warnvray: function (chartData) {
var option = {
backgroundColor: "#ffffff",
series: [{
label: {
formatter: '{b} \n\n {d}%',
},
type: 'pie',
center: ['50%', '40%'],
radius: ['15%', '50%'],
data: chartData
}]
}
return option
},
warnInitChart:function () {
let chartData = [
{
value:20,
name:"严重告警",
itemStyle: { color: '#fa393a' }
},
{
value:10,
name:"一级告警",
itemStyle: { color: '#FA6437' }
},
{
value: 30,
name:"二级告警",
itemStyle: { color: '#F79431' }
},
{
value: 30,
name:"三级告警",
itemStyle: { color: '#F0C61F' }
},
{
value: 10,
name:"提示告警",
itemStyle: { color: '#2997E6' }
}
]
this.warnInit(chartData)
}
小程序中多个echarts折线图在同一个页面的使用的更多相关文章
- 微信小程序中自定义swiper轮播图面板指示点的样式
重置样式: .swiper{ width: 100%; height: 240px; margin-bottom: 0.5rem; position:relative; } div.wx-swiper ...
- 在微信小程序中使用富文本转化插件wxParse
在微信小程序中我们往往需要展示一些丰富的页面内容,包括图片.文本等,基本上要求能够解析常规的HTML最好,由于微信的视图标签和HTML标签不一样,但是也有相对应的关系,因此有人把HTML转换做成了一个 ...
- 微信小程序中的组件使用1
不管是vue还是react中,都在强调组件思想,同样,在微信小程序中也是使用组件思想来实现页面复用的,下面就简单介绍一下微信小程序中的组件思想. 组件定义与使用 要使用组件,首先需要有组件页面和使用组 ...
- 在微信小程序中使用 echarts 图片-例 折线图
首先进入echarts官方[https://echarts.apache.org/handbook/zh/get-started/].这边只需要在小程序中简单应用一下echarts折线图 所以不需要把 ...
- 微信小程序中使用ECharts 异步加载数据 实现图表
<!--pages/bar/index.wxml--> <view class="container"> <ec-canvas id="my ...
- 微信小程序中悬浮窗功能的实现(主要探讨和解决在原生组件上的拖动)
问题场景 所谓悬浮窗就是图中微信图标的按钮,采用fixed定位,可拖动和点击. 这算是一个比较常见的实现场景了. 为什么要用cover-view做悬浮窗?原生组件出来背锅了~ 最初我做悬浮窗用的不是c ...
- 微信小程序中在swiper-item中遍历循环添加多个数据内容(微信小程序交流群:604788754)
在小程序中为了实现一个<swiper-item>中添加多个内容重复的标签,那就需要使用wx:for循环.如果按小程序的简易教程,循环加在block中,而swiper-item放在里面.所有 ...
- 实现Echarts折线图的虚实转换
需求:医院的体温单,在统计体温时,对于正常情况下统计的体温数据,需要显示实线:对于进行物理降温后统计的体温数据,需要显示虚线. 现有的体温单是运用 Echarts 折线图,统一用实线显示.因此在这基础 ...
- 微信小程序中用户登录和登录态维护
提供用户登录以及维护用户的登录状态,是一个拥有用户系统的软件应用普遍需要做的事情.像微信这样的一个社交平台,如果做一个小程序应用,我们可能很少会去做一个完全脱离和舍弃连接用户信息的纯工具软件. 让用户 ...
随机推荐
- QT 之 ODBC连接人大金仓数据库
QT 之 使用 ODBC 驱动连接人大金仓数据库 获取数据库驱动和依赖动态库 此操作可在人大金仓官网下载与系统匹配的接口动态库,或者从架构数据库的源码中获取驱动和依赖动态库 分别为: 驱动动态库:kd ...
- 关于.Net Core使用Elasticsearch(俗称ES)、Kibana的研究说明
关于ElasticSearch Elasticsearch是一个分布式的开源搜索和分析引擎,适用于所有类型的数据,包括文本.数字.地理空间.结构化和非结构化数据.Elasticsearch 在 Apa ...
- oracle sqlldr导入数据和导入去除空格
1.新建目录E:\load把需要导入的数据文件放到目录下面 这是我自己造的测试数据... 2.在文件下新建脚本文件 Load data infile 'E:\load\info.txt' into t ...
- 解决List遍历删除元素提示ConcurrentModificationException
JDK1.8提供新的API ===> removeIf public static void main(String[] args) { List<String> list = ...
- 关于PHP导出数据超时的优化
一般情况下,导出超时可能都是以下三种情况: 一.sql语句复杂,查询时间过长: 二.处理查询后数据逻辑冗余: 三.数据量过大导致响应超时. 接下来分别给出这三种情况的优化建议. 一.sql语句复杂,查 ...
- Vue 动态组件和异步组件
基础案例 动态组件切换类比"bilibili-个人中心"的横向菜单切换不同的标签页的功能. 在Vue中可以使用 component 标签,并加一个特殊的属性(attribute) ...
- Redis的并发竞争问题,你用哪些方案来解决?
Redis的并发竞争问题,主要是发生在并发写竞争. 考虑到redis没有像db中的sql语句,update val = val + 10 where ...,无法使用这种方式进行对数据的更新. 假如有 ...
- linux下的压缩命令 tar zip gunzip
p.p1 { margin: 0; font: 12px Arial; color: rgba(5, 42, 136, 1) } p.p2 { margin: 0; font: 12px " ...
- C语言:键盘输入
C语言有多个函数可以从键盘获得用户输入,它们分别是: scanf():和 printf() 类似,scanf() 可以输入多种类型的数据. getchar().getche().getch():这三个 ...
- UI作品评审总结:切忌过度设计,注意设计闭环
本期,我们一起看看学长认证模块--UI同学的作品评审. 拿好小板凳,做好笔记,我们开始吧! 我们拿了两个典型的作品进行了一个讲解,做的特色都还不错,但是都有些小问题. 先来看一下第一位 ...