sklearn6_生成分类数据
python机器学习-乳腺癌细胞挖掘(博主亲自录制视频)
https://study.163.com/course/introduction.htm?courseId=1005269003&utm_campaign=commission&utm_source=cp-400000000398149&utm_medium=share

生成2类数据
n_features :特征个数= n_informative() + n_redundant + n_repeated
n_informative:多信息特征的个数
n_redundant:冗余信息,informative特征的随机线性组合
n_repeated :重复信息,随机提取n_informative和n_redundant 特征
n_classes:分类类别
n_clusters_per_class :某一个类别是由几个cluster构成的
from sklearn import preprocessing

import numpy as np

#生成分类数据的分类器

from sklearn.datasets.samples_generator import make_classification

#自动生成训练数据和测试数据

from sklearn.cross_validation import train_test_split

#导入支持向量模型

from sklearn.svm import SVC

import matplotlib.pyplot as plt

x,y=make_classification(n_samples=300,n_features=2,n_redundant=0,n_informative=2,random_state=22,n_clusters_per_class=1,scale=100)

#c=y表示color为黄色

plt.scatter(x[:,0],x[:,1],c=y)

plt.show()

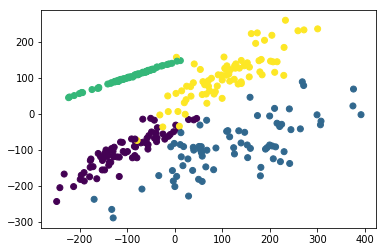
生成4类数据
# -*- coding: utf-8 -*-

"""

Created on Sun Jan  7 15:54:56 2018

@author: Administrator

"""

from sklearn import preprocessing

import numpy as np

#生成分类数据的分类器

from sklearn.datasets.samples_generator import make_classification

#自动生成训练数据和测试数据

from sklearn.cross_validation import train_test_split

#导入支持向量模型

from sklearn.svm import SVC

import matplotlib.pyplot as plt

#n_classes=4生成4类数据

x,y=make_classification(n_classes=4,n_samples=300,n_features=2,n_redundant=0,n_informative=2,random_state=22,n_clusters_per_class=1,scale=100)

#c=y表示color为黄色

plt.scatter(x[:,0],x[:,1],c=y)

plt.show()
# -*- coding: utf-8 -*-

"""

Created on Sun Jan  7 16:51:38 2018

@author: Administrator

"""

import matplotlib.pyplot as plt

from sklearn.datasets import make_classification

from sklearn.datasets import make_blobs

from sklearn.datasets import make_gaussian_quantiles

from sklearn.datasets import make_hastie_10_2

plt.figure(figsize=(8, 8))

plt.subplots_adjust(bottom=.05, top=.9, left=.05, right=.95)

plt.subplot(421)

plt.title("One informative feature, one cluster per class", fontsize='small')

X1, Y1 = make_classification(n_samples=1000,n_features=2, n_redundant=0, n_informative=1,

                             n_clusters_per_class=1)

plt.scatter(X1[:, 0], X1[:, 1], marker='o', c=Y1)

plt.subplot(422)

plt.title("Two informative features, one cluster per class", fontsize='small')

X1, Y1 = make_classification(n_samples=1000,n_features=2, n_redundant=0, n_informative=2,

                             n_clusters_per_class=1)

plt.scatter(X1[:, 0], X1[:, 1], marker='o', c=Y1)

plt.subplot(423)

plt.title("Two informative features, two clusters per class", fontsize='small')

X2, Y2 = make_classification(n_samples=1000,n_features=2, n_redundant=0, n_informative=2)

plt.scatter(X2[:, 0], X2[:, 1], marker='o', c=Y2)

plt.subplot(424)

plt.title("Multi-class, two informative features, one cluster",

          fontsize='small')

X1, Y1 = make_classification(n_samples=1000,n_features=2, n_redundant=0, n_informative=2,

                             n_clusters_per_class=1, n_classes=3)

plt.scatter(X1[:, 0], X1[:, 1], marker='o', c=Y1)

plt.subplot(425)

plt.title("Three blobs", fontsize='small')

X1, Y1 = make_blobs(n_samples=1000,n_features=2, centers=3)

plt.scatter(X1[:, 0], X1[:, 1], marker='o', c=Y1)

plt.subplot(426)

plt.title("Gaussian divided into four quantiles", fontsize='small')

X1, Y1 = make_gaussian_quantiles(n_samples=1000,n_features=2, n_classes=4)

plt.scatter(X1[:, 0], X1[:, 1], marker='o', c=Y1)

plt.subplot(427)

plt.title("hastie data ", fontsize='small')

X1, Y1 = make_hastie_10_2(n_samples=1000)

plt.scatter(X1[:, 0], X1[:, 1], marker='o', c=Y1)

plt.show()

# -*- coding: utf-8 -*-
"""
Created on Sun Jan 7 16:29:35 2018 @author: Administrator
""" import matplotlib.pyplot as plt from sklearn.datasets import make_classification
from sklearn.datasets import make_blobs
from sklearn.datasets import make_gaussian_quantiles
from sklearn.datasets import make_hastie_10_2 #画布的大小为长20cm高20cm
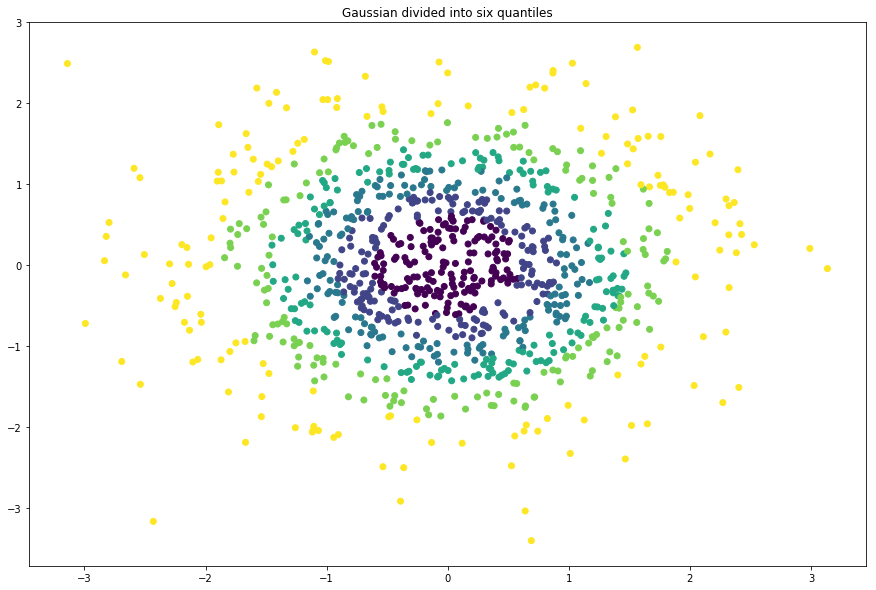
plt.figure(figsize=(15,10)) #标题,fontsize为标题字体大小
plt.title("Gaussian divided into six quantiles", fontsize='large')
X1, Y1 = make_gaussian_quantiles(n_samples=1000,n_features=2, n_classes=6) #绘制点,X1[:, 0]为点的x列表值, X1[:, 1]为点的y列表值, c=Y1表示颜色,c为color缩写
plt.scatter(X1[:, 0], X1[:, 1], marker='o', c=Y1)
# -*- coding: utf-8 -*-
"""
Created on Sun Jan 7 16:51:38 2018 @author: Administrator
""" from sklearn.datasets import make_circles
from sklearn.datasets import make_moons
import matplotlib.pyplot as plt
import numpy as np #画布的大小为长20cm高20cm
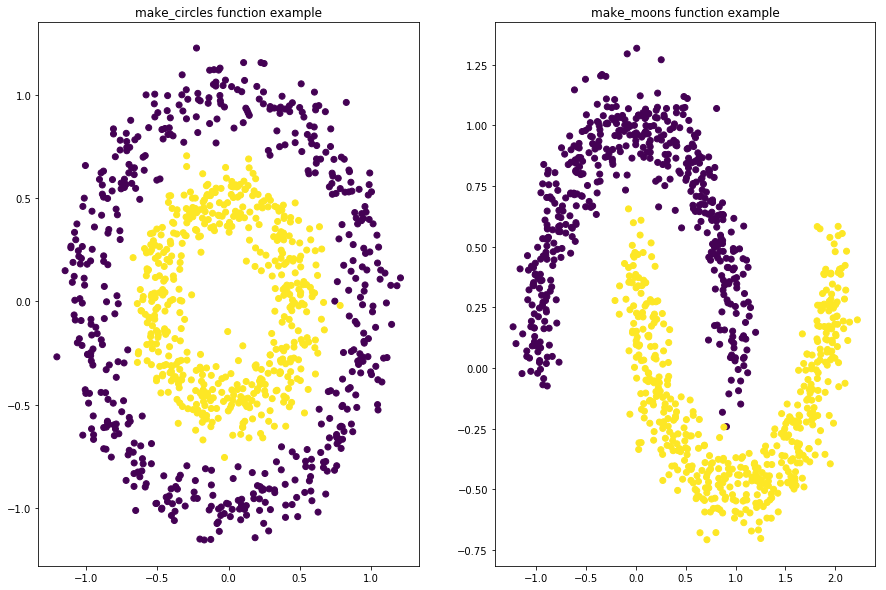
plt.figure(figsize=(15,10)) fig=plt.figure(1)
x1,y1=make_circles(n_samples=1000,factor=0.5,noise=0.1)
plt.subplot(121)
plt.title('make_circles function example')
plt.scatter(x1[:,0],x1[:,1],marker='o',c=y1) plt.subplot(122)
x1,y1=make_moons(n_samples=1000,noise=0.1)
plt.title('make_moons function example')
plt.scatter(x1[:,0],x1[:,1],marker='o',c=y1)
plt.show()
https://study.163.com/provider/400000000398149/index.htm?share=2&shareId=400000000398149( 欢迎关注博主主页,学习python视频资源,还有大量免费python经典文章)

sklearn6_生成分类数据的更多相关文章
- Python之机器学习-sklearn生成随机数据
sklearn-生成随机数据 import numpy as np import pandas as pd import matplotlib.pyplot as plt from matplotli ...
- 无限级分类及生成json数据
第一步,先去数据库查询类别数据,然后交给生成json数据的函数处理,代码如下: /*生成类别JSON数据*/ public function wirteJson(){ $dataInfo = \thi ...
- SAP QA32 做使用决策系统报错:分类数据的不一致性=>交易终止
SAP QA32 做使用决策系统报错:分类数据的不一致性=>交易终止 QA32,对如下检验批做处理,系统报错, 试图使用MSC3N去显示这个批次主数据,同样报错, 原因在于批次的分类数据产生后, ...
- flask实战-个人博客-数据库-生成虚拟数据 --
3.生成虚拟数据 为了方便编写程序前台和后台功能,我们在创建数据库模型后就编写生成虚拟数据的函数. 1)管理员 用于生成虚拟管理员信息的fake_admin()函数如下所示: personalBlog ...
- Enterprise Solution 生成实体数据访问接口与实现类型 Code Smith 6.5 模板文件下载
数据库表定义为SalesOrder,用LLBL Gen Pro生成的实体定义是SalesOrderEntity,再用Code Smith生成的数据读写接口是ISalesOrderManager,最后是 ...
- 改用C++生成自动化数据表
改用C++生成自动化数据表 前面的文章中,我们讨论了使用一个基于.NET的第三方程序库来从程序中来生成数据表.在我看来,这整个思路是非常有用的,例如为显示测试结果.我经常会自己在博客中尝试各种像这样的 ...
- SQL Server中公用表表达式 CTE 递归的生成帮助数据,以及递归的典型应用
本文出处:http://www.cnblogs.com/wy123/p/5960825.html 我们在做开发的时候,有时候会需要一些帮助数据,必须需要连续的数字,连续间隔的时间点,连续的季度日期等等 ...
- 公用表表达式(CTE)递归的生成帮助数据
本文的作者辛苦了,版权问题特声明本文出处:http://www.cnblogs.com/wy123/p/5960825.html 工作有时候会需要一些帮助数据,必须需要连续的数字,连续间隔的时间点,连 ...
- TreeView递归绑定无限分类数据
TreeView递归绑定无限分类数据 实现一个动态绑定,无限级分类数据时,需要将数据绑定到TreeView控件,分类表的结构是这样的: 字段 类型 Id int ParentId int Name N ...
随机推荐
- [图片生成]使用VAEs生成新图片
变分自动编码器生成图片 从隐图像空间进行采样以创建全新的图像或编辑现有图像是目前创作AI最受欢迎和最成功的应用方式. 图像隐空间取样 图像生成的关键思想是开发表示的低维潜在空间(自然是矢量空间),其中 ...
- PostgreSQL安装和配置---Ubuntu
PostgreSQL安装和配置---Ubuntu
- libgdx学习记录12——圆角矩形CircleRect
libgdx提供了ShapeRenderer这个工具,用它可以画点.画线.画圆.画矩形.画椭圆.画扇形,但是没有提供画圆角矩形的方法. 刚开始自己尝试分成8端,4端画直线,4端画扇形,发现多了半径几部 ...
- ajax传参data里面的键是一个变量的解决方法
直接用这种方式来传参,比如bean中有字段 username password,则是 data[username] = "用户名"; data[password] = " ...
- python面试题(四)
一.数据类型 1.字典 1.1 现有字典 dict={‘a’:24,‘g’:52,‘i’:12,‘k’:33}请按字典中的 value 值进行排序? sorted(dict.items(),key=l ...
- 如何使用URLOS进行docker应用开发
使用Docker技术可以帮助企业快速水平扩展服务,从而到达弹性部署业务的能力.在云服务概念兴起之后,Docker的使用场景和范围进一步发展,如今在微服务架构越来越流行的情况下,微服务+Docker的完 ...
- PAT-1004 Counting Leaves
1004 Counting Leaves (30 分) A family hierarchy is usually presented by a pedigree tree. Your job is ...
- 假设检验,alpha,p值 通俗易懂的的理解。
假设检验: 一般原假设H0 :表是为 XXX和YYYY无显著差异,H1,是有显著差异. 如果我们定义alpha的值是0.05.意味着我们接受H0是真的但是我们却认为他是假的的概率. 这里你想想,这个值 ...
- 1084. Broken Keyboard (20)-水题
#include <iostream> #include <cstdio> #include <string.h> #include <algorithm&g ...
- extjs几个奇怪的错误
在用Extjs进行网页开发的时候,遇见了一下两个错误,这两个错误的位置用firebug调试显示在extjs-all.js Ext.resetElement is undefined g.el is n ...