sklearn6_生成分类数据
python机器学习-乳腺癌细胞挖掘(博主亲自录制视频)
https://study.163.com/course/introduction.htm?courseId=1005269003&utm_campaign=commission&utm_source=cp-400000000398149&utm_medium=share

生成2类数据
n_features :特征个数= n_informative() + n_redundant + n_repeated
n_informative:多信息特征的个数
n_redundant:冗余信息,informative特征的随机线性组合
n_repeated :重复信息,随机提取n_informative和n_redundant 特征
n_classes:分类类别
n_clusters_per_class :某一个类别是由几个cluster构成的
from sklearn import preprocessing

import numpy as np

#生成分类数据的分类器

from sklearn.datasets.samples_generator import make_classification

#自动生成训练数据和测试数据

from sklearn.cross_validation import train_test_split

#导入支持向量模型

from sklearn.svm import SVC

import matplotlib.pyplot as plt

x,y=make_classification(n_samples=300,n_features=2,n_redundant=0,n_informative=2,random_state=22,n_clusters_per_class=1,scale=100)

#c=y表示color为黄色

plt.scatter(x[:,0],x[:,1],c=y)

plt.show()

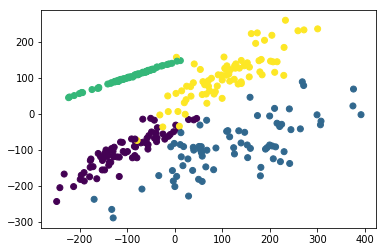
生成4类数据
# -*- coding: utf-8 -*-

"""

Created on Sun Jan  7 15:54:56 2018

@author: Administrator

"""

from sklearn import preprocessing

import numpy as np

#生成分类数据的分类器

from sklearn.datasets.samples_generator import make_classification

#自动生成训练数据和测试数据

from sklearn.cross_validation import train_test_split

#导入支持向量模型

from sklearn.svm import SVC

import matplotlib.pyplot as plt

#n_classes=4生成4类数据

x,y=make_classification(n_classes=4,n_samples=300,n_features=2,n_redundant=0,n_informative=2,random_state=22,n_clusters_per_class=1,scale=100)

#c=y表示color为黄色

plt.scatter(x[:,0],x[:,1],c=y)

plt.show()
# -*- coding: utf-8 -*-

"""

Created on Sun Jan  7 16:51:38 2018

@author: Administrator

"""

import matplotlib.pyplot as plt

from sklearn.datasets import make_classification

from sklearn.datasets import make_blobs

from sklearn.datasets import make_gaussian_quantiles

from sklearn.datasets import make_hastie_10_2

plt.figure(figsize=(8, 8))

plt.subplots_adjust(bottom=.05, top=.9, left=.05, right=.95)

plt.subplot(421)

plt.title("One informative feature, one cluster per class", fontsize='small')

X1, Y1 = make_classification(n_samples=1000,n_features=2, n_redundant=0, n_informative=1,

                             n_clusters_per_class=1)

plt.scatter(X1[:, 0], X1[:, 1], marker='o', c=Y1)

plt.subplot(422)

plt.title("Two informative features, one cluster per class", fontsize='small')

X1, Y1 = make_classification(n_samples=1000,n_features=2, n_redundant=0, n_informative=2,

                             n_clusters_per_class=1)

plt.scatter(X1[:, 0], X1[:, 1], marker='o', c=Y1)

plt.subplot(423)

plt.title("Two informative features, two clusters per class", fontsize='small')

X2, Y2 = make_classification(n_samples=1000,n_features=2, n_redundant=0, n_informative=2)

plt.scatter(X2[:, 0], X2[:, 1], marker='o', c=Y2)

plt.subplot(424)

plt.title("Multi-class, two informative features, one cluster",

          fontsize='small')

X1, Y1 = make_classification(n_samples=1000,n_features=2, n_redundant=0, n_informative=2,

                             n_clusters_per_class=1, n_classes=3)

plt.scatter(X1[:, 0], X1[:, 1], marker='o', c=Y1)

plt.subplot(425)

plt.title("Three blobs", fontsize='small')

X1, Y1 = make_blobs(n_samples=1000,n_features=2, centers=3)

plt.scatter(X1[:, 0], X1[:, 1], marker='o', c=Y1)

plt.subplot(426)

plt.title("Gaussian divided into four quantiles", fontsize='small')

X1, Y1 = make_gaussian_quantiles(n_samples=1000,n_features=2, n_classes=4)

plt.scatter(X1[:, 0], X1[:, 1], marker='o', c=Y1)

plt.subplot(427)

plt.title("hastie data ", fontsize='small')

X1, Y1 = make_hastie_10_2(n_samples=1000)

plt.scatter(X1[:, 0], X1[:, 1], marker='o', c=Y1)

plt.show()

# -*- coding: utf-8 -*-
"""
Created on Sun Jan 7 16:29:35 2018 @author: Administrator
""" import matplotlib.pyplot as plt from sklearn.datasets import make_classification
from sklearn.datasets import make_blobs
from sklearn.datasets import make_gaussian_quantiles
from sklearn.datasets import make_hastie_10_2 #画布的大小为长20cm高20cm
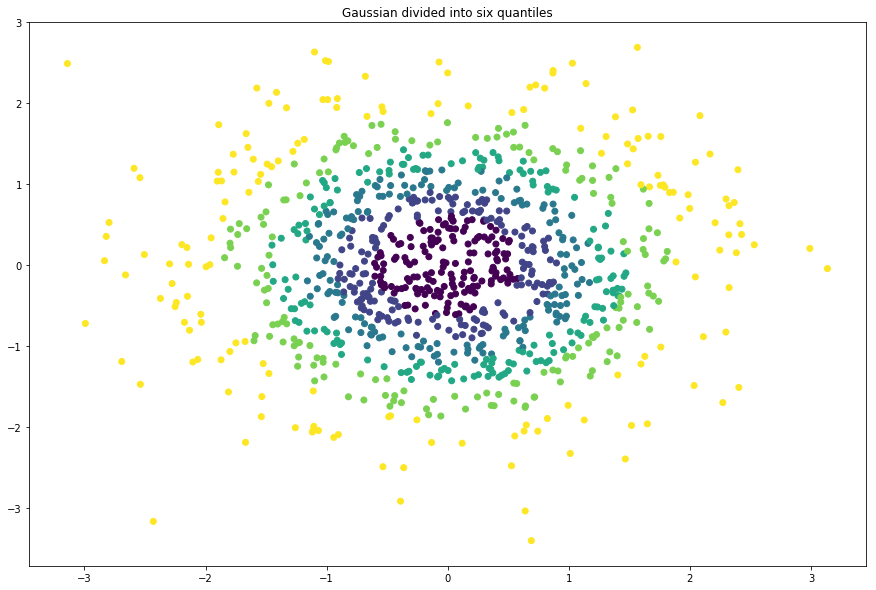
plt.figure(figsize=(15,10)) #标题,fontsize为标题字体大小
plt.title("Gaussian divided into six quantiles", fontsize='large')
X1, Y1 = make_gaussian_quantiles(n_samples=1000,n_features=2, n_classes=6) #绘制点,X1[:, 0]为点的x列表值, X1[:, 1]为点的y列表值, c=Y1表示颜色,c为color缩写
plt.scatter(X1[:, 0], X1[:, 1], marker='o', c=Y1)
# -*- coding: utf-8 -*-
"""
Created on Sun Jan 7 16:51:38 2018 @author: Administrator
""" from sklearn.datasets import make_circles
from sklearn.datasets import make_moons
import matplotlib.pyplot as plt
import numpy as np #画布的大小为长20cm高20cm
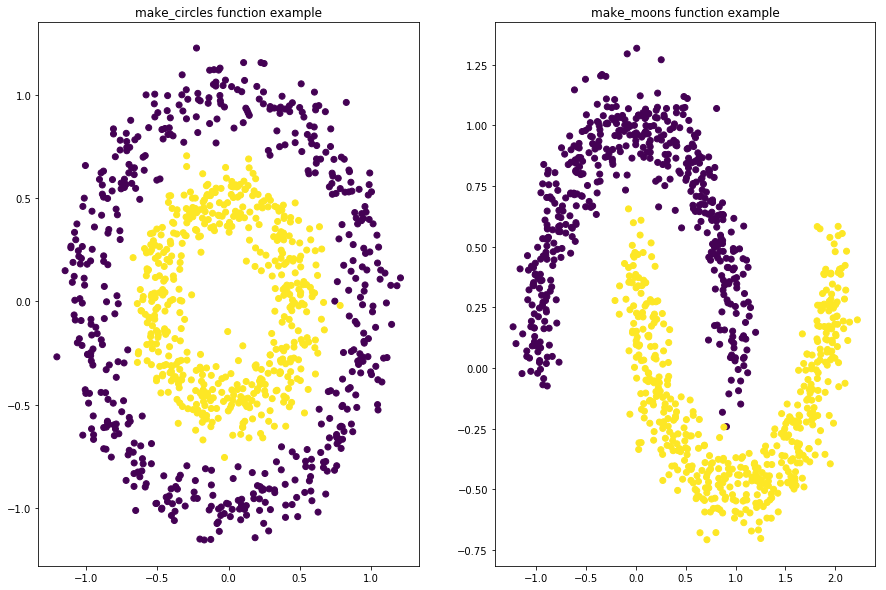
plt.figure(figsize=(15,10)) fig=plt.figure(1)
x1,y1=make_circles(n_samples=1000,factor=0.5,noise=0.1)
plt.subplot(121)
plt.title('make_circles function example')
plt.scatter(x1[:,0],x1[:,1],marker='o',c=y1) plt.subplot(122)
x1,y1=make_moons(n_samples=1000,noise=0.1)
plt.title('make_moons function example')
plt.scatter(x1[:,0],x1[:,1],marker='o',c=y1)
plt.show()
https://study.163.com/provider/400000000398149/index.htm?share=2&shareId=400000000398149( 欢迎关注博主主页,学习python视频资源,还有大量免费python经典文章)

sklearn6_生成分类数据的更多相关文章
- Python之机器学习-sklearn生成随机数据
sklearn-生成随机数据 import numpy as np import pandas as pd import matplotlib.pyplot as plt from matplotli ...
- 无限级分类及生成json数据
第一步,先去数据库查询类别数据,然后交给生成json数据的函数处理,代码如下: /*生成类别JSON数据*/ public function wirteJson(){ $dataInfo = \thi ...
- SAP QA32 做使用决策系统报错:分类数据的不一致性=>交易终止
SAP QA32 做使用决策系统报错:分类数据的不一致性=>交易终止 QA32,对如下检验批做处理,系统报错, 试图使用MSC3N去显示这个批次主数据,同样报错, 原因在于批次的分类数据产生后, ...
- flask实战-个人博客-数据库-生成虚拟数据 --
3.生成虚拟数据 为了方便编写程序前台和后台功能,我们在创建数据库模型后就编写生成虚拟数据的函数. 1)管理员 用于生成虚拟管理员信息的fake_admin()函数如下所示: personalBlog ...
- Enterprise Solution 生成实体数据访问接口与实现类型 Code Smith 6.5 模板文件下载
数据库表定义为SalesOrder,用LLBL Gen Pro生成的实体定义是SalesOrderEntity,再用Code Smith生成的数据读写接口是ISalesOrderManager,最后是 ...
- 改用C++生成自动化数据表
改用C++生成自动化数据表 前面的文章中,我们讨论了使用一个基于.NET的第三方程序库来从程序中来生成数据表.在我看来,这整个思路是非常有用的,例如为显示测试结果.我经常会自己在博客中尝试各种像这样的 ...
- SQL Server中公用表表达式 CTE 递归的生成帮助数据,以及递归的典型应用
本文出处:http://www.cnblogs.com/wy123/p/5960825.html 我们在做开发的时候,有时候会需要一些帮助数据,必须需要连续的数字,连续间隔的时间点,连续的季度日期等等 ...
- 公用表表达式(CTE)递归的生成帮助数据
本文的作者辛苦了,版权问题特声明本文出处:http://www.cnblogs.com/wy123/p/5960825.html 工作有时候会需要一些帮助数据,必须需要连续的数字,连续间隔的时间点,连 ...
- TreeView递归绑定无限分类数据
TreeView递归绑定无限分类数据 实现一个动态绑定,无限级分类数据时,需要将数据绑定到TreeView控件,分类表的结构是这样的: 字段 类型 Id int ParentId int Name N ...
随机推荐
- chrome浏览器插件 Octotree 让你浏览GitHub的时候像IDE 一样提供项目目录
GitHub 作为代码托管平台,竟然没有提供项目目录,方便用户在线快速浏览项目结构.所以,在线分析项目源码就会变得很繁琐,必须一层一层点击,然后再一次一次地向上返回.要知道,本来 GitHub 网站在 ...
- liunx总结题
一. 简述什么是Linux内核,这个学期学了Linux课程的哪些内容.(10分) Linux内核诞生于1991年,由芬兰学生Linus Torvalds(林纳斯.托瓦斯)发起,那 ...
- 并发系列(一)-----synchronized关键字
一 简介 说到并发不得不提的synchronized,synchronized关键字是元老级别的角色.在Java SE 1.6之前synchronized被称为是重量,在1.6之后对同步进行了一系列的 ...
- Bootstrap 样式设计 栅格系统
.col-xs- 超小屏幕 手机 (<768px) .col-sm- 小屏幕 平板 (≥768px) .col-md- 中等屏幕 桌面显示器 (≥992px) .col-lg- 大屏幕 大桌面显 ...
- PAT甲题题解-1024. Palindromic Number (25)-大数运算
大数据加法给一个数num和最大迭代数k每次num=num+num的倒序,判断此时的num是否是回文数字,是则输出此时的数字和迭代次数如果k次结束还没找到回文数字,输出此时的数字和k 如果num一开始是 ...
- 四则运算 SPEC 20160911
本文档随时可能修改,并且没有另行通知. 请确保每一次在开始修改你的代码前,读标题中的日期,如果晚于你上次阅读, 请重读一次. 教师节你去探望初中数学老师,她感叹你当年真是个优秀学生啊,从来不报怨作 业 ...
- 20135202闫佳歆--week4 系统调用(上)--学习笔记
此为个人笔记存档 week 4 系统调用(上) 一.用户态.内核态和中断处理过程 用户通过库函数与系统调用联系起来. 1.内核态 在高执行级别下,代码可以执行特权指令,访问任意的物理地址. 2.用户态 ...
- 2013337朱荟潼 Linux第四章读书笔记——进程调度
第4章 进程调度 0. 总结 调度:调度是一个平衡的过程.一方面,它要保证各个运行的进程能够最大限度的使用CP:另一方面,保证各个进程能公平的使用CPU. 调度功能:决定哪个进程运行以及进程运行多长时 ...
- spring整合redis(jedis)
真是一步一个坑阿,学点新技术,这么难,这个异常: java.lang.IllegalStateException: Could not load TestContextBootstrapper [nu ...
- 团队伊始——DreamCatcher
我们的团队,队名是DreamCatcher,中文意思是追梦人,它是一首歌曲,所属专辑是<新世纪的曙光>. 这是一首很好听的歌曲,里面有一句歌词是: I'm a dream catcher ...