PCA和白化练习之处理二维数据
在很多情况下,我们要处理的数据的维度很高,需要提取主要的特征进行分析这就是PCA(主成分分析),白化是为了减少各个特征之间的冗余,因为在许多自然数据中,各个特征之间往往存在着一种关联,为了减少特征之间的关联,需要用到所谓的白化(whitening).
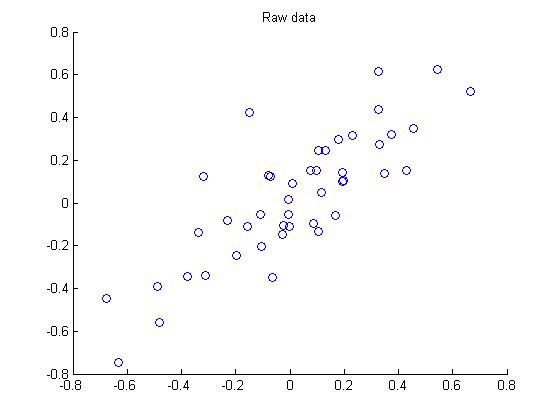
首先下载数据pcaData.rar,下面要对这里面包含的45个2维样本点进行PAC和白化处理,数据中每一列代表一个样本点。
第一步 画出原始数据:
第二步:执行PCA,找到数据变化最大的方向:

第三步:将原始数据投射到上面找的两个方向上:

第四步:降维,此例中把数据由2维降维到1维,画出降维后的数据:

第五步:PCA白化处理:

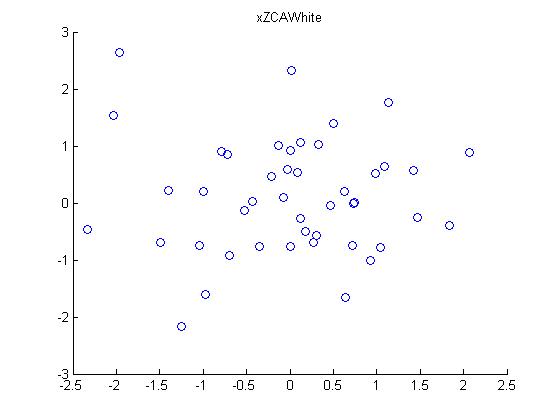
第六步:ZCA白化处理:
下面是程序matlab源代码:
 close all;clear all;clc;

 %%================================================================

 %% Step : Load data

 %  We have provided the code to load data from pcaData.txt into x.

 %  x is a  *  matrix, where the kth column x(:,k) corresponds to

 %  the kth data point.Here we provide the code to load natural image data into x.

 %  You do not need to change the code below.

 x = load('pcaData.txt','-ascii');

 figure();

 scatter(x(, :), x(, :));

 title('Raw data');

 %%================================================================

 %% Step 1a: Implement PCA to obtain U

 %  Implement PCA to obtain the rotation matrix U, which is the eigenbasis

 %  sigma.

 % -------------------- YOUR CODE HERE --------------------

 u = zeros(size(x, )); % You need to compute this

 sigma = x * x'/ size(x, 2);

 [u,S,V] = svd(sigma);

 % --------------------------------------------------------

 hold on

 plot([ u(,)], [ u(,)]);

 plot([ u(,)], [ u(,)]);

 scatter(x(, :), x(, :));

 hold off

 %%================================================================

 %% Step 1b: Compute xRot, the projection on to the eigenbasis

 %  Now, compute xRot by projecting the data on to the basis defined

 %  by U. Visualize the points by performing a scatter plot.

 % -------------------- YOUR CODE HERE --------------------

 xRot = zeros(size(x)); % You need to compute this

 xRot = u' * x;

 % --------------------------------------------------------

 % Visualise the covariance matrix. You should see a line across the

 % diagonal against a blue background.

 figure();

 scatter(xRot(, :), xRot(, :));

 title('xRot');

 %%================================================================

 %% Step : Reduce the number of dimensions from  to .

 %  Compute xRot again (this time projecting to  dimension).

 %  Then, compute xHat by projecting the xRot back onto the original axes

 %  to see the effect of dimension reduction

 % -------------------- YOUR CODE HERE --------------------

 k = ; % Use k =  and project the data onto the first eigenbasis

 xHat = zeros(size(x)); % You need to compute this

 z = u(:, :k)' * x;

 xHat = u(:,:k) * z;

 % --------------------------------------------------------

 figure();

 scatter(xHat(, :), xHat(, :));

 title('xHat');

 %%================================================================

 %% Step : PCA Whitening

 %  Complute xPCAWhite and plot the results.

 epsilon = 1e-;

 % -------------------- YOUR CODE HERE --------------------

 xPCAWhite = zeros(size(x)); % You need to compute this

 xPCAWhite = diag( ./ sqrt(diag(S) + epsilon)) * xRot;

 % --------------------------------------------------------

 figure();

 scatter(xPCAWhite(, :), xPCAWhite(, :));

 title('xPCAWhite');

 %%================================================================

 %% Step : ZCA Whitening

 %  Complute xZCAWhite and plot the results.

 % -------------------- YOUR CODE HERE --------------------

 xZCAWhite = zeros(size(x)); % You need to compute this

 xZCAWhite = u * xPCAWhite;

 % --------------------------------------------------------

 figure();

 scatter(xZCAWhite(, :), xZCAWhite(, :));

 title('xZCAWhite');

 %% Congratulations! When you have reached this point, you are done!

 %  You can now move onto the next PCA exercise. :)
PCA和白化练习之处理二维数据的更多相关文章
- PCA 实例演示二维数据降成1维
import numpy as np # 将二维数据降成1维 num = [(2.5, 2.4), (0.5, 0.7), (2.2, 2.9), (1.9, 2.2), (3.1, 3.0), (2 ...
- TensorflowTutorial_二维数据构造简单CNN
使用二维数据构造简单卷积神经网络 觉得有用的话,欢迎一起讨论相互学习~Follow Me 图像和一些时序数据集都可以用二维数据的形式表现,我们此次使用随机分布的二位数据构造一个简单的CNN-网络卷积- ...
- PHP二维数据排序,二维数据模糊查询
一.因为项目中的一个报表需要合并三个表的数据,所以分表查询再合并数据,利用PHP数组函数进行排序,搜索.三表合并后的数组结构如下: Array ( [0] => Array ( [history ...
- 妙用Excel数据透视表和透视图向导,将二维数据转换为一维数据
项目中,每年都会有各种经销商的各种产品目标数据导入,经销商和产品过多,手工操作过于单调和复杂.那有没有一种方式可以将复杂的二维数据转换为一维数据呢? 有,强大的Excel就支持此功能. 常用Excel ...
- 【Excle数据透视】二维数据如何创建数据透视表
二维数据在创建数据透视表的时候,可能会给你带来一些麻烦,没法创建,会丢失维度,那怎么办呢? 解决办法:使用数据透视表和数据透视图向导即可创建 具体操作如下: 按下[Alt+D+P],出现如下界面 选择 ...
- php 二维数据排序 排行榜
php 二维数据排序 排行榜 $rateCount = array(); foreach($groupUsers as $user){ $rateCount[] = $user['rate']; } ...
- python练习 - 系统基本信息获取(sys标准库)+ 二维数据表格输出(tabulate库)
系统基本信息获取 描述 获取系统的递归深度.当前执行文件路径.系统最大UNICODE编码值等3个信息,并打印输出. ...
- 深度学习实践-物体检测-faster-RCNN(原理和部分代码说明) 1.tf.image.resize_and_crop(根据比例取出特征层,进行维度变化) 2.tf.slice(数据切片) 3.x.argsort()(对数据进行排列,返回索引值) 4.np.empty(生成空矩阵) 5.np.meshgrid(生成二维数据) 6.np.where(符合条件的索引) 7.tf.gather取值
1. tf.image.resize_and_crop(net, bbox, 256, [14, 14], name) # 根据bbox的y1,x1,y2,x2获得net中的位置,将其转换为14*1 ...
- php对二维数据排序
对于一维数组排序比较简单,像使用sort(),asort(),arsort()等函数进行排序,但是对于二维数组比较麻烦,所有借鉴网上的总结了一下 // 对二维数组进行指定key排序 $arr 二维数组 ...
随机推荐
- 《Linux内核分析与实现》 第四周 读书笔记
第五章 系统调用 20135307 张嘉琪 5.1 与内核通信 系统调用在用户空间进程和硬件设备之间添加了一个中间层,该层主要作用有三个: 它为用户空间提供了一种硬件的抽象接口 系统调用保证了系统的稳 ...
- 《Linux内核设计与实现》Chapter 5 读书笔记
<Linux内核设计与实现>Chapter 5 读书笔记 在现代操作系统中,内核提供了用户进程与内核进行交互的一组接口,这些接口的作用是: 使应用程序受限地访问硬件设备 提供创建新进程与已 ...
- 常用校验码(奇偶校验码、海明校验码、CRC校验码)
一.奇偶校验码 二.海明校验码 三.CRC校验码 计算机系统运行时,各个部之间要进行数据交换.交换的过程中,会有发生误码的可能(即0变成1或1变成0),由于计算机的储存是通过二进制代码来实现的的, ...
- 2017-2018 第一学期201623班《程序设计与数据结构》-第7&8周作业问题总结
一.作业内容 第7周作业 http://www.cnblogs.com/rocedu/p/7484252.html#WEEK07 第8周作业 http://www.cnblogs.com/rocedu ...
- 读C#程序
阅读下面程序,请回答如下问题: 问题1:这个程序要找的是符合什么条件的数? 问题2:这样的数存在么?符合这一条件的最小的数是什么? 问题3:在电脑上运行这一程序,你估计多长时间才能输出第一个结果?时间 ...
- Python爬虫:如何爬取分页数据?
上一篇文章<Python爬虫:爬取人人都是产品经理的数据>中说了爬取单页数据的方法,这篇文章详细解释如何爬取多页数据. 爬取对象: 有融网理财项目列表页[履约中]状态下的前10页数据,地址 ...
- [转帖] Linux 下面 Find的使用...--- 自己不会用 find
13个实用的Linux find命令示例 原始博客地址: https://www.cnblogs.com/chenshoubiao/p/4838089.html 之前只会用locate 基础 ...
- js & option keycode
js & option keycode js get option keycode https://keycode.info/ option https://github.com/wesbos ...
- MySQL:日期类型
1. datetime(年月日时分秒) 格式:‘YYY-MM-DD HH:MM:SS’. 占用:8字节 范围:1000-01-01 00:00:00 到 9999-12-31 23:59:59. ti ...
- 一本通1640C Looooops
1640:C Looooops 时间限制: 1000 ms 内存限制: 524288 KB [题目描述] 原题来自:CTU Open 2004 对于 C 语言的 for (variab ...