MiniProfiler性能监控分析工具在.NET项目中的使用
MiniProfiler是一款针对.NET, Ruby, Go and Node.js的性能分析的轻量级程序。可以对一个页面本身,及该页面通过直接引用、Ajax、Iframe形式访问的其它页面进行监控,监控内容包括数据库内容,并可以显示数据库访问的SQL(支持EF、EF CodeFirst等 )。并且以很友好的方式展现在页面上。
MiniProfiler官网:http://miniprofiler.com/
MiniProfiler的一个特别有用的功能是它与数据库框架的集成。除了.NET原生的 DbConnection类,MiniProfiler还内置了对实体框架(Entity Framework)以及LINQ to SQL、RavenDb和MongoDB的支持。任何执行的Step都会包括当时查询的次数和所花费的时间。为了检测常见的错误,如N+1反模式,profiler将检测仅有参数值存在差异的多个查询。
MiniProfiler是以Apache License V2.0协议发布的,你可以在NuGet找到。
过去一直使用Sqlserver Profiler,但是发现实在是太痛苦了,你不得不进行新建、过滤、清除、关闭等操作,而且过滤筛选往往比较难以控制。后来发现MiniProfiler工具非常好用。
同类监控工具有NanoProfiler,下载地址:https://github.com/ef-labs/nanoprofiler/issues/1
Demo开发环境
- Win10
- VS2013
准备工作
新建MVC项目WebAppEF,使用Northwind数据库。
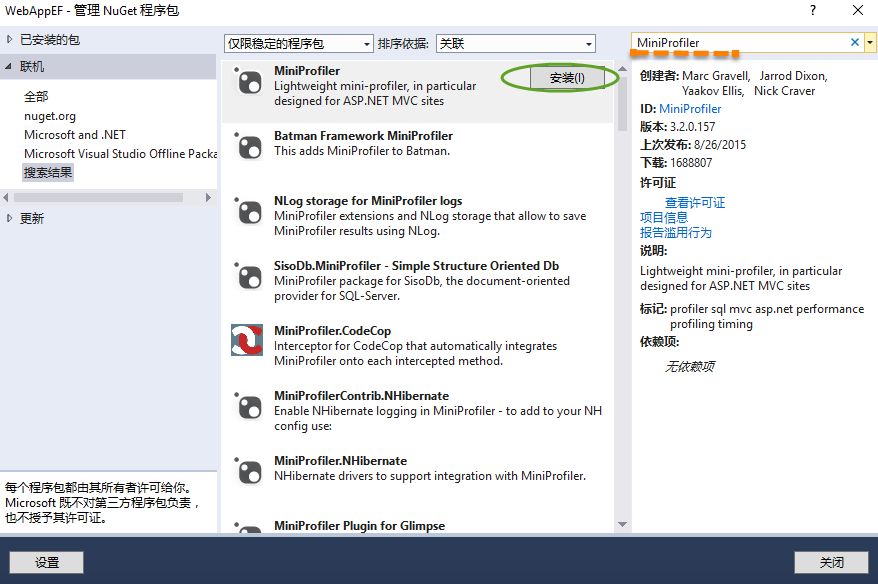
1、先安装MiniProfiler
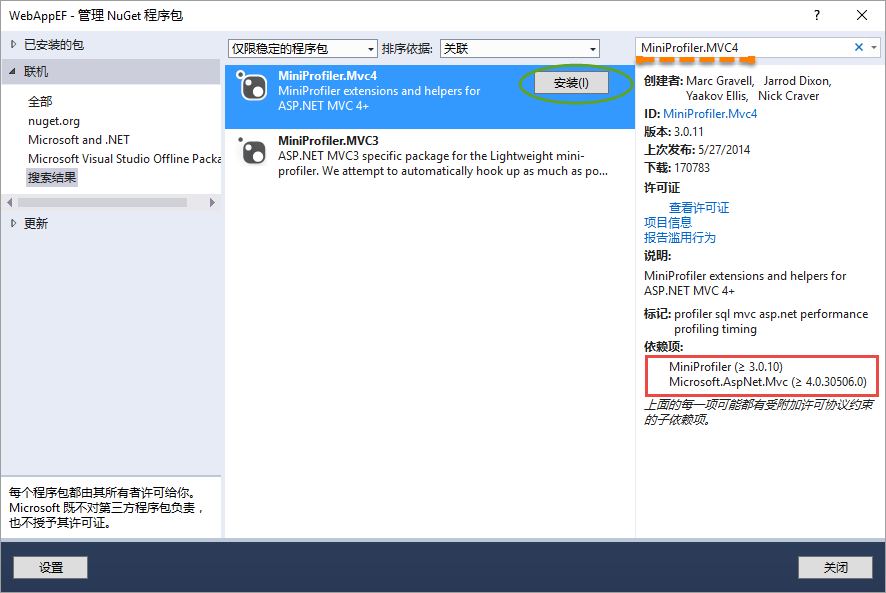
2、安装MiniProfiler.MVC4
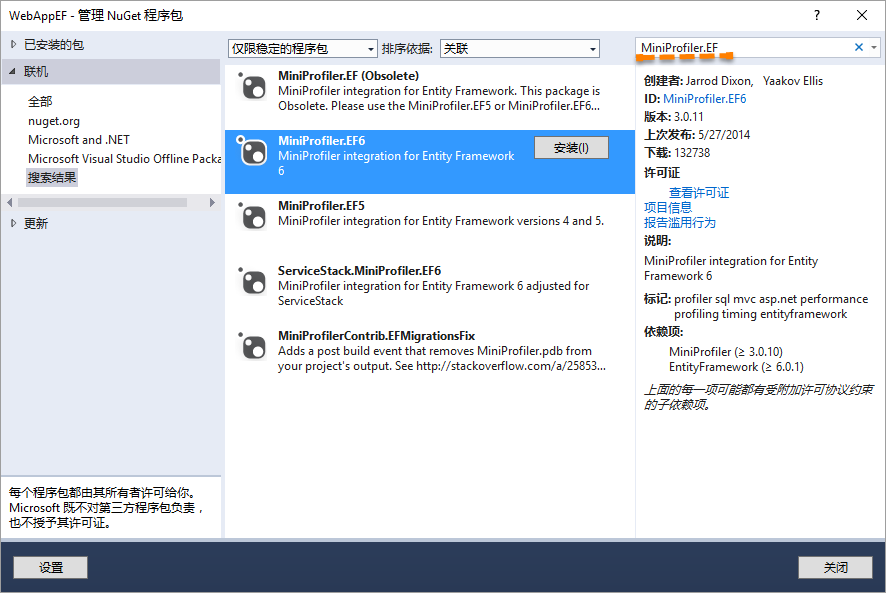
3、安装MiniProfiler.EF
4、修改Global.asax文件
我这里只需要在开发环境使用SQL性能监控,所以使用了#if DEBUG,因为生产环境,我们一般是采用release模式。同时,MiniProfiler还支持授权,这里不做介绍。
using StackExchange.Profiling;

using StackExchange.Profiling.EntityFramework6;

using System;

using System.Web.Mvc;

using System.Web.Optimization;

using System.Web.Routing;

namespace WebAppEF

{

    publicclassMvcApplication: System.Web.HttpApplication

    {

        protectedvoid Application_Start()

        {#

            if DEBUG

            MiniProfilerEF6.Initialize();#

            endif

            AreaRegistration.RegisterAllAreas();

            FilterConfig.RegisterGlobalFilters(GlobalFilters.Filters);

            RouteConfig.RegisterRoutes(RouteTable.Routes);

            BundleConfig.RegisterBundles(BundleTable.Bundles);

        }

        protectedvoid Application_BeginRequest(Object source, EventArgs e)

        {#

            if DEBUG

            MiniProfiler.Start();#

            endif

        }

        protectedvoid Application_EndRequest()

        {#

            if DEBUG

            MiniProfiler.Stop();#

            endif

        }

    }

}
5、修改布局页(_Layout)
@using StackExchange.Profiling;

<head>

 ..

</head>

<body>

  ...

  @MiniProfiler.RenderIncludes()

</body>
6、修改配置文件Web.config
<system.webServer>

    <handlers>

        <add name="MiniProfiler" path="mini-profiler-resources/*" verb="*" type="System.Web.Routing.UrlRoutingModule" resourceType="Unspecified" preCondition="integratedMode" />

    </handlers>

</system.webServer>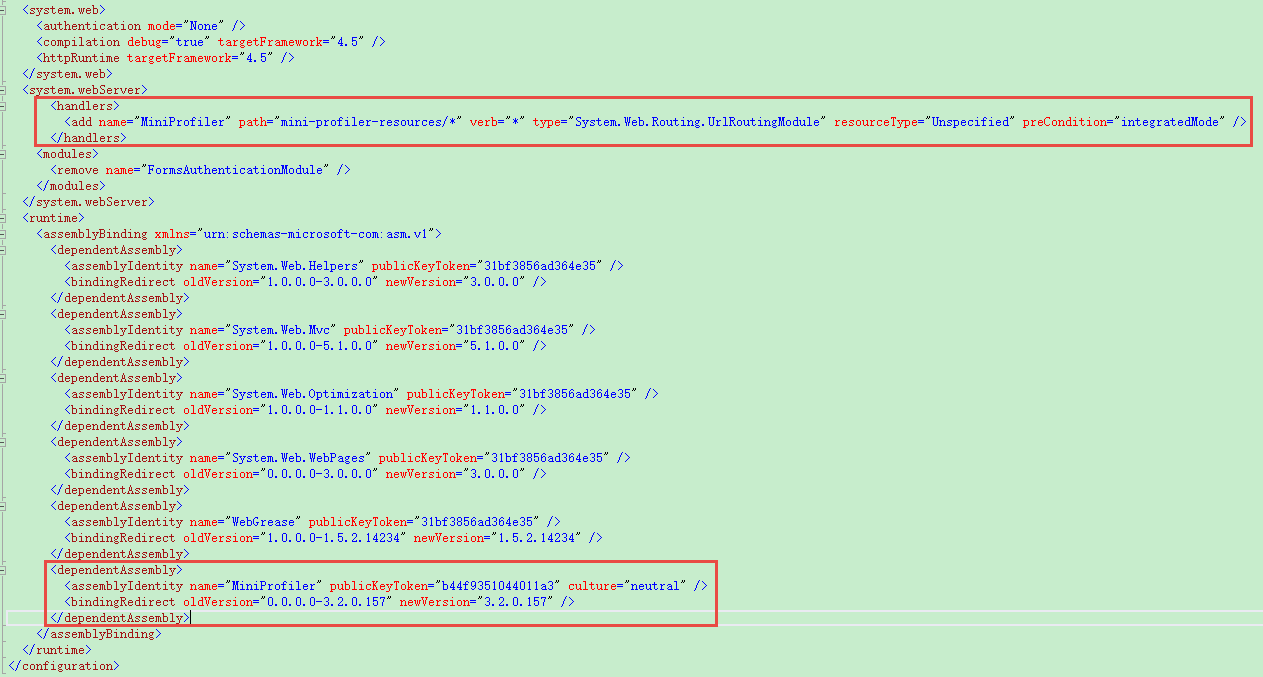
7、添加控制器测试代码
public ActionResult Index()
{
// create the entity object
using(NorthwindEntities mobjentity = new NorthwindEntities())
{
ViewBag.SelectCustomer = mobjentity.Customers.Select(x => x.City == "Delhi").ToList();
}
var profiler = MiniProfiler.Current;
using(profiler.Step("查询Customers的数据"))
{
using(NorthwindEntities entity = new NorthwindEntities())
{
ViewBag.data = entity.Customers.ToList();
}
}
return View();
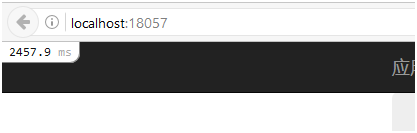
}8、按F5调试运行
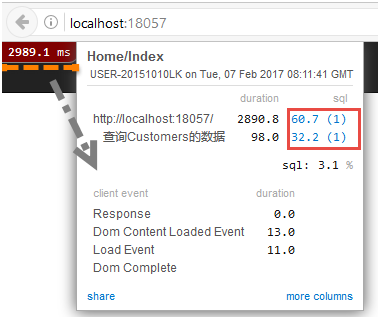
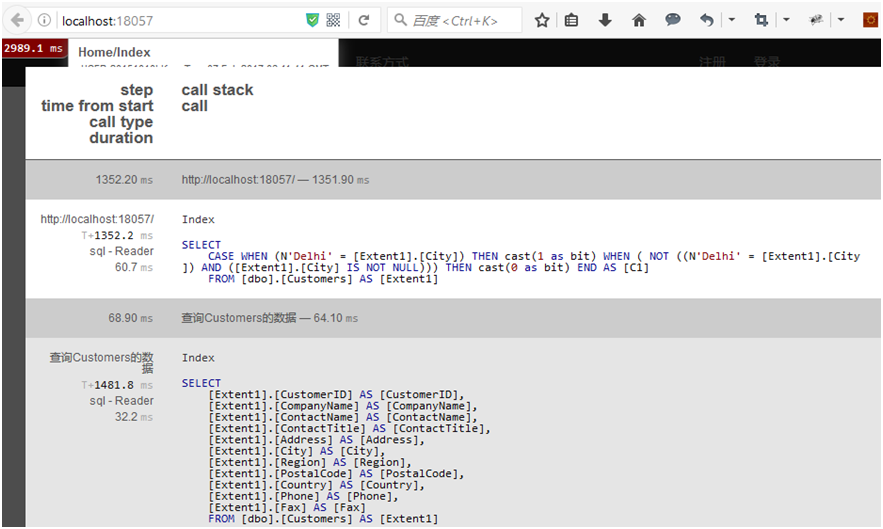
说明:标记为duplicate的部分,代表在一次请求当中,重复执行了查询,可以进行优化。通过Step可以对独立的sql块进行标记。
常见错误
1、The Entity Framework was already using a DbConfiguration instance before an attempt was made to add an 'Loaded' event handler. 'Loaded' event handlers can only be added as part of application start up before the Entity Framework is used. See http://go.microsoft.com/fwlink/?LinkId=260883 for more information.
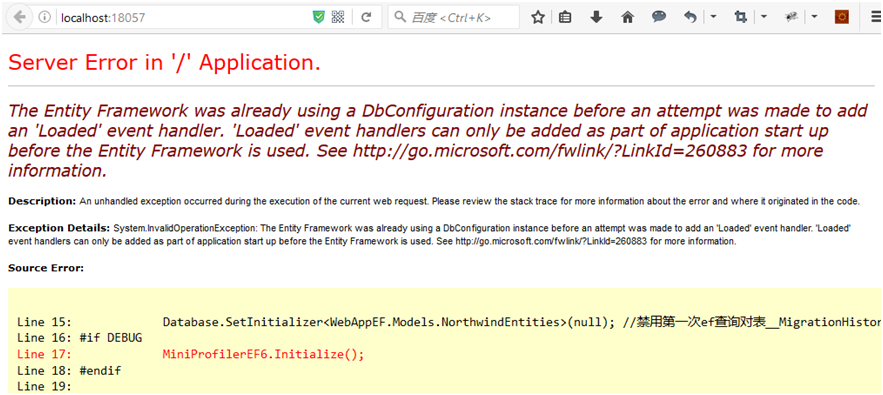
分析:错误提示的大意是在试图为DbConfiguration 实例加Loaded事件之前已经在其它地方使用了这个实例了
解决方案:把MiniProfiler.EF6.Initialize()在放在Database.SetInitializer<WebAppEF.Models.NorthwindEntities>(null); 之前。
2、Could not load file or assembly 'MiniProfiler, Version=3.0.11.0, Culture=neutral, PublicKeyToken=b44f9351044011a3' or one of its dependencies. The located assembly's manifest definition does not match the assembly reference. (Exception from HRESULT: 0x80131040)
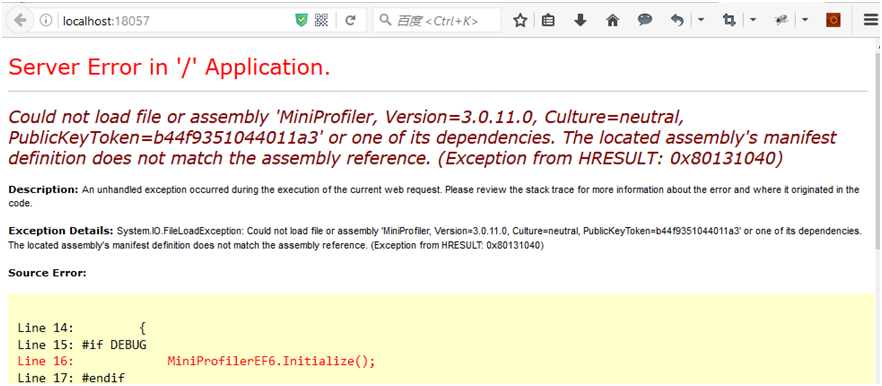
分析:找不到MiniProfiler程序集或者它的依赖项。程序集定义和引用不匹配。
解决方案:查看Web.config中是否存在如下配置节点
<dependentAssembly>

    <assemblyIdentityname="MiniProfiler" publicKeyToken="b44f9351044011a3" culture="neutral" />

    <bindingRedirectoldVersion="0.0.0.0-3.2.0.157" newVersion="3.2.0.157" />

</dependentAssembly>
如果不存在则添加,如果存在,则检查MiniProfiler版本号和packages.config中的版本号是否一致,如果不一致就要对版本号进行修改。
来源:https://www.cnblogs.com/nepulgh/p/10766235.html
MiniProfiler性能监控分析工具在.NET项目中的使用的更多相关文章
- 开源性能监控分析工具glowroot
最近在做java性能瓶颈定位分析工具的研究,发现glowroot工具是一款相当不错的APM工具(Wonderful tool),架构简洁,部署简单,上手容易. 经过亲身搭建体验,总结了产品的架构,工具 ...
- Zynga 开源其服务器性能监控分析工具 zPerfmon
流年不利的社交游戏服务商Zynga近日在官方博客宣布开源zPerfmon——该工具负责监控Zynga数以千计的社交游戏服务器.zPerfmon的源代码目前已经上传至Github. 包括Facebook ...
- JDK自带的监控分析工具JConsole
非常多开发人员认为自己懂Java编程.事实是大多数开发人员都仅仅领会到了Java平台的皮毛.所学也仅仅够应付工作. 作者将深度挖掘Java平台的核心功能.揭示一些鲜为人知的事实.帮助您解决最棘手的编程 ...
- Linux性能监控分析命令(四)—top命令介绍
性能监控分析的命令包括如下: 1.vmstat 2.sar 3.iostat 4.top 5.free 6.uptime 7.netstat 8.ps 9.strace 10.lsof ======= ...
- UAVStack JVM监控分析工具:图形化展示采集及分析监控数据
摘要:UAVStack推出的JVM监控分析工具提供基于页面的展现方式,以图形化的方式展示采集到的监控数据:同时提供JVM基本参数获取.内存dump.线程分析.内存分配采样和热点方法分析等功能. 引言 ...
- Web服务器性能监控分析与优化
Web服务器性能监控分析与优化 http://www.docin.com/p-759040698.html
- Linux性能监控分析命令(五)—free命令介绍
性能监控分析的命令包括如下:1.vmstat2.sar3.iostat4.top5.free6.uptime7.netstat8.ps9.strace10.lsof 命令介绍:free命令是监控Lin ...
- Linux性能监控分析命令(三)—iostat命令介绍
性能监控分析的命令包括如下: 1.vmstat 2.sar 3.iostat 4.top 5.free 6.uptime 7.netstat 8.ps 9.strace 10.lsof 命令介绍: i ...
- Linux性能监控分析命令(二)—sar命令介绍
性能监控分析的命令包括如下: 1.vmstat 2.sar 3.iostat 4.top 5.free 6.uptime 7.netstat 8.ps 9.strace 10.lsof ======= ...
随机推荐
- Java-GUI基础(一)
简介 首先,Java的学习就是不断学习一个个包与类的过程,对于GUI部分有两个核心包:java.awt与javax.swing, 这两个包可以说是涵盖了java的GUI部分所有的类(和他们的方法). ...
- 直播平台源码搭建教程:微信小程序中的直播如何去掉水印
直播平台源码搭建教程:微信小程序中的直播如何去掉水印 本文与大家分享一下直播平台源码搭建教程,如何去掉直播视频的水印 var services = require('../../lib/service ...
- win10免费通用永久激活秘钥分享 win1020H2正式版序列号推荐
win10最新永久激活密钥神key如下: win10免费密钥 NW06D-722C0-5X6A1-MQ83B-2ER3D win10免费密钥 NP3KM-NQZD6-X406E-1QPKR-4VRZD ...
- 8.字典dict和解构-封装
字典dict 与列表的区别:列表可以存储大量的数据类型,但是只能按照顺序存储,数据与数据之间关联性不强 字典(dict)是python中唯⼀的⼀个映射类型.他是以{ }括起来的键值对组成. 字典中的键 ...
- W3C中不同标准的含义
学习CSS/HTML的过程中,当出现释义冲突时,W3C(万维网联盟)官网所陈列的技术标准是最核心的判断参考.但是新手在查阅W3C标准索引页面时,会发现同一个属性或者模型会出现多个不同的阶段规范展示结果 ...
- linux 内核 同步原理
中断分为同步中断和异步中断. 同步中断是由CPU控制单元产生的,"同步"是指只有在一条指令执行完毕后,CPU才会发出中断,比如系统调用 异步中断是由其他硬件设备依照CPU时钟信号产 ...
- linux nf_conntrack 连接跟踪机制 3-hook
conntrack hook函数分析 enum nf_ip_hook_priorities { NF_IP_PRI_FIRST = INT_MIN, NF_IP_PRI_CONNTRACK_DEFRA ...
- Dubbo 服务导出-Version2.7.5
1.源码分析 1.1分析服务导出入口 当容器为spring是dubbo会为容器注册两个监听器:DubboLifecycleComponentApplicationListener和DubboBoots ...
- deepin V20 简易入门指南
deepin V20 入坑指南 系统安装 入坑第一步自然是先安装系统了,deepin的安装方式很简单只需要一个U盘即可,在官网下载好安装镜像文件,使用官方的启动盘制作工具,开机时选择从U盘启动即可,安 ...
- php 与 docker php-fpm 共存问题
需求: 本地一个 php7 的 php-fpm,现在需要运行 php5.2版本的程序, 服务器安装的 nginx 解析域名,碰见 php 文件交给 php5的 php-fpm; 注意: fastcgi ...