WPF 动态模拟CPU 使用率曲线图
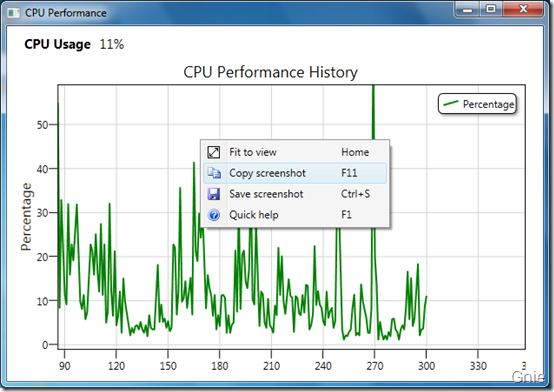
在工作中经常会遇到需要将一组数据绘制成曲线图的情况,最简单的方法是将数据导入Excel,然后使用绘图功能手动生成曲线图。但是如果基础数据频繁更改,则手动创建图形可能会变得枯燥乏味。本篇将利用DynamicDataDisplay 在WPF 中动态模拟CPU 使用率图表,实现动态生成曲线图。
新建项目将DynamicDataDisplay.dll 加载到References 中,打开MainWindow.xaml 添加命名空间xmlns:d3="http://research.microsoft.com/DynamicDataDisplay/1.0"。通过<d3:ChartPlotter> 创建一个图表框架,在其中添加两条整型坐标轴,X轴:<d3:HorizontalIntegerAxis>,Y轴:<d3:VerticalIntegerAxis>。<d3:Header> 用来设置图表名称,<d3:VerticalAxisTitle> 用来设置Y轴名称。
<Window x:Class="WpfPerformance.MainWindow"

        xmlns="http://schemas.microsoft.com/winfx/2006/xaml/presentation"

        xmlns:x="http://schemas.microsoft.com/winfx/2006/xaml"

        xmlns:d3="http://research.microsoft.com/DynamicDataDisplay/1.0"

        Title="CPU Performance" Loaded="Window_Loaded" Height="350" Width="525">

    <Grid>

        <Grid.RowDefinitions>

            <RowDefinition Height="Auto"/>

            <RowDefinition Height="*"/>

        </Grid.RowDefinitions>

        <StackPanel Orientation="Horizontal">

            <TextBlock Text="CPU Usage" Margin="20,10,0,0"

                       FontSize="15" FontWeight="Bold"/>

            <TextBlock x:Name="cpuUsageText" Margin="10,10,0,0"

                       FontSize="15"/>

        </StackPanel>

        <d3:ChartPlotter x:Name="plotter" Margin="10,10,20,10" Grid.Row="1">

            <d3:ChartPlotter.VerticalAxis>

                <d3:VerticalIntegerAxis />

            </d3:ChartPlotter.VerticalAxis>

            <d3:ChartPlotter.HorizontalAxis>

                <d3:HorizontalIntegerAxis />

            </d3:ChartPlotter.HorizontalAxis>

            <d3:Header Content="CPU Performance History"/>

            <d3:VerticalAxisTitle Content="Percentage"/>

        </d3:ChartPlotter>

    </Grid>

</Window>

接下来工作需要通过C#每秒获取一次CPU使用率,并将这些数据生成坐标点(Point)绘制在图表中。 以下是MainWindow.xaml.cs 部分的代码内容。
using System;

using System.Diagnostics;

using System.Windows;

using System.Windows.Media;

using System.Windows.Threading;

using Microsoft.Research.DynamicDataDisplay;

using Microsoft.Research.DynamicDataDisplay.DataSources;

namespace WpfPerformance

{

    public partial class MainWindow : Window

    {

        private ObservableDataSource<Point> dataSource = new ObservableDataSource<Point>();

        private PerformanceCounter cpuPerformance = new PerformanceCounter();

        private DispatcherTimer timer = new DispatcherTimer();

        private int i = 0;

        public MainWindow()

        {

            InitializeComponent();

        }

        private void AnimatedPlot(object sender, EventArgs e)

        {

            cpuPerformance.CategoryName = "Processor";

            cpuPerformance.CounterName = "% Processor Time";

            cpuPerformance.InstanceName = "_Total";

            double x = i;

            double y = cpuPerformance.NextValue();

            Point point = new Point(x, y);

            dataSource.AppendAsync(base.Dispatcher, point);

            cpuUsageText.Text = String.Format("{0:0}%", y);

            i++;

        }

        private void Window_Loaded(object sender, RoutedEventArgs e)

        {

            plotter.AddLineGraph(dataSource, Colors.Green, 2, "Percentage");

            timer.Interval = TimeSpan.FromSeconds(1);

            timer.Tick += new EventHandler(AnimatedPlot);

            timer.IsEnabled = true;

            plotter.Viewport.FitToView();

        }

    }

}
通过ObservableDataSource<Point> 动态存储图表坐标点,PerformanceCounter 获取CPU使用率数值,DispatcherTimer 计时器在规定间隔进行取数操作,整型i 作为CPU使用率坐标点的X轴数值。
private ObservableDataSource<Point> dataSource = new ObservableDataSource<Point>();

private PerformanceCounter cpuPerformance = new PerformanceCounter();

private DispatcherTimer timer = new DispatcherTimer();

private int i = 0;
AnimatedPlot 事件用于构造坐标点,通过设置cpuPerformance 相关参数,并使用NextValue() 方法获取当前CPU使用率数据作为Y值,整型i 作为X值。将X、Y值构造为坐标点(Point),并通过异步方式存储在dataSource 中。
private void AnimatedPlot(object sender, EventArgs e)

{

    cpuPerformance.CategoryName = "Processor";

    cpuPerformance.CounterName = "% Processor Time";

    cpuPerformance.InstanceName = "_Total";

    double x = i;

    double y = cpuPerformance.NextValue();

    Point point = new Point(x, y);

    dataSource.AppendAsync(base.Dispatcher, point);

    cpuUsageText.Text = String.Format("{0:0}%", y);

    i++;

}
最后通过Window_Loaded 将事件加载到<Window> 中,AddLineGraph 方法将dataSource 中的坐标点绘制到图表中,曲线颜色定义为绿色,粗细设置为2,曲线名称为"Percentage"。设置计时器间隔为1秒,连续执行AnimatedPlot 事件实时绘制新坐标点。
private void Window_Loaded(object sender, RoutedEventArgs e)

{

    plotter.AddLineGraph(dataSource, Colors.Green, 2, "Percentage");

    timer.Interval = TimeSpan.FromSeconds(1);

    timer.Tick += new EventHandler(AnimatedPlot);

    timer.IsEnabled = true;

    plotter.Viewport.FitToView();

}

鼠标右键可将图表拷贝到其他文档:
动态演示
鼠标左键拖动图表浏览任意位置曲线数据,鼠标中键可以缩放显示曲线图。
源代码下载
WPF 动态模拟CPU 使用率曲线图的更多相关文章
- 模拟Windows任务管理器CPU使用率的动态折线图-农夫山泉
Delphi的TCanvas类可以实现各种复杂的图形输出功能,基于近期项目的需求,利用它实现了一个很炫的动态折线图(模拟了资源管理器中CPU使用率的折线图),可以直观地展现出数值的实时变化情况. 这段 ...
- 使用WPF动态显示CPU使用率
基于WPF的开源图表控件有很多,大多数都是静态图表,如果需要绘制CPU使用率这样的动态数据就显得力不从心,微软开源的DynamicDataDisplay控件弥补了这个不足,为了做个备忘,我用它来实时绘 ...
- 关于linux系统CPU篇--->CPU使用率升高
1.CPU使用率为单位时间内CPU使用情况的统计,以百分比的方式展示. LINUX作为一个多任务操作系统,将每个CPU的时间划分为很短的时间片,再通过调度器轮流分配给各个任务使用,因此造成多任务同时运 ...
- 05 | 基础篇:某个应用的CPU使用率居然达到100%,我该怎么办?
通过前两节对平均负载和 CPU 上下文切换的学习,我相信你对 CPU 的性能已经有了初步了解.不过我还是想问一下,在学这个专栏前,你最常用什么指标来描述系统的 CPU 性能呢?我想你的答案,可能不是平 ...
- 某个应用的CPU使用率居然达到100%,我该怎么做?(三)
某个应用的CPU使用率居然达到100%,我该怎么做?(三) 1. 引 你们好,可爱的小伙伴们^_^! 咱们最常用什么指标来描述系统的CPU性能呢?我想你的答案,可能不是平均负载,也不是CPU上下文切换 ...
- 性能分析(3)- 短时进程导致用户 CPU 使用率过高案例
性能分析小案例系列,可以通过下面链接查看哦 https://www.cnblogs.com/poloyy/category/1814570.html 系统架构背景 VM1:用作 Web 服务器,来模拟 ...
- 性能分析(5)- 软中断导致 CPU 使用率过高的案例
性能分析小案例系列,可以通过下面链接查看哦 https://www.cnblogs.com/poloyy/category/1814570.html 前言 软中断基本原理,可参考这篇博客:https: ...
- 使用mysqlslap对mysql进行压测,观察Azure虚拟机cpu使用率
一直想做这个测试,原因很简单,很多人一直比较怀疑Azure的虚拟机性能,说相同的配置凭啥比阿里的虚拟机贵那么多,其实,我自己以前也怀疑过,但是接触Azure的几个月,确实发现Azure的虚拟机性能真的 ...
- 转载 - LINUX下查看CPU使用率的命令
几个常用的命令,一些不错的解释 http://blog.csdn.net/wengpingbo/article/details/6302058 1.top 使用权限:所有使用者 使用方式:top [- ...
随机推荐
- C#验证手机号
using System.Text.RegularExpressions; private bool IsMobile(string phoneNo) { return Regex.IsMatch(p ...
- 开发文档生成工具----强大的Doxygen工具使用手册
张三:假如我们自己开发了一个类库,怎么做一个方便阅读的文档呢? 李四:一个方法一个方法地写呗,就像写Excel文档一下. 张三:啊,你out了,这多慢呀.为什么不玩玩doxygen工具,它能帮你生成文 ...
- js如何实现动态的在表格中添加和删除行?(两种方法)
js如何实现动态的在表格中添加和删除行?(两种方法) 一.总结 1.table元素有属性和一些方法(js使用) 方法一:添加可通过在table的innerHTML属性中添加tr和td来实现 tab.i ...
- Material Designer的低版本兼容实现 —— ActivityOptionsCompat
http://www.bubuko.com/infodetail-460163.html
- Ajax详解及使用Ajax时的返回值类型有哪些?
Ajax详解 Ajax = 异步 JavaScript 和 XML. Ajax 是一种用于创建快速动态网页的技术. 通过在后台与服务器进行少量数据交换,Ajax 可以使网页实现异步更新.这意味着可以在 ...
- js的dom对象(带实例超详细全解)
js的dom对象(带实例超详细全解) 一.总结 一句话总结: 1.DOM中的方法区分大小写么? 解答:区分 2.DOM中元素和节点的关系式什么? 解答:元素就是标签,节点中有元素节点,也是标签,节点中 ...
- 【 D3.js 高级系列 — 2.0 】 机械图 + 人物关系图
机械图(力路线图)结合老百姓的关系图中的生活,这是更有趣. 本文将以此为证据,所列的如何图插入外部的图像和文字的力学. 在[第 9.2 章]中制作了一个最简单的力学图.其后有非常多朋友有疑问,基本的问 ...
- sitecore-CMS
安装sitecore数据库和客户端到本机 (提前先装好数据库和IIS) 安装教程下载:http://download.csdn.net/detail/qq1162195421/6436799 安装 ...
- js css 实现简单的计算器
<!DOCTYPE html PUBLIC "-//W3C//DTD XHTML 1.0 Transitional//EN" "http://www.w3.org/ ...
- webpack run dev后并没有生成dist目录,但是浏览器里却读取了dist里的build.js?
最近想看看现在做的React项目用的脚手架,看了下webpack的配置,尝试修改一些东西看看输出结果,结果允许npm run dev发现没有输出目录,怎么回事呢.又安装了vue官方提供的webpack ...