Matplotlib.pyplot 常用方法
1、介绍
Matplotlib 是一个 Python 的 2D绘图库,它以各种硬拷贝格式和跨平台的交互式环境生成出版质量级别的图形。通过 Matplotlib,开发者可以仅需要几行代码,便可以生成绘图,
直方图,功率谱,条形图,错误图,散点图等。
2、Matplotlib基础知识
2.1、Matplotlib中的基本图表包括的元素
2.2、hold属性
2.3、网格线
2.4、axis方法
2.5、xlim方法和ylim方法
3、配置属性
Matplotlib.plt是面向对象的绘图库,可以为每个对象配置它们的属性,有三个方法:
- 对象的set_属性名()
- 对象的set()
- pylot模块提供的setp()函数
如下例子:
plt.figure()

line = plt.plot(range(5))[0]                # plot函数返回的是一个列表,因为可以同时画多条线的哦;

line.set_color('r')

line.set_linewidth(2.0)

plt.show()

####################################

plt.figure()

line = plt.plot(range(5))[0]            # plot函数返回的是一个列表,因为可以同时画多条线;

line.set(color = 'g',linewidth = 2.0)

plt.show()

####################################

plt.figure()

lines = plt.plot(range(5),range(5),range(5),range(8,13))    # plot函数返回一个列表;

plt.setp(lines, color = 'g',linewidth = 2.0)                # setp函数可以对多条线进行设置的;

plt.show()
获取属性:
- 一个是通过对象的方法get_属性名()函数,
- 一个是通过pylot模块提供的getp()函数。
getp()有两个调用方法,一个是只有要的查看的对象一个参数,一个是要查看的对象现属性两个参数;如:
# getp(obj, property=None)

plt.getp(line)

plt.getp(line, 'color')
4、Artist 对象
matplotlib API包含有三层:
- backend_bases.FigureCanvas : 图表的绘制领域
- backend_bases.Renderer : 知道如何在FigureCanvas上如何绘图
- artist.Artist : 知道如何使用Renderer在FigureCanvas上绘图
FigureCanvas和Renderer需要处理底层的绘图操作,例如使用wxPython在界面上绘图,或者使用PostScript绘制PDF。Artist则处理所有的高层结构,例如处理图表、
文字和曲线等的绘制和布局。通常我们只和Artist打交道,而不需要关心底层的绘制细节。
Artists分为简单类型和容器类型两种。简单类型的Artists为标准的绘图元件,例如Line2D、 Rectangle、 Text、AxesImage 等等。而容器类型则可以包含许多简单类型的Artists,
使它们组织成一个整体,例如Axis、 Axes、Figure等。
直接使用Artists创建图表的标准流程如下:
创建Figure对象
用Figure对象创建一个或者多个Axes或者Subplot对象
调用Axies等对象的方法创建各种简单类型的Artists
4.1、Artist 对象
Artist对象共分为简单类型和容器类型两种哦。
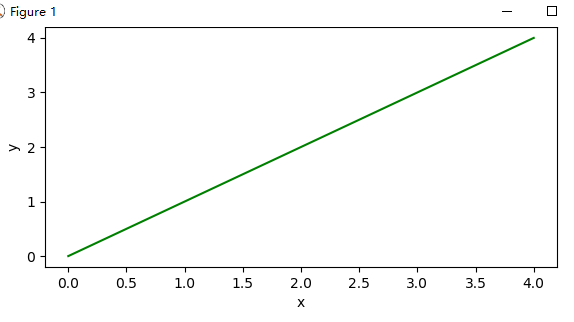
下面是一个简单Artist对象的创建过程:
import matplotlib.pyplot as plt

import numpy as np

fig = plt.figure(1)        # 创建了一个figure对象;

# figure对象的add_axes()可以在其中创建一个axes对象,

# add_axes()的参数为一个形如[left, bottom, width, height]的列表,取值范围在0与1之间;

# 我们把它放在了figure图形的上半部分,对应参数分别为:left, bottom, width, height;

ax = fig.add_axes([0.1, 0.5, 0.8, 0.5])

ax.set_xlabel('x')           # 用axes对象的set_xlabel函数来设置它的xlabel

ax.set_ylabel('y')

line =ax.plot(range(5))[0]      # 用axes对象的plot()进行绘图,它返回一个Line2D的对象;

line.set_color('g')             # 再调用Line2D的对象的set_color函数设置color的属性;

plt.show()
输出图形:
5、figure 容器
在构成图表的各种Artist对象中,最上层的Artist对象是Figure。我们可以调用add_subplot()与add_axes()方法向图表中添加子图,它们分加到figure的axes的属性列表中。
add_subplot()与add_axes()返回新创建的axes对象,分别为axesSuubplot与axes, axesSuubplot为 axes的派生类。另外,可以通过delaxes()方法来删除哦;
figure对象可以有自己的简单的artist对象。
下面列出Figure对象中包含的其他Artist对象的属性:
axes:Axes对象列表;
patch:作为背景的Rectangle对象;
images:FigureImage对象列表,用于显示图像;
legends:Legend 对象列表,用于显示图示;
lines:Line2D对象列表;
patches:Patch对象列表;
texts:Text 对象列表,用于显示文字;
6、axes 容器
它是整个matplotlib的核心,它包含了组成图表的众多的artist对象。并且有很多方法。我们常用的Line2D啦,Xaxis,YAxis等都是它的属性哦;可以通过这个对象的属性来设置坐标轴的label,
范围啦等之类的。干脆直接用plt.getp()查看它的属性,然后通过set_属性名()函数来设置就好啦。
7、axis 容器
axis容器包括了坐标轴上的刻度线、刻度标签等、坐标网络等内容。
坐标轴上的每个刻度包括刻度线(ticklines)、刻度标签(ticklabels)、刻度位置(ticklocs)。
例子:
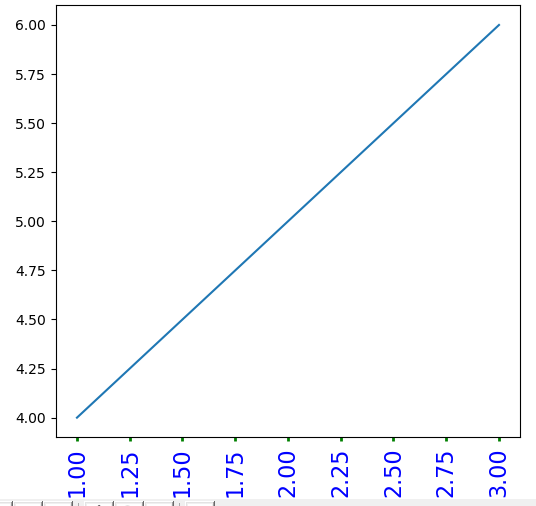
import numpy as np

import matplotlib.pyplot as plt

# 通过axis来更改坐标轴

plt.plot([1,2,3],[4,5,6])

# gca()获取当前的axes绘图区域,调用gcf()来获得当前的figure

axis = plt.gca().xaxis

axis.get_ticklocs()                 # 得到刻度位置;

axis.get_ticklabels()               # 得到刻度标签;

axis.get_ticklines()                # 得到刻度线;

axis.get_ticklines(minor = True)    # 得到次刻度线; 举个例子:就像我们的尺子上的厘米的为主刻度线,毫米的为次刻度线;

for label in axis.get_ticklabels():

    label.set_color('blue')          # 设置每个刻度标签的颜色;

    label.set_rotation(90)          # 旋转45度;

    label.set_fontsize(16)          # 设置字体大小;

for line in axis.get_ticklines():

    line.set_color('green')

    line.set_markersize(3)         # 设置刻度线的长短;

    line.set_markeredgewidth(2)     # 设置线的粗细

plt.show()
运行结果:
pyplot函数提供了两个绘制文字的函数:text()和figtext()。它们分别调用了当前的Axes对象与当前的Figure对象的text()方法进行绘制文字。
text()默认在数字坐标系(就是axes在的坐标系,用坐标轴的数字来表示坐标)中画, figtext()默认在图表坐标系(就是figure在图表中,坐标范围从0 到 1 )中画,
简单的调用:
plt.text(1, 1, ‘hello,world’, color = ‘bule’) #还可以写更多参数的;
plt.figtexe(0.1, 0.8 ,”i am in figure’, color = ‘green’)
8、常用函数
plot()
可以画出很简单线图,基本用法:
lot(x, y) # 画出横轴为x与纵轴为y的图,使用默认的线形与颜色;
plot(x, y, 'bo') # 用蓝色,且点的标记用小圆,下面会解释哦
plot(y) # 纵轴用y ,横轴用y的每个元素的坐标,即0,1,2……
plot(y, 'r+') # 如果其中x或y 为2D的,则会用它的相应的每列来表示(注意是每列)
plot(x1, y1, 'g^', x2, y2, 'g-') #可以使用多对的x, y, format 对当作变量的,把它们画一个图里;
对于参数中,常用的format:线的颜色、线的形状、点的标记形状,我们用这三个的时候经常用缩写,它们之间的顺序怎么都可以,
如它俩一个意思:’r+–’、’+–r’。如果我们不想缩写的话,可以分别写成如: color=’green’, linestyle=’dashed’, marker=’o’。
线的形状:
‘-’ solid line style
‘–’ dashed line style
‘-.’ dash-dot line style
‘:’ dotted line style
点的标记:
‘.’ point marker
‘,’ pixel marker
‘o’ circle marker
‘v’ triangle_down marker
‘^’ triangle_up marker
‘<’ triangle_left marker
‘>’ triangle_right marker
‘1’ tri_down marker
‘2’ tri_up marker
‘3’ tri_left marker
‘4’ tri_right marker
‘s’ square marker
‘p’ pentagon marker
‘*’ star marker
‘h’ hexagon1 marker
‘H’ hexagon2 marker
‘+’ plus marker
‘x’ x marker
‘D’ diamond marker
‘d’ thin_diamond marker
‘|’ vline marker
‘_’ hline marker
线的颜色:
‘b’ blue
‘g’ green
‘r’ red
‘c’ cyan
‘m’ magenta
‘y’ yellow
‘k’ black
‘w’ white
常见线的属性有:color,labor,linewidth,linestyle,maker,等,参考:lines–matplotlib。
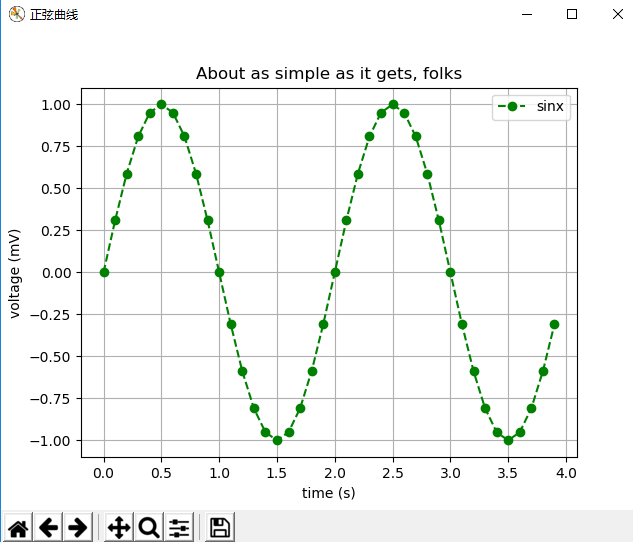
显示正弦曲线
import numpy as np

import matplotlib.pyplot as plt

plt.figure('正弦曲线')                   # 调用figure函数创建figure(1)对象,可以省略,这样那plot时,它就自动建一个啦;

t = np.arange(0.0, 4.0, 0.1)

s = np.sin(np.pi*t)

plt.plot(t, s, 'g--o', label = 'sinx')

plt.legend()                    # 显示右上角的那个label,即上面的label = 'sinx'

plt.xlabel('time (s)')          # 设置x轴的label,pyplot模块提供了很直接的方法,内部也是调用的上面当然讲述的面向对象的方式来设置;

plt.ylabel('voltage (mV)')      # 设置y轴的label;

#plt.xlim(-1,3)                 # 可以自己设置x轴的坐标的范围哦;

#plt.ylim(-1.5,1.5)

plt.title('About as simple as it gets, folks')

plt.grid(True)                  # 显示网格;

plt.show()
输出图形:
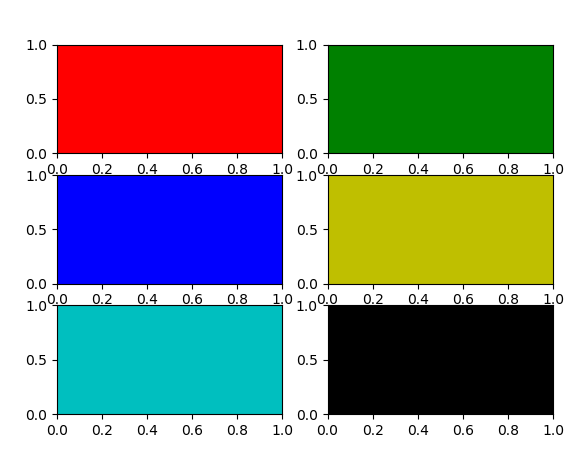
subplot()
利用subplot()函数可以返回一个axes的对象,函数为:subplot(numRows, numCols, plotnum),当这三个参数都小于10时,可以把它们写一起,如下所示:
# 填充彩色子图

import matplotlib.pyplot as plt

import numpy as np

for i, color in enumerate('rgbyck'):

    plt.subplot(321+i, facecolor = color)

plt.show()
输出图形:
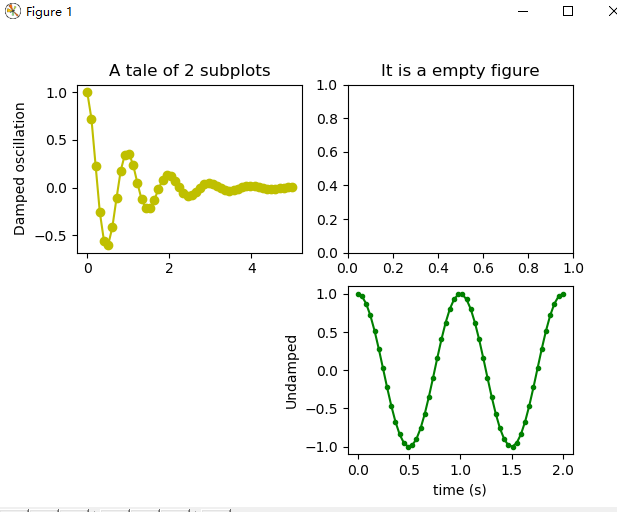
利用subplot_adjust()函数可以对画的多个子图进行调整,优化间隔,它一共有left、right, bottom, top, wspace, hspase 六个参数,取 值从0至1。
# 填充彩色子图

import matplotlib.pyplot as plt

import numpy as np

x1 = np.linspace(0.0, 5.0)   #生成一个一维的array,linspace(起始点,结束点,点数(默认为50))

x2 = np.linspace(0.0, 2.0)

y1 = np.cos(2 * np.pi * x1) * np.exp(-x1)

y2 = np.cos(2 * np.pi * x2)

plt.subplot(2, 2, 1)      #表示在subplot为2*1的样式,并在第一个子图上画出;

plt.plot(x1, y1, 'yo-')

plt.title('A tale of 2 subplots')

plt.ylabel('Damped oscillation')

plt.subplot(2, 2, 2)      #  我们在第二个子图上加个空图哈,去理解它的图的排序(即注意第二个子图的位置

                                    #  为第一行第二列)是按行优先的,这个正好和matlab里相反哦;

plt.title('It is a empty figure')

plt.subplot(2, 2, 4)

plt.plot(x2, y2, 'g.-')

plt.xlabel('time (s)')

plt.ylabel('Undamped')

plt.show()
输出图形:
subplots()
plt.subplots(nrows=1, ncols=1, sharex=False, sharey=False, squeeze=True, subplot_kw=None, **fig_kw)
作用:创建一个已有subplots的figures;
参数:
nrows : int ,指创建的sublots的行数,默认为1.
ncols : int ,指创建的sublots的列数,默认为1.
sharex : 为一个string或bool类型; 当为Ture时,所有的subpots将要共享x轴,如果它们是上下的关系的话,上面的图的刻度label就没有,只有下面那个图的.
If a string must be one of "row", "col", "all", or "none".

    "all" has the same effect as *True*, "none" has the same effect

    as *False*.

    If "row", each subplot row will share a X axis.

    If "col", each subplot column will share a X axis and the x tick

    labels on all but the last row will have visible set to *False*.

  *sharey* : 同上

  *squeeze* : bool  它是用来控制返回值的,根据返回的axis的结果决定要不要把没有的维度进行压缩一下.

       当为Ture时,如果返回的axis只有一个,则表示成标量,如果有一行或一列,则表示为一维数组,如果多行多列,则表示为2D数组;

       当为False时,不管多少个返回的axis,都以二维数组的方式返回;

  *subplot_kw* : dict

    Dict with keywords passed to the

    :meth:`~matplotlib.figure.Figure.add_subplot` call used to

    create each subplots.

  *fig_kw* : dict

    Dict with keywords passed to the :func:`figure` call.  Note that all

    keywords not recognized above will be automatically included here.
返回值
有两个fig和 axt(它是元组的方式)
*fig* is the :class:matplotlib.figure.Figure object
*ax * can be either a single axis object or an array of axis objects if more than one subplot was created. The dimensions of the resulting array can be controlled with the squeeze keyword, see above.
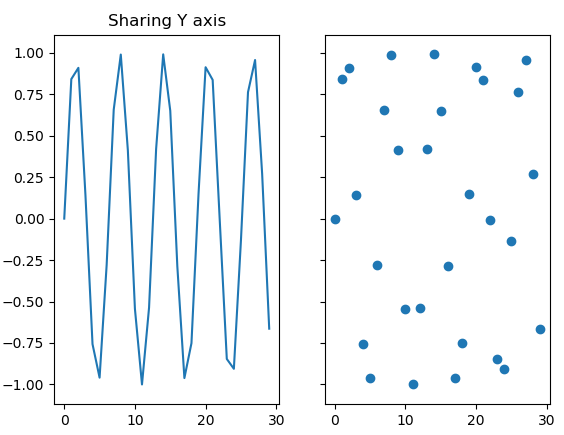
# subplots() 返回值

import matplotlib.pyplot as plt

import numpy as np

x = range(0,30,1)

y = np.sin(x)

# 接收返回的两个对象

f,(ax1, ax2) = plt.subplots(1, 2, sharey=True)

# 两个对象分别画图

ax1.plot(x, y)

ax1.set_title('Sharing Y axis')

ax2.scatter(x, y)

plt.show()
输出图形:
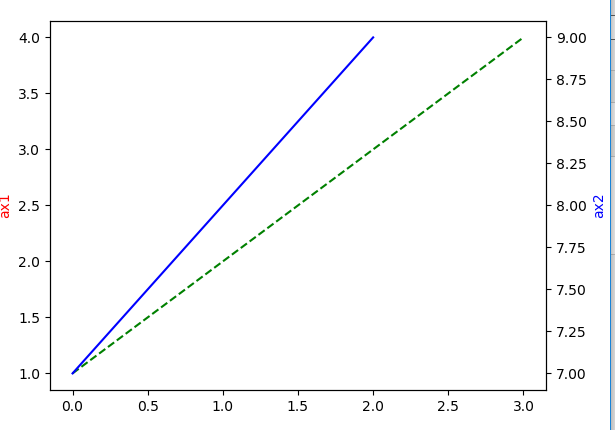
twinx()或twiny()
twinx():在同一图画中,共享x轴,但是拥有各自不同的y轴
twiny():和上面一样,不同之处在于,它共享y轴。
# twinx() 共享x轴实例

import matplotlib.pyplot as plt

import numpy as np

fig = plt.figure(1)

ax1 =plt.subplot(111)

ax2 = ax1.twinx()

ax1.plot(np.arange(1,5),'g--')

ax1.set_ylabel('ax1',color = 'r')

ax2.plot(np.arange(7,10),'b-')

ax2.set_ylabel('ax2',color = 'b')

plt.show()
输出图形:
参考文章:
matplotlib.pyplot 官方文档
博客园——matplotlib 常用知识
博客园——matplotlib 绘图入门
matplotlib-绘制精美的图表(Figure容器,Artist对象,Axes容器)
博客园——Matplotlib 详解图像各个部分
Matplotlib.pyplot 常用方法(一)
Matplotlib.pyplot 常用方法的更多相关文章
- matplotlib.pyplot 绘图详解 matplotlib 安装
apt-get install python-matplotlib 转载自: http://www.cnblogs.com/qianlifeng/archive/2012/02/13/2350086. ...
- matplotlib.pyplot.hist
**n, bins, patches = plt.hist(datasets, bins, normed=False, facecolor=None, alpha=None)** ## 函数说明 用于 ...
- 数据分析之matplotlib.pyplot模块
首先都得导模块. import numpy as np import pandas as pd import matplotlib.pyplot as plt from pandas import S ...
- Python Matplotlib.pyplot plt 中文显示
话不多说,上代码 # -*- coding: UTF-8 -*- import matplotlib.pyplot as plt from matplotlib.font_manager import ...
- 在绘图的时候import matplotlib.pyplot as plt报错:ImportError: No module named '_tkinter', please install the python-tk package
在绘图的时候import matplotlib.pyplot as plt报错:ImportError: No module named '_tkinter', please install the ...
- Matplotlib.pyplot 把画图保存为图片
在plt.show()之前执行plt.savefig()函数即可. 简单例子: import matplotlib.pyplot as plt x=[1,2,3,4,5] y=[10,5,15,10, ...
- 使用numpy与matplotlib.pyplot画图
使用numpy与matplotlib.pyplot画图 1. 折线图 1 # -*- enccoding:utf-8 -*- 2 import numpy as np 3 import matplot ...
- 用matplotlib.pyplot画简单的折线图,直方图,散点图
#coding=utf-8 """ 用matplotlib.pyplot画简单的折线图,直方图,散点图 """ import matplot ...
- matplotlib.pyplot展示MNIST图片
import torch import torch.utils.data as Data import torchvision import torchvision.transforms as tra ...
随机推荐
- Linux与Windows远程互访(使用Rdesktop与SSH)
工作的时候经常使用Redhat系列系统,而平常娱乐文档都是在windows平台上进行.因此实现linux与windows远程互访也是很有必要的事情. 本文将介绍如何实现Linux与Windows的远程 ...
- 马士兵hadoop第四课:Yarn和Map/Reduce配置启动和原理讲解
马士兵hadoop第一课:虚拟机搭建和安装hadoop及启动 马士兵hadoop第二课:hdfs集群集中管理和hadoop文件操作 马士兵hadoop第三课:java开发hdfs 马士兵hadoop第 ...
- 通过本地Git部署网站到WebSite
玩过Azure WebSite(WebApp)的同学应该知道部署网站的方式非常多,今天我要讲的是如果通过本地Git部署网站到WebSite. 1.新建WebSite 创建WebSite非常简单,我这里 ...
- 使用 IntraWeb (21) - 基本控件之 TIWTabControl
TIWTabControl 包含的是 TIWTabPage; 设计时通过右键菜单 Add Page 添加(再给页面添加东西时一定要先选定页面); 下面例子是动态添加的. TIWTabControl 所 ...
- request.getRequestDispatcher("").forward()中文乱码
即使jsp页面的编码已设为“UTF-8”,有中文的地方还是会出现乱码,但是用response.sendRedirect不会出现此问题. 解决方案一: 不使用PrintWriter out=respon ...
- HTML5之Javascript多线程
Javascript执行机制 在HTML5之前,浏览器中JavaScript的运行都是以单线程的方式工作的,虽然有多种方式实现了对多线程的模拟(例如:Javascript 中的 setint ...
- SQLSERVER误删Windows登录用户验证方式使用Windows身份验证的解决方法
今天看到这篇文章:没有了SA密码,无法Windows集成身份登录,DBA怎么办? 想起来之前着急哥问我的一个问题,一个DBA删除了Windows登录用户,而且SQLSERVER服务器的验证方式是Win ...
- android开发之GestureDetector手势识别(调节音量、亮度、快进和后退)
写UI布局: <?xml version="1.0" encoding="utf-8"?> <LinearLayout xmlns:andro ...
- Revit MEP API找到连接器连接的连接器
通过conn.AllRefs;可以找到与之连接的连接器. //连接器连接的连接器 [TransactionAttribute(Autodesk.Revit.Attributes.Transaction ...
- ASP.NET MVC异步验证是如何工作的03,jquery.validate.unobtrusive.js是如何工作的
在上一篇"ASP.NET MVC异步验证是如何工作的02,异步验证表单元素的创建"中了解了ASP.NET异步验证是如何创建表单元素的,本篇体验jquery.validate.uno ...