perf + Flame Graph火焰图分析程序性能
1、perf命令简要介绍
性能调优时,我们通常需要分析查找到程序百分比高的热点代码片段,这便需要使用 perf record 记录单个函数级别的统计信息,并使用 perf report 来显示统计结果;
usage: perf [--version] [--help] [OPTIONS] COMMAND [ARGS]

 The most commonly used perf commands are:

   annotate        Read perf.data (created by perf record) and display annotated code

   archive         Create archive with object files with build-ids found in perf.data file

   bench           General framework for benchmark suites

   buildid-cache   Manage build-id cache.

   buildid-list    List the buildids in a perf.data file

   data            Data file related processing

   diff            Read perf.data files and display the differential profile

   evlist          List the event names in a perf.data file

   inject          Filter to augment the events stream with additional information

   kmem            Tool to trace/measure kernel memory properties

   kvm             Tool to trace/measure kvm guest os

   list            List all symbolic event types

   lock            Analyze lock events

   mem             Profile memory accesses

   record          Run a command and record its profile into perf.data

   report          Read perf.data (created by perf record) and display the profile

   sched           Tool to trace/measure scheduler properties (latencies)

   script          Read perf.data (created by perf record) and display trace output

   stat            Run a command and gather performance counter statistics

   test            Runs sanity tests.

   timechart       Tool to visualize total system behavior during a workload

   top             System profiling tool.

   trace           strace inspired tool

   probe           Define new dynamic tracepoints

 See 'perf help COMMAND' for more information on a specific command.
举例
perf record -e cpu-clock -g -p 222
-g 选项是告诉perf record额外记录函数的调用关系
-e cpu-clock 指perf record监控的指标为cpu周期
-p 指定需要record的进程pid
程序运行完之后,perf record会生成一个名为perf.data的文件,如果之前已有,那么之前的perf.data文件会被覆盖
获得这个perf.data文件之后,就需要perf report工具进行查看
perf report -i perf.data
-i 指定要查看的文件
以诊断fluentd为例,report结果:
$perf report -i perf.data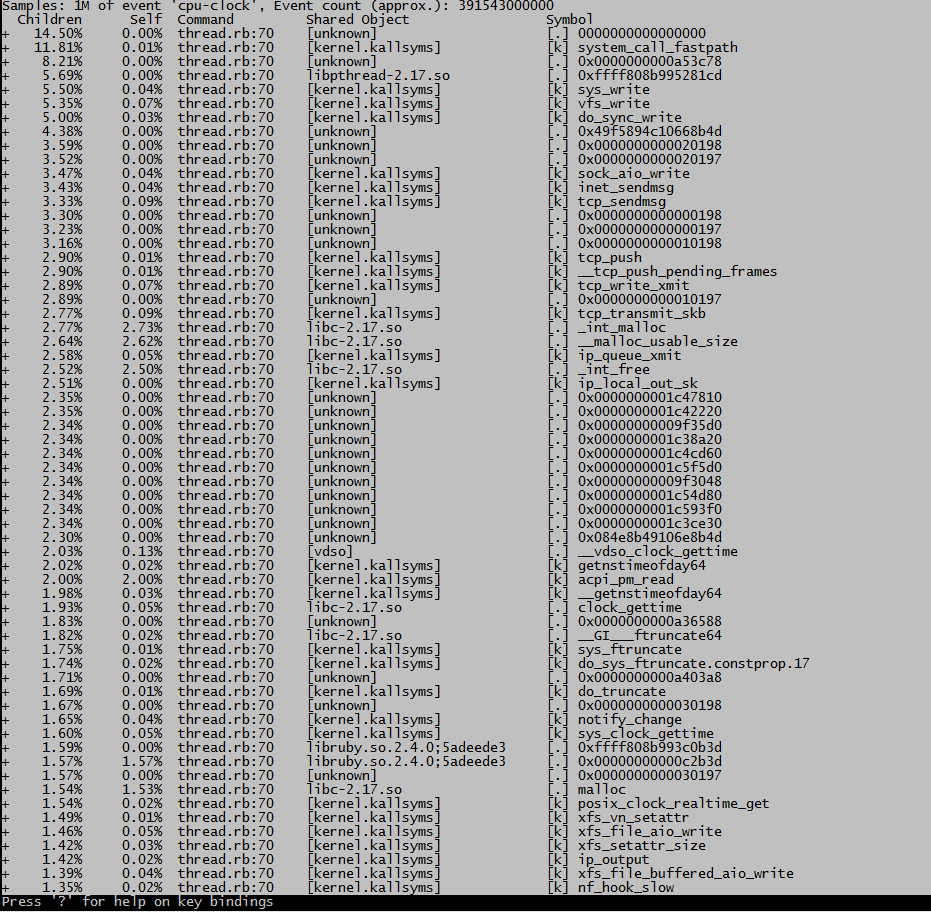
这种格式很不直观
2、使用火焰图展示结果
1、Flame Graph项目位于GitHub上:https://github.com/brendangregg/FlameGraph
2、可以用git将其clone下来:git clone https://github.com/brendangregg/FlameGraph.git
注意:git clone之后,下面用到的*.pl文件先给+x可执行权限,注意路径
我们以perf为例,看一下flamegraph的使用方法:
1、第一步
$perf record -e cpu-clock -g -p 28591
Ctrl+c结束执行后,在当前目录下会生成采样数据perf.data.
2、第二步
用perf script工具对perf.data进行解析
perf script -i perf.data &> perf.unfold
3、第三步
将perf.unfold中的符号进行折叠:
./stackcollapse-perf.pl perf.unfold &> perf.folded
注意:该命令可能有错误,错误提示在perf.folded
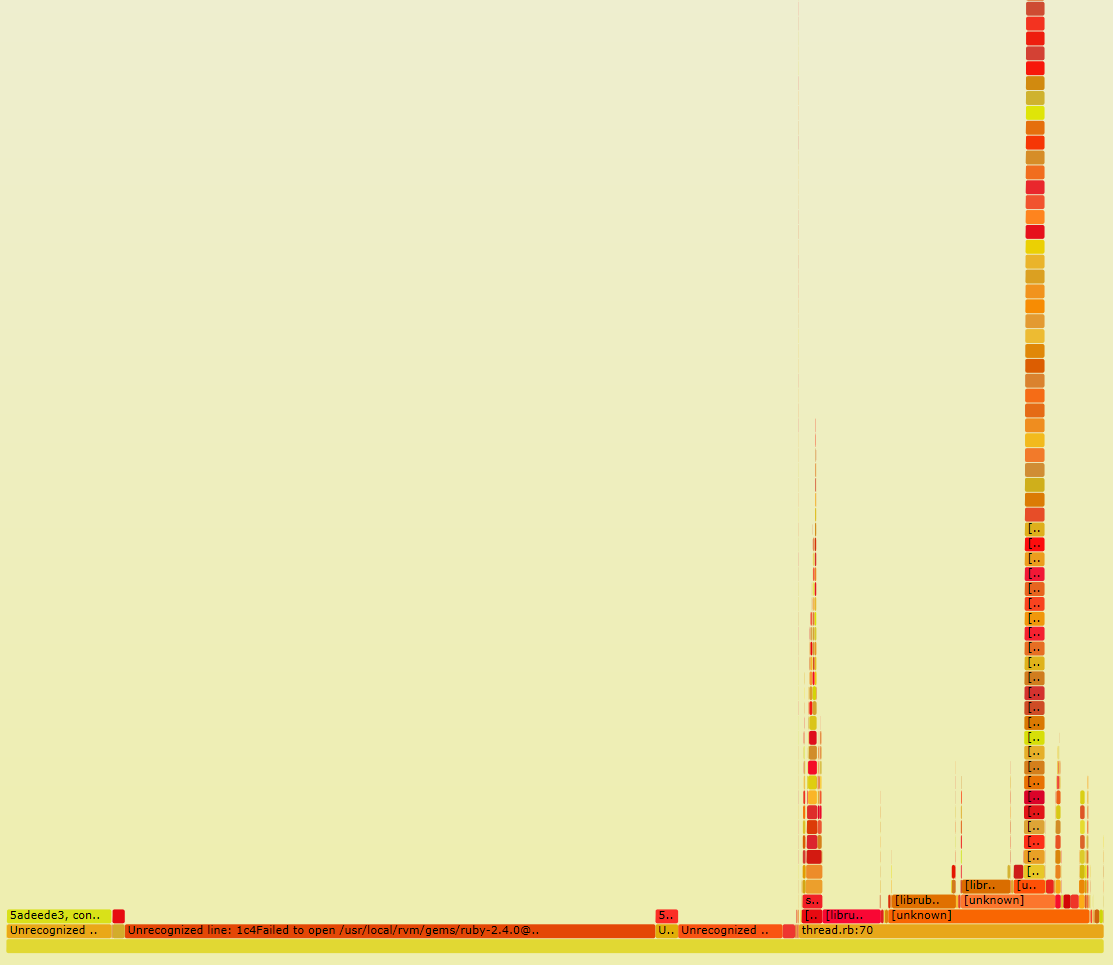
4、最后生成svg图:
./flamegraph.pl perf.folded > perf.svg
perf + Flame Graph火焰图分析程序性能的更多相关文章
- [转]perf + 火焰图分析程序性能
1.perf命令简要介绍 性能调优时,我们通常需要分析查找到程序百分比高的热点代码片段,这便需要使用 perf record 记录单个函数级别的统计信息,并使用 perf report 来显示统计结果 ...
- perf + 火焰图分析程序性能
1.perf命令简要介绍 性能调优时,我们通常需要分析查找到程序百分比高的热点代码片段,这便需要使用 perf record 记录单个函数级别的统计信息,并使用 perf report 来显示统计结果 ...
- 用 CPI 火焰图分析 Linux 性能问题
https://yq.aliyun.com/articles/465499 用 CPI 火焰图分析 Linux 性能问题 yangoliver 2018-02-11 16:05:53 浏览1076 ...
- 使用perf生成Flame Graph(火焰图)
具体的步骤参见这里: <flame graph:图形化perf call stack数据的小工具> 使用SystemTap脚本制作火焰图,内存较少时,分配存储采样的数组可能失败,需 ...
- 火焰图分析CPU性能问题
1.找出应用程序或内核消耗CPU的PID 2.执行perf record 命令,记录该PID的行为 perf record -a -g -p 14851 -- sleep 30 --30秒后退出 3. ...
- 超好用的自带火焰图的 Java 性能分析工具 Async-profiler 了解一下
如果你经常遇到 Java 线上性能问题束手无策,看着线上服务 CPU 飙升一筹莫展,发现内存不断泄露满脸茫然.别慌,这里有一款低开销.自带火焰图.让你大呼好用的 Java 性能分析工具 - async ...
- 利用火焰图分析ceph pg分布
前言 性能优化大神Brendan Gregg发明了火焰图来定位性能问题,通过图表就可以发现问题出在哪里,通过svg矢量图来查看性能卡在哪个点,哪个操作占用的资源最多 在查看了原始数据后,这个分析的原理 ...
- 火焰图分析openresty性能瓶颈
注:本文操作基于CentOS 系统 准备工作 用wget从https://sourceware.org/systemtap/ftp/releases/下载最新版的systemtap.tar.gz压缩包 ...
- python cProfile分析程序性能
转自:http://xianglong.me/article/analysis-python-application-performance-using-cProfile/?utm_source=tu ...
随机推荐
- .NET Core脚本工具dotnet-script
什么是dotnet-script "dotnet-script"是github上一个开源的.net core global tool, 项目地址https://github.com ...
- 华为oj之字符串分割
题目: 字符串分隔 热度指数:6139 时间限制:1秒 空间限制:32768K 本题知识点: 字符串 题目描述 •连续输入字符串,请按长度为8拆分每个字符串后输出到新的字符串数组: •连续输入字符串, ...
- python scrapy 入门,10分钟完成一个爬虫
在TensorFlow热起来之前,很多人学习python的原因是因为想写爬虫.的确,有着丰富第三方库的python很适合干这种工作. Scrapy是一个易学易用的爬虫框架,尽管因为互联网多变的复杂性仍 ...
- 客户端缓存机制 - Cookie详解
Cookie 作者:Stanley 罗昊 [转载请注明出处和署名,谢谢!] Cookie不是内置对象,所以用的时候需要new出来,Cookie是由服务端产生的,再发送给客户端保存,它不是内置对象,却是 ...
- 【API知识】一种你可能没见过的Controller形式
前言 这里分享一下我遇到的一个挺有意思的Controller形式,内容涉及@RequestMapping注解的原理. 实际案例 一.基本描述 项目甲中有多个模块,其中就有模块A和B.(这里的模块指的是 ...
- Golang垃圾回收机制(一)
原文: http://legendtkl.com/2017/04/28/golang-gc/ 1. Golang GC 发展 Golang 从第一个版本以来,GC 一直是大家诟病最多的.但是每一个版本 ...
- VisualStudio2017集成GitHub
1 概述 通过使用VisualStudio2017来编写C语言版本的helloworld程序,然后上传至GitHub 2 VisualStudio2017安装GitHub插件 前提条件: 必须完成Vi ...
- [PHP] 适配器模式的日常使用
适配器模式就是将一个类的接口方法转换成我希望用的另一个方法 , 下面是个常见的用处 class Session{ public $mc; public function __construct(){ ...
- 【转】三个案例带你看懂LayoutInflater中inflate方法两个参数和三个参数的区别
关于inflate参数问题,我想很多人多多少少都了解一点,网上也有很多关于这方面介绍的文章,但是枯燥的理论或者翻译让很多小伙伴看完之后还是一脸懵逼,so,我今天想通过三个案例来让小伙伴彻底的搞清楚这个 ...
- JS截取数字
Math是javascript的一个内部对象,该对象的方法主要是一些数学计算方法floor:下退 Math.floor(12.9999) = 12ceil:上进 Math.ceil(12.1) = 1 ...