SVG--D3--血缘关系树
最近的工作与可视化有关,有展示血缘关系树的需求 ,类似于这样:
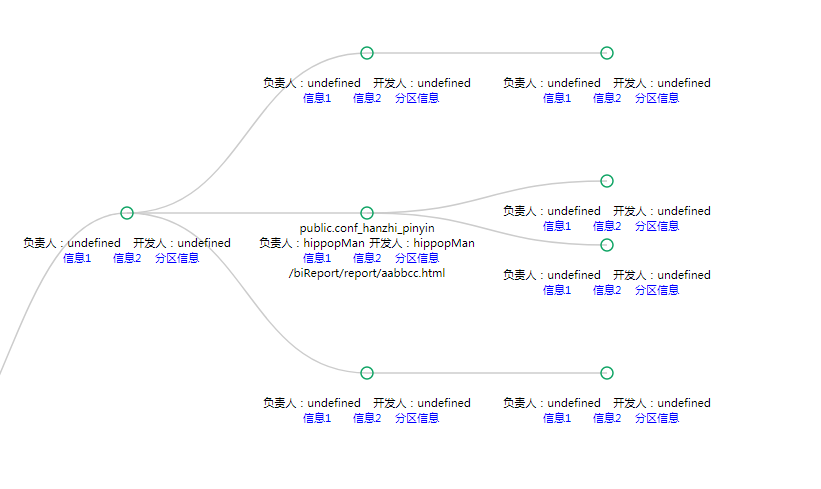
碰巧搜到 D3(用于可视化的js库,作者吕之华),瞬间无法自拔,它的树状图功能基于SVG、js ,暴露的可操作入口也简洁恰当,能帮助你快速完成svg开发。
D3的使用: 入门教程:http://wiki.jikexueyuan.com/project/d3wiki/author.html
开发笔记:
1. SVG DOM 与HTML DOM 不一样,属性、样式是不共用的,但也有相似之处
2. Svg中一段文本用<text>标签,如果要集中控制多个元素用<g>(group)标签
3. 钩子:
nodeEnter nodeUpdate nodeExit
var flare = {

              "name": "前端应用",

              "children": [

                {

                  "name": "服务1",

                  "children": [

                    {

                      "name": "cluster",

                      "children": [

                        {"name": "AgglomerativeCluster", "size": 3938}

                      ]

                    },

                    {

                      "name": "graph",

                      "tablename" : "public.conf_hanzhi_pinyin",

                      "dataowner" :"hippopMan",

                      "datadeveloper":"hippopMan",

                      "url":"/biReport/report/aabbcc.html",

                      "children": [

                        {"name": "BetweennessCentrality", "size": 3534},

                        {"name": "LinkDistance", "size": 5731}

                      ]

                    },

                    {

                      "name": "optimization",

                      "children": [

                        {"name": "AspectRatioBanker", "size": 7074}

                      ]

                    }

                  ]

                },

                {

                  "name": "服务2",

                  "children": [

                    {"name": "Easing", "size": 17010},

                    {"name": "FunctionSequence", "size": 5842}

                  ]

                }
          ........

              ]

            };
具体代码:
var margin = {top: 20, right: 120, bottom: 20, left: 120},

    width = 3200 - margin.right - margin.left,

    height = 1200 - margin.top - margin.bottom;

var i = 0,

    duration = 750,

    root;

var tree = d3.layout.tree()

    .size([height, width]);

var diagonal = d3.svg.diagonal()

    .projection(function(d) { return [d.y, d.x]; });

var svg = d3.select(".canvan").append("svg")

    .attr("width", width + margin.right + margin.left)

    .attr("height", height + margin.top + margin.bottom)

    .append("g")

    .attr("transform", "translate(" + 80 + "," + 20 + ")");

function collapse(d) {

    if (d.children) {

        d._children = d.children;

        d._children.forEach(collapse);

        d.openFlag = false;       //自定义属性

    }else{

        if(searchFlag){

            d.openFlag = false;

        }else{

            if(reportKey){

                d.openFlag = true;

            }

        }

    }

}

function update(source) {

    // Compute the new tree layout转换数据

    var nodes = tree.nodes(root).reverse(),

        links = tree.links(nodes);

    // Normalize for fixed-depth.

    nodes.forEach(function(d) { d.y = d.depth * 240; });

    // Update the nodes…

    var node = svg.selectAll("g.node")

        .data(nodes, function(d) { return d.id || (d.id = ++i); });

    // Enter any new nodes at the parent's previous position.

    var nodeEnter = node.enter().append("g")

        .attr("class", "node")

        .attr("transform", function(d) { return "translate(" + source.y0 + "," + source.x0 + ")"; }); //css3属性 二维动画

    var htm = "<div class='infoBox'>123</div>";

    //写文字的变迁

    nodeEnter.append("circle")          //画圆

        .attr("x","0px")

        .attr("y", "10px")              //x,y代表坐标,注意在group元素中,坐标是指在该元素中的相对坐标

        .attr("cx","0px")

        .attr("cy", "0px")

        .attr("dy", ".35em")

        .attr("text-anchor", "middle")

        .style("fill-opacity", 1)         //透明度 显示隐藏用display(none,block)

        .style("fill", function (d) {    //填充颜色

            return d.openFlag ? "#fff":"#12a566"

        })

        .on("click", click)             //给元素添加事件

        .on("mouseover",hover);

    nodeEnter.append("text")          //text标签

        .attr("class", "tablename")

        .attr("x","0px")

        .attr("y", "15px")

        .attr("dy", ".35em")

        .attr("text-anchor", "middle")

        .attr("width","60")

        .attr("height","45")

        .text(function(d) { return "表名" + d.tablename; })  //文字

        .style("display",showTableName?"block":"none")

        .style("fill-opacity", 1e-6);

    ......

// Transition nodes to their new position.

    var nodeUpdate = node.transition()

        .duration(duration)

        .attr("transform", function(d) { return "translate(" + d.y + "," + d.x + ")"; });

    nodeUpdate.select("circle")

        .attr("r", 4.5)

        .style("fill", function(d) { return d.openFlag ? "#fff":"#12a566" });

    nodeUpdate.select("text")

        .style("fill-opacity", 1);

    // Transition exiting nodes to the parent's new position.

    var nodeExit = node.exit().transition()

        .duration(duration)

        .attr("transform", function(d) { return "translate(" + source.y + "," + source.x + ")"; })

        .remove();

    nodeExit.select("circle")

        .attr("r", 1e-6);

    nodeExit.select("text")

        .style("fill-opacity", 1e-6);

    // Update the links…

    var link = svg.selectAll("path.link")

        .data(links, function(d) { return d.target.id; });

    // Enter any new links at the parent's previous position.

    link.enter().insert("path", "g")

        .attr("class", "link")

        .attr("d", function(d) {

            var o = {x: source.x0, y: source.y0};

            return diagonal({source: o, target: o});

        });

    // Transition links to their new position.

    link.transition()

        .duration(duration)

        .attr("d", diagonal);

    // Transition exiting nodes to the parent's new position.

    link.exit().transition()

        .duration(duration)

        .attr("d", function(d) {

            var o = {x: source.x, y: source.y};

            return diagonal({source: o, target: o});

        })

        .remove();

    // Stash the old positions for transition.

    nodes.forEach(function(d) {

        d.x0 = d.x;

        d.y0 = d.y;

    });

}

// Toggle children on click.

function click(d) {

    if(d.childHasShowed){//已经加载出child

        //收起 d.children 展开 d._children;

        if (d.children) {

            d._children = d.children;

            d.children = null;

            d.openFlag = false;

        } else {

            d.children = d._children;

            d._children = null;

            d.openFlag = true;

        }

        update(d);

    }else{

        //点击加载child

        getDepenInfo(d.tablename, true, true ,d);

        // d.children = obj.children;

        // update(d);

    }

}

function hover(d) {

    console.log("over")

}
SVG--D3--血缘关系树的更多相关文章
- 用D3.js画树状图
做项目遇到一个需求,将具有层级关系的词语用树状图的形式展示它们之间的关系,像这样: 或者是这样: 上面的图片只是样例,跟我下面的代码里面用的数据不同 网上有很多这种数据可视化展示的js控件,我这里选择 ...
- 基于spark logicplan的表血缘关系解析实现
随着公司平台用户数量与表数量的不断增多,各种表之间的数据流向也变得更加复杂,特别是某个任务中会对源表读取并进行一系列复杂的变换后又生成新的数据表,因此需要一套表血缘关系解析机制能清晰地解析出每个任务所 ...
- svg + d3
为了实现元素的添加,删除,拖拽,左键点击,右键单击,悬浮等功能,使用了d3 + svg 的技术来实现界面. 最开始是采用canvas,但是由于功能原因放弃了该技术,可以看下 canvas简介 另附:c ...
- d3生成的树状图
<!DOCTYPE html> <html lang="en"> <head> <meta charset="UTF-8&quo ...
- 基于MaxCompute InformationSchema进行血缘关系分析
一.需求场景分析 在实际的数据平台运营管理过程中,数据表的规模往往随着更多业务数据的接入以及数据应用的建设而逐渐增长到非常大的规模,数据管理人员往往希望能够利用元数据的分析来更好地掌握不同数据表的血缘 ...
- 一款好用的数据血缘关系在线工具--SQLFlow
l 数据血缘关系(data lineage) 数据血缘属于数据治理中的一个概念,是在数据溯源的过程中找到相关数据之间的联系,它是一个逻辑概念.数据治理中经常提到血缘分析,血缘分析是保证数据融合的 ...
- 血缘关系分析工具SQLFLOW--实践指南
SQLFlow 是用于追溯数据血缘关系的工具,它自诞生以来以帮助成千上万的工程师即用户解决了困扰许久的数据血缘梳理工作. 数据库中视图(View)的数据来自表(Table)或其他视图,视图中字段(Co ...
- 使用grabit分析mysql数据库中的数据血缘关系
使用grabit分析mysql数据库中的数据血缘关系 Grabit 是一个辅助工具,用于从数据库.GitHub 等修订系统.bitbucket 和文件系统等各种来源收集 SQL 脚本和存储过程,然后将 ...
- d3实现家族树
1. jQuery和CSS3支持移动手机的DOM元素移动和缩放插件:panzoom 2.拖动:jqueryUI-Draggable.touchpunch 3.图表:echart.heig ...
随机推荐
- 《穷查理年鉴》习惯 & 工作 & 自省 & 自律 (关于自己)
习惯 001.在那充满古老年鉴的年代里,扔掉你的恶行,不管它们曾经给你带来多大的好处. 002.许多关于预言的争论都可以简化为:当你说是时,就有人说浊;当你认为不是时,一定有人说是. 003.坏习惯和 ...
- Vue.js 学习笔记之四:Vue 组件基础
到目前为止,这个系列的笔记所展示的都是一些极为简单的单页面 Web 应用程序,并且页面上通常只有几个简单的交互元素.但在实际生产环境中,Web 应用程序的用户界面往往是由多个复杂的页面共同组成的.这时 ...
- navicat 生成注册码( 仅供学习使用 )
前言,由于navicat使用比较顺手,刚好前段时间试用期到,又看看了怎么生成注册码,特地记录下使用 . 1.运行 找到 navicat 文件(exe) 2.生成注册文件(报错好,后续会用到) 3.断网 ...
- javascript里面的this指向问题
1:一般情况下this最终指向调用它的那个对象. 2:全局作用域或者普通函数中的this都会指向window. 例1:console.log(this); // 在控制台输出的是BOM顶级对象 wi ...
- 实验一 HTML基本标签及文本处理
实验一 HTML基本标签及文本处理 [实验目的] 1.掌握利用因特网进行信息游览.搜索,下载网页.图片.文字和文件: 2.对给定的网站,能指出网站的链接结构.目录结构.页面布局方式: 3.掌握HTML ...
- 多测师讲解自动化测试_rf节课内容_高级讲师肖sir
*** Settings ***Library Selenium2LibraryLibrary OperatingSystem *** Variables ***${name} zhangsan@{l ...
- 485hub
485hub 485hub ZLAN9480A是一款可通过一路RS485主口扩展出8路RS485从口的工业级隔离型8口RS485集线器.可以有效的实现RS485网络的中继.扩展与隔离. ZLAN948 ...
- day06 Pyhton学习
一.昨日内容回顾 字典: 由{}表示,内部存储key:value 要求: key不能重复 key必须可哈希.不可变 value没有限制 没有索引和切片 增删改查 新增: dic.[新key]=valu ...
- echo输出彩色文字
开启转义功能 echo -e表示开启转义功能,比如: 彩色文字语法 echo -e "\e[前景;背景;特效m""hello""\e[0m" ...
- Java9第四篇-Reactive Stream API响应式编程
我计划在后续的一段时间内,写一系列关于java 9的文章,虽然java 9 不像Java 8或者Java 11那样的核心java版本,但是还是有很多的特性值得关注.期待您能关注我,我将把java 9 ...