Linux 磁盘使用查看 查看使用磁盘程序 Monitoring disk activity in linux
5 TOOLS FOR MONITORING DISK ACTIVITY IN LINUX
Here is a quick overview of 5 command-line tools that come in incredibly handy when troubleshooting or monitoring real-time disk activity in Linux. These tools are available in all major Linux distros.
IOSTAT
iostat can be used to report the disk read/write rates and counts for an interval continuously. It collects disk statistics, waits for the given amount of time, collects them again and displays the difference. Here is the output of the command iostat -y 5:

Each report, every 5 seconds, include the CPU stats and the disk stats. The CPU stats is a break up of where CPU time was spent during the interval. The disk stats includes the number of I/O requests per second (tps), the rate of read and write (kB_read/s and kB_write/s) and the amount of data read and written (kB_read and kB_wrtn).
The -y argument instructs iostat to discard the first report which are the stats since boot and are rarely useful. The “5” in the command line specifies the interval in seconds. The CPU stats can be omitted by including the -dflag, although practically it is useful to have it there.
IOTOP
iotop is a top-like utility for displaying real-time disk activity. It can list the processes that are performing I/O, alongwith the disk bandwidth they are using. Here is how iotop -o looks like:
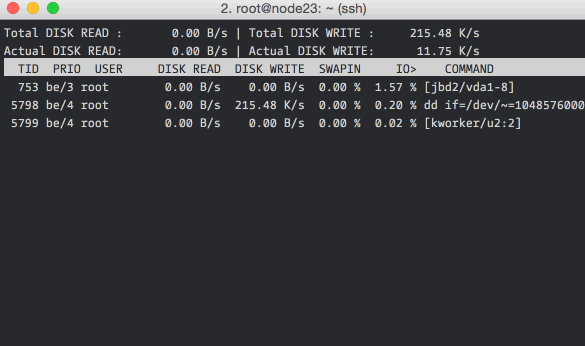
The -o flag restricts the display to processes that are doing I/O, omitting it shows all the processes. You can also see the total disk bandwidth usage on the top two lines.
In case you are wondering, the “total” values show the amount of data read from or written to the disk block device driver, and the “actual” values show the numbers for the actual hardware disk I/O. File system caching is one of the reasons for the difference in the values.
DSTAT
dstat is a little more user-friendly version of iostat, and can show much more information than just disk bandwidth. Here is dstat in action, showing cpu and disk stats:
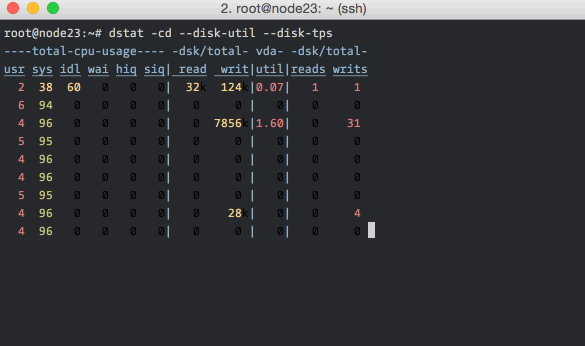
As you can see, it has nicely colored output. The command-line flags include -c for CPU stats, -d for disk stats, --disk-util for disk utilization and --disk-tps for disk transactions (I/O requests) per second. You can read more about dstat here.
ATOP
atop is particularly good for quickly grasping changes happening to the system. It does an excellent job of summarizing changes in each interval. Unlike the others, it can list all the processes that caused any system-level changes (like doing disk I/O) during the interval – this feature is present only in atop.
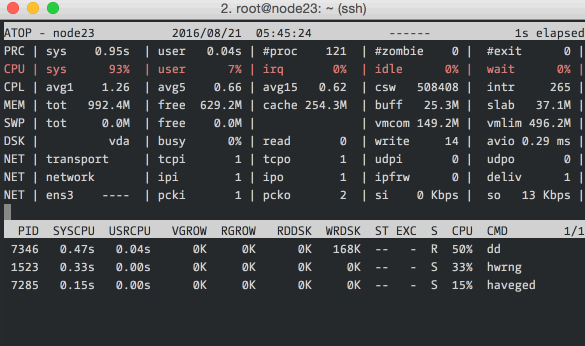
Here we’re running atop with an interval of 1 second. The top section should be read from left to right: PRC shows process information, CPU the split of CPU usage, CPL the load averages, MEM the memory usage, SWP the swap file usage and DSK and NET the disk and network information respectively. The bottom section shows processes that did interesting things during the interval. You can read more about atop here.
IOPING
ioping is a quick and dirty storage volume latency checker. It is useful for checking if the elevated disk times that you’re seeing are because of a degradation of the underlying virtual disk / network / hardware.
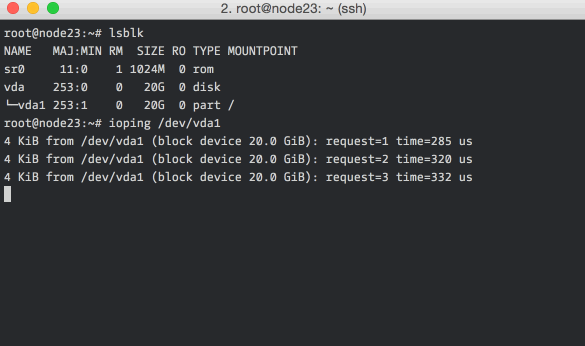
Low numbers (<1ms) and low variance in the numbers are indicators of a healthy storage volume.
CLOSING NOTES
All the tools listed above have more features and options, here are good places to start digging further: iostat,iotop, dstat, atop and ioping.
If you’re interested in measuring disk performance, you should definitely also look at fio and sysbench. Both are fairly complicated, but are standard tools for the job.
Linux 磁盘使用查看 查看使用磁盘程序 Monitoring disk activity in linux的更多相关文章
- linux 磁盘挂载及查看磁盘
blkid命令实例 .列出当前系统中所有已挂载文件系统的类型: sudo blkid .显示指定设备 UUID: sudo blkid -s UUID /dev/sda5 .显示所有设备 UUID: ...
- Linux Centos下查看cpu、磁盘、内存使用情况,关闭MySQL日志
Linux Centos下查看cpu.磁盘.内存使用情况,关闭MySQL日志 lsblk 查看分区和磁盘df -h 查看空间使用情况fdisk -l 分区工具查看分区信息cfdisk /dev/sda ...
- Linux命令_磁盘管理_查看磁盘或目录的容量
软件环境:虚拟机VM12,Linux版本 CentOS 7.3 命令 df (disk filesystem) 用于查看已挂载磁盘的总容量.使用容量.剩余容量等,可以不加任何参数,默认以KB为单位显示 ...
- 【linux】linux磁盘空间 目录查看清理 和 文件查看清理
=========================大目录排查============================= 一.首先查看磁盘挂载,磁盘空间使用情况 1.进入根路径 cd / 2.查看磁盘挂 ...
- [转帖]linux下使用 du查看某个文件或目录占用磁盘空间的大小
linux下使用 du查看某个文件或目录占用磁盘空间的大小 du -ah --max-depth= 去年用过一次 后来忘记了.. 命令这个东西 熟能生巧.. https://www.cnblogs.c ...
- 未加星标 Linux磁盘下查看I/O磁盘的性能
iostat查看linux硬盘IO性能 rrqm/s:每秒进行merge的读操作数目.即delta(rmerge)/s wrqm/s:每秒进行merge的写操作数目.即delta(wmerge)/s ...
- 磁盘io负载查看
转自:http://blog.csdn.net/i_am_jojo/article/details/7698458 为了方便各位和自己今后遇到此类问题能尽快解决,我这里将查看linux服务器硬盘IO访 ...
- mysql数据库查看各实例磁盘占用情况
1.总体查看: use information_schema; select TABLE_SCHEMA, concat(truncate(sum(data_length)/1024/1024,2),' ...
- 脚本_查看所有虚拟机磁盘以及 CPU 的使用量
#!bin/bash#作者:liusingbon#功能:查看所有虚拟机磁盘使用量以及 CPU 使用量信息read -p "按任意键进入查看页面.比如按下Enter键" keyvir ...
随机推荐
- 第二十八节:Java基础-进阶继承,抽象类,接口
前言 Java基础-进阶继承,抽象类,接口 进阶继承 class Stu { int age = 1; } class Stuo extends Stu { int agee = 2; } class ...
- 仿B站项目(4)webpack打包第三方库jQuery
概述 在项目中不可避免的会用到jquery等第三方库,来看看有什么问题,怎么解决. 遇到的问题 一般情况下,直接require第三方库,比如jquery,然后webpack会自动把第三方库打包进bun ...
- Win10手记-IIS部署网站问题解决
最近在自己的Win10电脑上尝试部署ASP.NET网站时出现了问题,经过多方查找定位到IIS为问题来源. 开始之前 先描述下技术环境: 1.Windows 10 PC 2.Windows 自带的IIS ...
- Javascript:alert(1)可以这样写以绕过filter
在2011年的BlackHat DC 2011大会上Ryan Barnett给出了一段关于XSS的示例javascript代码: ($=[$=[]][(__=!$+$)[_=-~-~-~$]+({}+ ...
- 从零开始学 Web 之 移动Web(九)微金所案例
大家好,这里是「 从零开始学 Web 系列教程 」,并在下列地址同步更新...... github:https://github.com/Daotin/Web 微信公众号:Web前端之巅 博客园:ht ...
- Docker容器绑定外部IP和端口
Docker允许通过外部访问容器或者容器之间互联的方式来提供网络服务. 以下操作通过myfirstapp镜像模拟,如何制作myfirstapp镜像请点击此处. 1.外部访问容器容器启动之后,容器中可以 ...
- Linux 定时任务 crontab 和 Systemd Timer
一.说说八卦 说到定时任务,我们常用的就是 crond 服务,但是我们不知道还有另外一种定时方式,那就是 systemd,我们常用 systemd 来管理我们的服务,但是我们却不知道,我们还可以通 ...
- Find the Top 10 commands in your linux box!
history | awk '{print $2;}' | grep -v '^./' | sort -d | uniq -c | sort -nr | head -n 10 grep, '-v' ...
- java使用java.lang.management监视和管理 Java 虚拟机
ClassLoadingMXBean 用于 Java 虚拟机的类加载系统的管理接口. CompilationMXBean 用于 Java 虚拟机的编译系统的管理接口. GarbageCollector ...
- filter listener interceptor的区别
转自: http://www.cnblogs.com/shangxiaofei/p/5328377.html https://www.cnblogs.com/jinb/p/6915351.html 一 ...