
[转帖]如何对minio进行性能测试和分析
https://developer.aliyun.com/article/1006775
环境详情
server(组成集群,ec为12:4)
| ip | hosts | 硬盘 |
| storage01 | 172.16.50.1 | 12*10T |
| storage02 | 172.16.50.2 | 12*10T |
| storage03 | 172.16.50.3 | 12*10T |
| storage04 | 172.16.50.4 | 12*10T |
client
| ip | host |
| headnode | 172.16.50.5 |
| node02 | 172.16.50.6 |
| node03 | 172.16.50.7 |
| node04 | 172.16.50.8 |
为什么选择speedtest和warp作为测试工具?
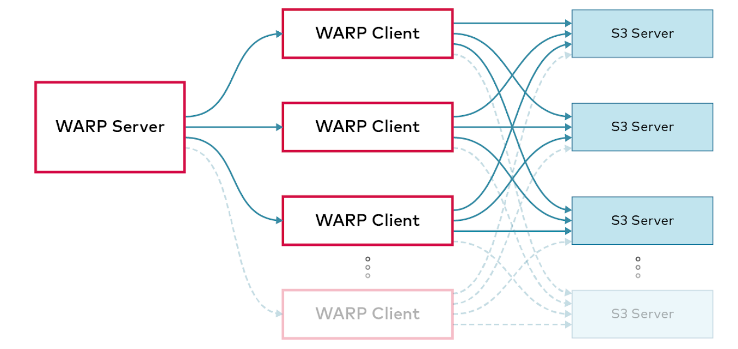
speedtest是一个易用的测试工具,它会先运行PUTS,然后运行GETS,通过增量的方式测试得到最大吞吐量。而warp则是一个完整的工具链,提供了很独立的测试项,能够测试GET;PUT;DELETE等都可以测试得到。同时通过cs的结构设计,更符合真实的使用场景,得到最贴近应用的性能结果,有利于性能分析。
warp结构如下图所示
环境详情
server(组成集群,ec为12:4)
| ip | hosts | 硬盘 |
| storage01 | 172.16.50.1 | 12*10T |
| storage02 | 172.16.50.2 | 12*10T |
| storage03 | 172.16.50.3 | 12*10T |
| storage04 | 172.16.50.4 | 12*10T |
client
| ip | host |
| headnode | 172.16.50.5 |
| node02 | 172.16.50.6 |
| node03 | 172.16.50.7 |
| node04 | 172.16.50.8 |
为什么选择speedtest和warp作为测试工具?
speedtest是一个易用的测试工具,它会先运行PUTS,然后运行GETS,通过增量的方式测试得到最大吞吐量。而warp则是一个完整的工具链,提供了很独立的测试项,能够测试GET;PUT;DELETE等都可以测试得到。同时通过cs的结构设计,更符合真实的使用场景,得到最贴近应用的性能结果,有利于性能分析。
warp结构如下图所示
开始测试
speedtest
- 开始前需要下载minio client
wget https://dl.min.io/client/mc/release/linux-amd64/mc

chmod +x mc

mv mc /usr/local/bin/
- 写入host到/etc/hosts
- 配置客户端
/usr/local/bin/mc alias set minio http://172.16.50.1:9000 <YOUR-ACCESS-KEY> <YOUR-SECRET-KEY>
- 开始测试,执行(以前叫speedtest,现在修改成support perf了)
/usr/local/bin/mc support perf minio/<bucket>
这里可以得到一个网络、硬盘和吞吐量的结果
NODE                    RX              TX

http://storage01:9000   1.8 GiB/s       2.0 GiB/s

http://storage02:9000   1.8 GiB/s       2.0 GiB/s

http://storage03:9000   2.7 GiB/s       2.5 GiB/s

http://storage04:9000   2.4 GiB/s       2.2 GiB/s

NetPerf:

NODE                    PATH    READ            WRITE

http://storage02:9000   /data1  192 MiB/s       235 MiB/s

http://storage02:9000   /data2  219 MiB/s       240 MiB/s

http://storage02:9000   /data3  186 MiB/s       262 MiB/s

http://storage02:9000   /data4  191 MiB/s       230 MiB/s

http://storage02:9000   /data5  179 MiB/s       221 MiB/s

http://storage02:9000   /data6  170 MiB/s       222 MiB/s

http://storage02:9000   /data7  200 MiB/s       219 MiB/s

http://storage02:9000   /data8  198 MiB/s       230 MiB/s

http://storage02:9000   /data9  166 MiB/s       207 MiB/s

http://storage02:9000   /data10 206 MiB/s       209 MiB/s

http://storage02:9000   /data11 198 MiB/s       213 MiB/s

http://storage02:9000   /data12 164 MiB/s       205 MiB/s

http://storage04:9000   /data1  172 MiB/s       259 MiB/s

http://storage04:9000   /data2  201 MiB/s       250 MiB/s

http://storage04:9000   /data3  218 MiB/s       256 MiB/s

http://storage04:9000   /data4  188 MiB/s       245 MiB/s

http://storage04:9000   /data5  157 MiB/s       197 MiB/s

http://storage04:9000   /data6  155 MiB/s       205 MiB/s

http://storage04:9000   /data7  154 MiB/s       210 MiB/s

http://storage04:9000   /data8  143 MiB/s       185 MiB/s

http://storage04:9000   /data9  181 MiB/s       207 MiB/s

http://storage04:9000   /data10 174 MiB/s       214 MiB/s

http://storage04:9000   /data11 173 MiB/s       218 MiB/s

http://storage04:9000   /data12 178 MiB/s       206 MiB/s

http://storage03:9000   /data1  194 MiB/s       337 MiB/s

http://storage03:9000   /data2  204 MiB/s       267 MiB/s

http://storage03:9000   /data3  212 MiB/s       261 MiB/s

http://storage03:9000   /data4  200 MiB/s       235 MiB/s

http://storage03:9000   /data5  168 MiB/s       216 MiB/s

http://storage03:9000   /data6  209 MiB/s       221 MiB/s

http://storage03:9000   /data7  179 MiB/s       222 MiB/s

http://storage03:9000   /data8  170 MiB/s       220 MiB/s

http://storage03:9000   /data9  144 MiB/s       186 MiB/s

http://storage03:9000   /data10 142 MiB/s       172 MiB/s

http://storage03:9000   /data11 149 MiB/s       171 MiB/s

http://storage03:9000   /data12 132 MiB/s       206 MiB/s

http://storage01:9000   /data1  99 MiB/s        119 MiB/s

http://storage01:9000   /data2  103 MiB/s       114 MiB/s

http://storage01:9000   /data3  104 MiB/s       114 MiB/s

http://storage01:9000   /data4  98 MiB/s        186 MiB/s

http://storage01:9000   /data5  186 MiB/s       261 MiB/s

http://storage01:9000   /data6  224 MiB/s       251 MiB/s

http://storage01:9000   /data7  188 MiB/s       240 MiB/s

http://storage01:9000   /data8  222 MiB/s       252 MiB/s

http://storage01:9000   /data9  185 MiB/s       247 MiB/s

http://storage01:9000   /data10 209 MiB/s       236 MiB/s

http://storage01:9000   /data11 191 MiB/s       224 MiB/s

http://storage01:9000   /data12 222 MiB/s       250 MiB/s

DrivePerf:

        THROUGHPUT      IOPS

PUT     1.3 GiB/s       21 objs/s

GET     4.2 GiB/s       67 objs/s

MinIO 2022-08-25T07:17:05Z, 4 servers, 48 drives, 64 MiB objects, 62 threads

ObjectPerf:
我们其实还可以按需做一些调整,做一些独立的测试。比如只需要测量object的读写速度,可以使用下述命令
mc support perf object minio
同理,我们也可以单独测量硬盘或者网络吞吐量,如下述命令
# driver

root@storage01:~# mc support perf object minio

        THROUGHPUT      IOPS

PUT     1.6 GiB/s       26 objs/s

GET     4.0 GiB/s       63 objs/s

MinIO 2022-08-25T07:17:05Z, 4 servers, 48 drives, 64 MiB objects, 27 threads

ObjectPerf:
# throughtput

root@storage01:~# mc support perf net minio

NODE                    RX              TX

http://storage01:9000   1.9 GiB/s       2.1 GiB/s

http://storage02:9000   2.4 GiB/s       2.2 GiB/s

http://storage03:9000   2.6 GiB/s       2.4 GiB/s

http://storage04:9000   2.1 GiB/s       2.3 GiB/s

NetPerf:
也可以选择在指定时间内测试指定大小的对象的读写速度
root@storage01:~# mc support perf object minio --duration 20s --size 128MiB

        THROUGHPUT      IOPS

PUT     2.3 GiB/s       18 objs/s

GET     3.8 GiB/s       30 objs/s

MinIO 2022-08-25T07:17:05Z, 4 servers, 48 drives, 128 MiB objects, 41 threads

ObjectPerf:
warp
在开始测试之前,需要在客户端上安装warp,GitHub - minio/warp: S3 benchmarking tool这里面有多个版本可供选择,建议使用二进制包,比较省事。
wget https://github.com/minio/warp/releases/download/v0.6.2/warp_0.6.2_Linux_x86_64.tar.gz

mkdir warp

tar zxf warp_0.6.2_Linux_x86_64.tar.gz -C warp

# 执行客户端

./warp client
执行后,默认开启7761端口,假如配置了防火墙还需要放行该端口才行,我这里没有配置,所以就不演示了
在所有客户端开启warp后,我们可以选择启动一台执行warp混合基准测试了
warp mixed --duration=3m --warp-client=headnode --warp-client=node0{2...3} --host=storage0{1...4}:9000 --access-key=minio --secret-key=miniodev

warp: Benchmark data written to "warp-remote-2022-09-03[172425]-Fj1O.csv.zst"

Mixed operations.

Operation: DELETE, 10%, Concurrency: 40, Ran 2m58s.

 * Throughput: 18.47 obj/s

Operation: GET, 45%, Concurrency: 40, Ran 2m58s.

 * Throughput: 831.05 MiB/s, 83.11 obj/s

Operation: PUT, 15%, Concurrency: 40, Ran 2m58s.

 * Throughput: 276.45 MiB/s, 27.65 obj/s

Operation: STAT, 30%, Concurrency: 40, Ran 2m58s.

 * Throughput: 55.30 obj/s

Cluster Total: 1106.95 MiB/s, 184.46 obj/s over 2m58s.
我们也可以单独对GET操作进行压力测试得到最大的写入吞吐量
接下来我们对DELETE操作进行测试
root@headnode:~# warp delete --duration=3m --warp-client=headnode --warp-client=node0{2...3} --host=storage0{1...4}:9000 --access-key=minio --secret-key=miniodev

warp: Benchmark data written to "warp-remote-2022-09-03[173528]-1d62.csv.zst"

----------------------------------------

Operation: PUT

* Average: 0.56 MiB/s, 576.46 obj/s

Throughput by host:

 * http://storage01:9000: Avg: 0.14 MiB/s, 144.36 obj/s

 * http://storage02:9000: Avg: 0.14 MiB/s, 143.90 obj/s

 * http://storage03:9000: Avg: 0.14 MiB/s, 143.78 obj/s

 * http://storage04:9000: Avg: 0.14 MiB/s, 144.32 obj/s

Throughput, split into 86 x 1s:

 * Fastest: 655.8KiB/s, 655.89 obj/s

 * 50% Median: 584.4KiB/s, 584.43 obj/s

 * Slowest: 438.5KiB/s, 438.49 obj/s

----------------------------------------

Operation: DELETE

* Average: 897.41 obj/s

Throughput by host:

 * http://storage01:9000: Avg: 225.39 obj/s

 * http://storage02:9000: Avg: 221.08 obj/s

 * http://storage03:9000: Avg: 220.70 obj/s

 * http://storage04:9000: Avg: 222.31 obj/s

Throughput, split into 41 x 1s:

 * Fastest: 998.26 obj/s

 * 50% Median: 890.61 obj/s

 * Slowest: 861.53 obj/s

warp: Cleanup done

对DELETE操作进行测试

root@headnode:~# warp stat --autoterm --duration=3m --warp-client=headnode --warp-client=node0{2...3} --host=storage0{1...4}:9000 --access-key=minio --secret-key=miniodev

warp: Benchmark data written to "warp-remote-2022-09-03[173008]-vsV9.csv.zst"

----------------------------------------

Operation: PUT

* Average: 0.56 MiB/s, 584.19 obj/s

Throughput by host:

 * http://storage01:9000: Avg: 0.14 MiB/s, 145.46 obj/s

 * http://storage02:9000: Avg: 0.14 MiB/s, 145.46 obj/s

 * http://storage03:9000: Avg: 0.14 MiB/s, 145.32 obj/s

 * http://storage04:9000: Avg: 0.14 MiB/s, 144.19 obj/s

Throughput, split into 33 x 1s:

 * Fastest: 609.4KiB/s, 624.07 obj/s

 * 50% Median: 585.7KiB/s, 599.81 obj/s

 * Slowest: 499.3KiB/s, 511.37 obj/s

----------------------------------------

Operation: STAT

* Average: 10262.16 obj/s

Throughput by host:

 * http://storage01:9000: Avg: 2549.94 obj/s

 * http://storage02:9000: Avg: 2566.62 obj/s

 * http://storage03:9000: Avg: 2572.47 obj/s

 * http://storage04:9000: Avg: 2572.58 obj/s

Throughput, split into 179 x 1s:

 * Fastest: 10622.95 obj/s

 * 50% Median: 10268.04 obj/s

 * Slowest: 9574.31 obj/s

warp: Cleanup done.

将文件切片分批上传性能测试

root@headnode:~# warp multipart --parts=500 --part.size=10MiB --warp-client=headnode --warp-client=node0{2...3} --host=storage0{1...4}:9000 --access-key=minio --secret-key=miniodev

warp: Benchmark data written to "warp-remote-2022-09-03[174331]-AWo5.csv.zst"

----------------------------------------

Operation: PUT

* Average: 559.26 MiB/s, 55.93 obj/s

Throughput by host:

 * http://storage01:9000: Avg: 137.98 MiB/s, 13.80 obj/s

 * http://storage02:9000: Avg: 140.59 MiB/s, 14.06 obj/s

 * http://storage03:9000: Avg: 138.60 MiB/s, 13.86 obj/s

 * http://storage04:9000: Avg: 141.93 MiB/s, 14.19 obj/s

Throughput, split into 16 x 1s:

 * Fastest: 616.2MiB/s, 61.62 obj/s

 * 50% Median: 562.9MiB/s, 56.29 obj/s

 * Slowest: 437.3MiB/s, 43.73 obj/s

----------------------------------------

Operation: GET

* Average: 1026.15 MiB/s, 102.62 obj/s

Throughput by host:

 * http://storage01:9000: Avg: 254.73 MiB/s, 25.47 obj/s

 * http://storage02:9000: Avg: 257.86 MiB/s, 25.79 obj/s

 * http://storage03:9000: Avg: 257.91 MiB/s, 25.79 obj/s

 * http://storage04:9000: Avg: 255.68 MiB/s, 25.57 obj/s

Throughput, split into 298 x 1s:

 * Fastest: 1133.4MiB/s, 113.34 obj/s

 * 50% Median: 1030.0MiB/s, 103.00 obj/s

 * Slowest: 876.0MiB/s, 87.60 obj/s

warp: Cleanup done.
好的,以上就是我做的一些测试和总结,希望对大家有帮助
[转帖]如何对minio进行性能测试和分析的更多相关文章
- LoadRunner性能测试结果分析
LoadRunner性能测试结果分析http://www.docin.com/p-793607435.html
- Greenplum 简单性能测试与分析
如今,多样的交易模式以及大众消费观念的改变使得数据库应用领域不断扩大,现代的大型分布式应用系统的数据膨胀也对数据库的海量数据处理能力和并行处理能力提出了更高的要求,如何在数据呈现海量扩张的同时提高处理 ...
- Apache ab性能测试结果分析
Apache ab性能测试结果分析 测试场景:模拟10个用户,对某页发起总共100次请求. 测试命令: ab -n 100 -c 10 地址 测试报告: Server Software: 被测服务器软 ...
- LoadRunner性能测试结果分析(转载)
性能测试的需求指标:本次测试的要求是验证在30分钟内完成2000次用户登录系统,然后进行考勤业务,最后退出,在业务操作过程中页面的响应时间不超过3秒,并且服务器的CPU使用率.内存使用率分别不超过75 ...
- Web项目性能测试结果分析
1.测试结果分析 LoadRunner性能测试结果分析是个复杂的过程,通常可以从结果摘要.并发数.平均事务响应时间.每秒点击数.业务成功率.系统资源.网页细分图.Web服务器资源.数据库服务器资源等几 ...
- PAAS平台的web应用性能测试与分析
引言 为什么我会写这一篇博客,因为最近很多京东云擎jae的用户反应一个问题就是他们部署在jae上面的应用访问很慢,有极少数应用甚至经常出现504超时现象,当然大家首先想到的是jae性能太差,这也是人之 ...
- 9.2专项测试-Android性能测试黑盒分析-1
1. 专项测试 业务测试:面向新需求 回归测试:面向已交付需求 专项测试:面向非功能需求的各类质量唯独特征 表现 用户维度 技术维度 崩溃 crash,弱网 检测崩溃1.某个页面,因为研发处理不合适, ...
- 基于web网站项目的性能测试结果分析
业务背景: 最近公司研发了一款对并发要求比较高的web项目,需要对其压力测试,模拟线上可能存在的问题,这个过程中遇到一些很多问题,这里重新梳理一下思路,希望能给遇到同样问题的小伙伴提供一个参考. 工具 ...
- Jmeter性能测试指标分析
一.Aggregate Report 是 JMeter 常用的一个 Listener,中文被翻译为"聚合报告 如果大家都是做Web应用的性能测试,例如访问百度请求为例,线程10,循环10次, ...
- 性能测试-性能分析思路以及CPU
1.性能分析思路 性能测试分析的思路:先分析硬件 .网络. 系统配置.应用程序 硬件: cpu.内存.磁盘.网络.io 4.常见问题处理4.1 常见问题及解决方法如果r经常大于4,且id经常少于40, ...
随机推荐
- Blazor快速开发框架Known-V2.0.0
Known2.0 Known是基于Blazor的企业级快速开发框架,低代码,跨平台,开箱即用,一处代码,多处运行. 官网:http://known.pumantech.com Gitee: https ...
- 14、Flutter Card卡片组件
Card是卡片组件块,内容可以由大多数类型的Widget构成,Card具有圆角和阴影,这让它看起来有立 体感. Card实现一个通讯录的卡片 class MyApp2 extends Stateles ...
- vue 遍历的汉字显示不同的颜色
<template> <div> <div class="stars"> <span v-for="(star, index) ...
- 华为云GaussDB圈层活动走进香港,以技术创新构筑金融政企数智发展基石
摘要:近日,华为云GaussDB圈层活动在中国·香港如期举办,活动聚集了22家香港金融政企客户和合作伙伴. 本文分享自华为云社区<华为云GaussDB圈层活动走进香港,赋能金融政企数字化转型&g ...
- KubeEdge在国家工业互联网大数据中心的架构设计与应用
摘要:在18年的时候,工信部开展了一个叫国家创新发展工程,这个工程中提出了要建立一个国家工业大数据中心,中国移动在其中承担了边缘协同与数据采集相关功能的研发.本文将从该项目背景下面临的问题与挑战.技术 ...
- 华为云“网红”语言Python课程来啦!
摘要:来华为云社区学Python,瓜分40万码豆还有HUAWEI GT手表拿! 现代职场大量重复性的工作.日报周报月报无穷无尽.不计其数的数据提取.琐碎繁杂的事物让工作效率极低. 而Python的出现 ...
- AI论文解读丨融合视觉、语义、关系多模态信息的文档版面分析架构VSR
摘要:文档版式分析任务中,文档的视觉信息.文本信息.各版式部件间的关系信息都对分析过程具有很重要的作用.本文提出一种融合视觉.文本.关系多模态信息的版式分析架构VSR. 本文分享自华为云社区<论 ...
- 火山引擎 DataTester:一次 A/B 测试,帮助产品分享率提升超 20%
更多技术交流.求职机会,欢迎关注字节跳动数据平台微信公众号,并进入官方交流群 对 C 端产品而言,增长的核心要素之一是用户活跃度.通过各类激发互动的方式,使信息得以在关系链中流转.传播,达成有效的信息 ...
- HanLP — HMM隐马尔可夫模型 -- 语料库
隐马尔可可夫模型(Hidden Markov Model,HMM)是统计模型,用于描述一个含有隐含未知参数的马尔可夫过程. HMM由初始概率分布.状态转移概率分布和观测概率分布确定. BMES =&g ...
- PPT 动态迷幻图谱
迷幻动画的本质拆解 插件: islide + 软件: PowerPoint https://www.islide.cc/ 圆型 画一个正圆,无填充色,边框 2.25磅 左边红色.右边黄色.中间两个透明 ...