
lldb调试C++总结(1)
Note
好记性不如烂笔头。时间一长,lldb的基本功快忘本了。
- 本文将介绍使用
lldb调试 C++程序的基本用法。 - 演示基于
Ubuntu + lldb
lldb + clang(++) 版本
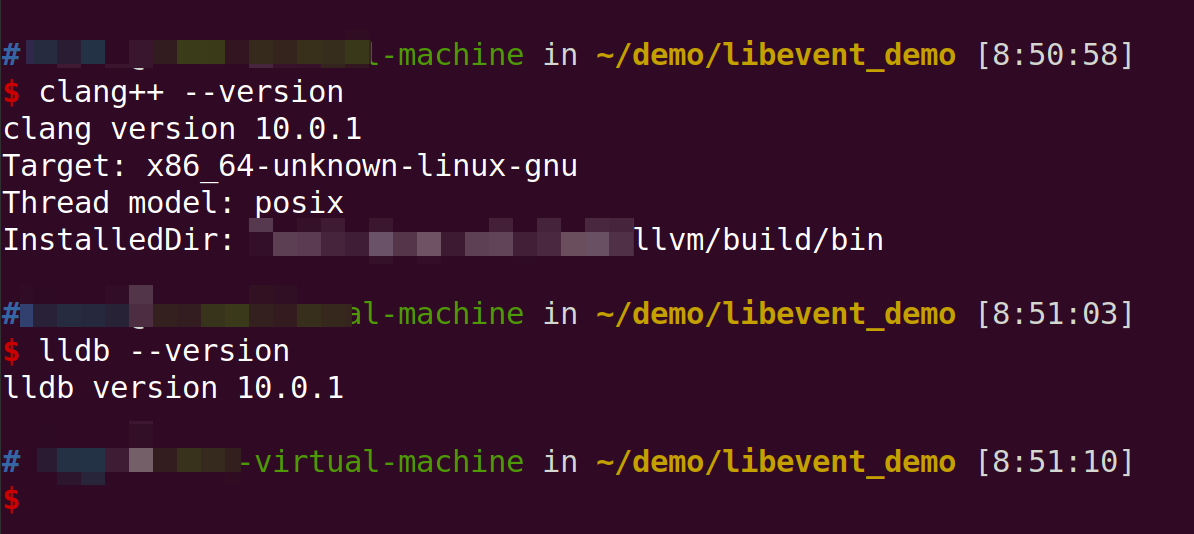
源码编译,可能和你使用的不一样,but, lldb的语法差不多的。
lldb help
USAGE: lldb [options]

ATTACHING:

  --attach-name <name> Tells the debugger to attach to a process with the given name.

  --attach-pid <pid>   Tells the debugger to attach to a process with the given pid.

  -n <value>           Alias for --attach-name

  -p <value>           Alias for --attach-pid

  --wait-for           Tells the debugger to wait for a process with the given pid or name to launch before attaching.

  -w                   Alias for --wait-for

COMMANDS:

  --batch              Tells the debugger to run the commands from -s, -S, -o & -O, and then quit.

  -b                   Alias for --batch

  -K <value>           Alias for --source-on-crash

  -k <value>           Alias for --one-line-on-crash

  --local-lldbinit     Allow the debugger to parse the .lldbinit files in the current working directory, unless --no-lldbinit is passed.

  --no-lldbinit        Do not automatically parse any '.lldbinit' files.

  --one-line-before-file <command>

                       Tells the debugger to execute this one-line lldb command before any file provided on the command line has been loaded.

  --one-line-on-crash <command>

                       When in batch mode, tells the debugger to run this one-line lldb command if the target crashes.

  --one-line <command> Tells the debugger to execute this one-line lldb command after any file provided on the command line has been loaded.

  -O <value>           Alias for --one-line-before-file

  -o <value>           Alias for --one-line

  -Q                   Alias for --source-quietly

  --source-before-file <file>

                       Tells the debugger to read in and execute the lldb commands in the given file, before any file has been loaded.

  --source-on-crash <file>

                       When in batch mode, tells the debugger to source this file of lldb commands if the target crashes.

  --source-quietly     Tells the debugger to execute this one-line lldb command before any file has been loaded.

  --source <file>      Tells the debugger to read in and execute the lldb commands in the given file, after any file has been loaded.

  -S <value>           Alias for --source-before-file

  -s <value>           Alias for --source

  -x                   Alias for --no-lldbinit

OPTIONS:

  --arch <architecture> Tells the debugger to use the specified architecture when starting and running the program.

  -a <value>            Alias for --arch

  --capture-path <filename>

                        Tells the debugger to use the given filename for the reproducer.

  --capture             Tells the debugger to capture a reproducer.

  --core <filename>     Tells the debugger to use the full path to <filename> as the core file.

  -c <value>            Alias for --core

  --debug               Tells the debugger to print out extra information for debugging itself.

  -d                    Alias for --debug

  --editor              Tells the debugger to open source files using the host's "external editor" mechanism.

  -e                    Alias for --editor

  --file <filename>     Tells the debugger to use the file <filename> as the program to be debugged.

  -f <value>            Alias for --file

  --help                Prints out the usage information for the LLDB debugger.

  -h                    Alias for --help

  --no-use-colors       Do not use colors.

  --replay <filename>   Tells the debugger to replay a reproducer from <filename>.

  --reproducer-skip-version-check

                        Skip the reproducer version check.

  --version             Prints out the current version number of the LLDB debugger.

  -v                    Alias for --version

  -X                    Alias for --no-use-color

REPL:

  -r=<flags>     Alias for --repl=<flags>

  --repl-language <language>

                 Chooses the language for the REPL.

  --repl=<flags> Runs lldb in REPL mode with a stub process with the given flags.

  --repl         Runs lldb in REPL mode with a stub process.

  -R <value>     Alias for --repl-language

  -r             Alias for --repl

SCRIPTING:

  -l <value>    Alias for --script-language

  --python-path Prints out the path to the lldb.py file for this version of lldb.

  -P            Alias for --python-path

  --script-language <language>

                Tells the debugger to use the specified scripting language for user-defined scripts.

EXAMPLES:

  The debugger can be started in several modes.

  Passing an executable as a positional argument prepares lldb to debug the

  given executable. Arguments passed after -- are considered arguments to the

  debugged executable.

    lldb --arch x86_64 /path/to/program -- --arch arvm7

  Passing one of the attach options causes lldb to immediately attach to the

  given process.

    lldb -p <pid>

    lldb -n <process-name>

  Passing --repl starts lldb in REPL mode.

    lldb -r

  Passing --core causes lldb to debug the core file.

    lldb -c /path/to/core

  Command options can be combined with these modes and cause lldb to run the

  specified commands before or after events, like loading the file or crashing,

  in the order provided on the command line.

    lldb -O 'settings set stop-disassembly-count 20' -o 'run' -o 'bt'

    lldb -S /source/before/file -s /source/after/file

    lldb -K /source/before/crash -k /source/after/crash

  Note: In REPL mode no file is loaded, so commands specified to run after

  loading the file (via -o or -s) will be ignored.
下面进入正题。
c++代码demo
准备了一份C++代码,用作演示。
提示: clang++编译需要使用
-g参数,生成调试信息。
#include <iostream>

int print(const char *parr)

{

    if (nullptr != parr)

        std::cout << parr << "\n\n";

    return 0;

}

int main(int argc, char* argv[], char* env[])

{

    int var_a = 1;

    char arr[] = {"ABCDEF"};

    int ret = print("hello world");

    std::cout << arr << "\n\n";

    std::cout << "var_a=" << var_a << "\n\n";

    std::cout << "ret=" << ret << "\n\n";

    return 0;

}
已使用clang++将其编译为demo。
lldb启动与退出
启动
启动有两种方式。
方式1
语法: lldb [程序名]。 例如, lldb demo。 其中,demo为程序名。执行命令后,lldb将启动demo程序,并暂停。

如果你的程序需要传递参数到
main,可以使用lldb demo [参数1] [参数2]....
方式2
上面是直接一步到位。接着这个方法可能有点慢: 先启动lldb,再用file启动程序。
- 首先键入
lldb可直接启动lldb. - 其次键入
file demo启动目标程序.

对比可知,都可以打达到同样的效果。
退出
退出也有两种方式
方式1
使用quit命令。
方式2
使用exit命令
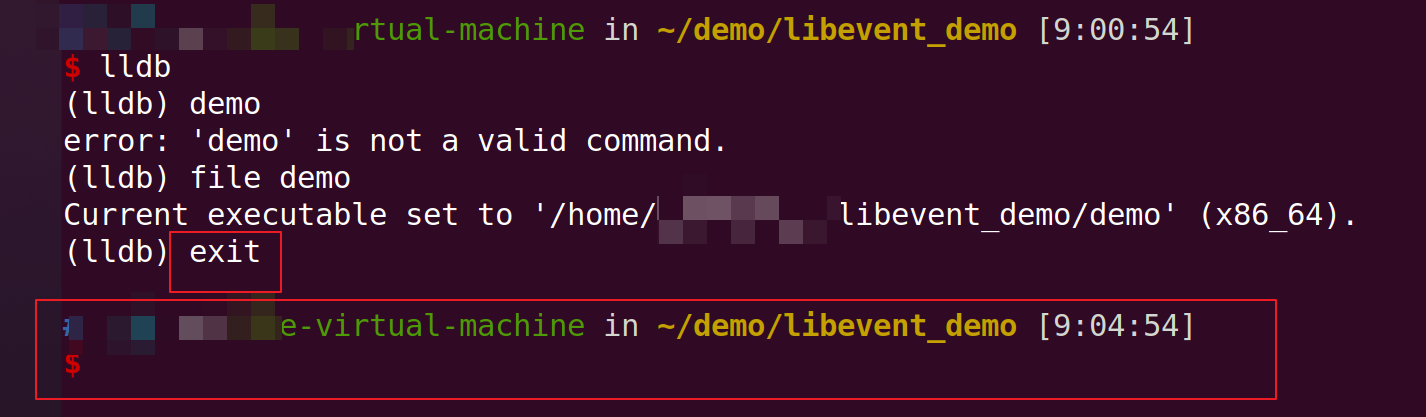
可见,键入命令后,已经返回current directory了。
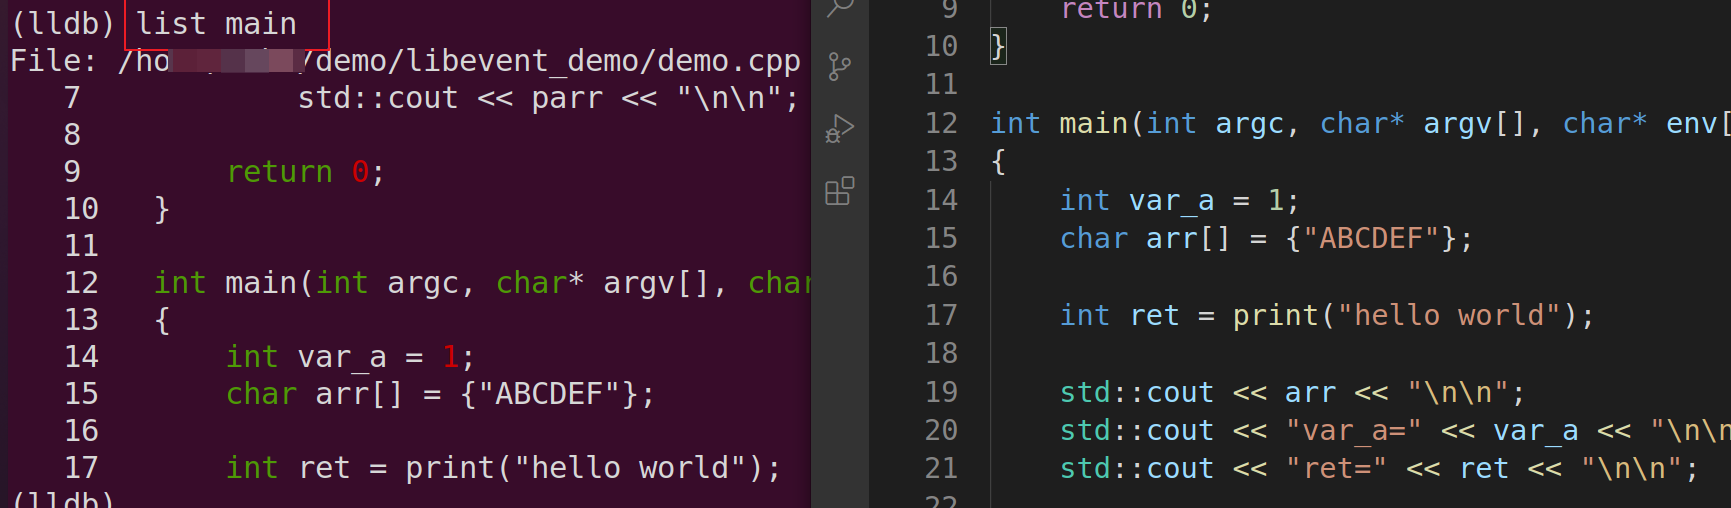
list 查看源码
查看文件代码
- 使用
listorl可以查看当前设置的文件代码. 语法: list 行号。 例如: list 10. 这里将跳转到第10行,从此往下显示10行 - 使用
list [文件名]可查看其他文件。
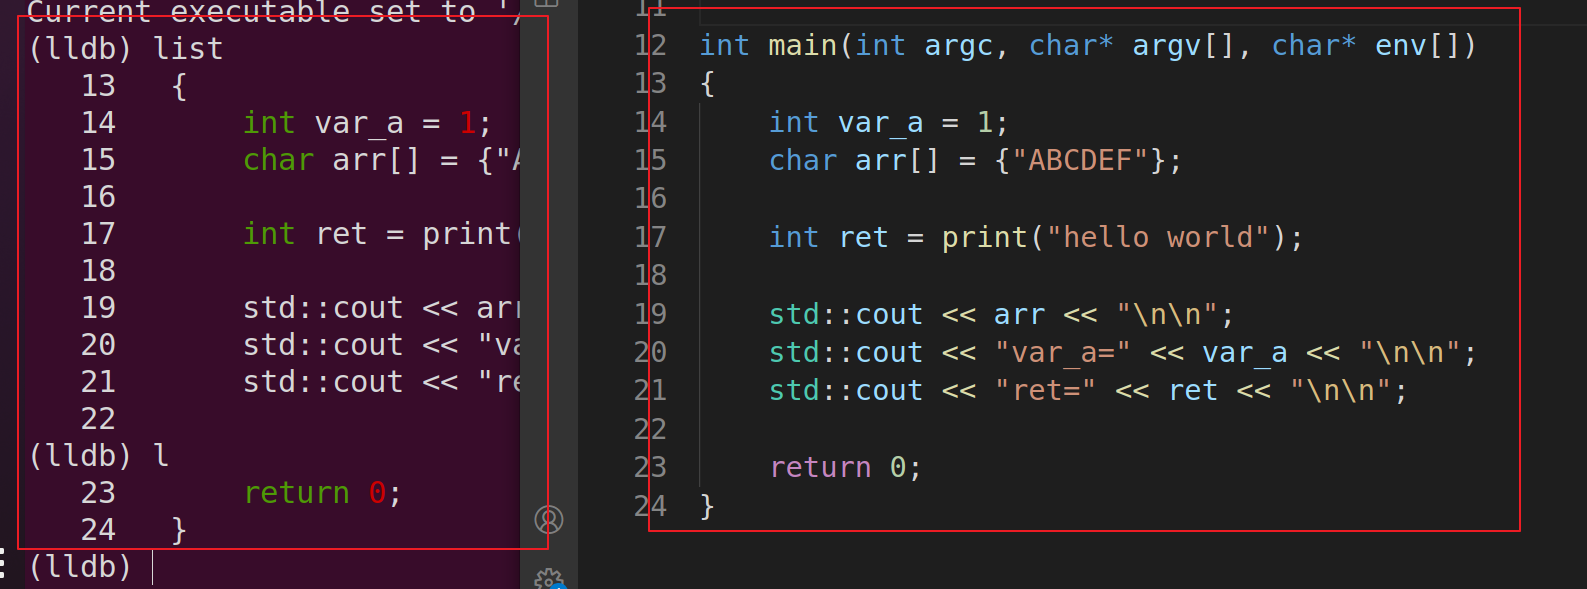
图中没有添加行号,直接键入命令listorl, 默认显示10行代码。
下面演示代码行跳转。
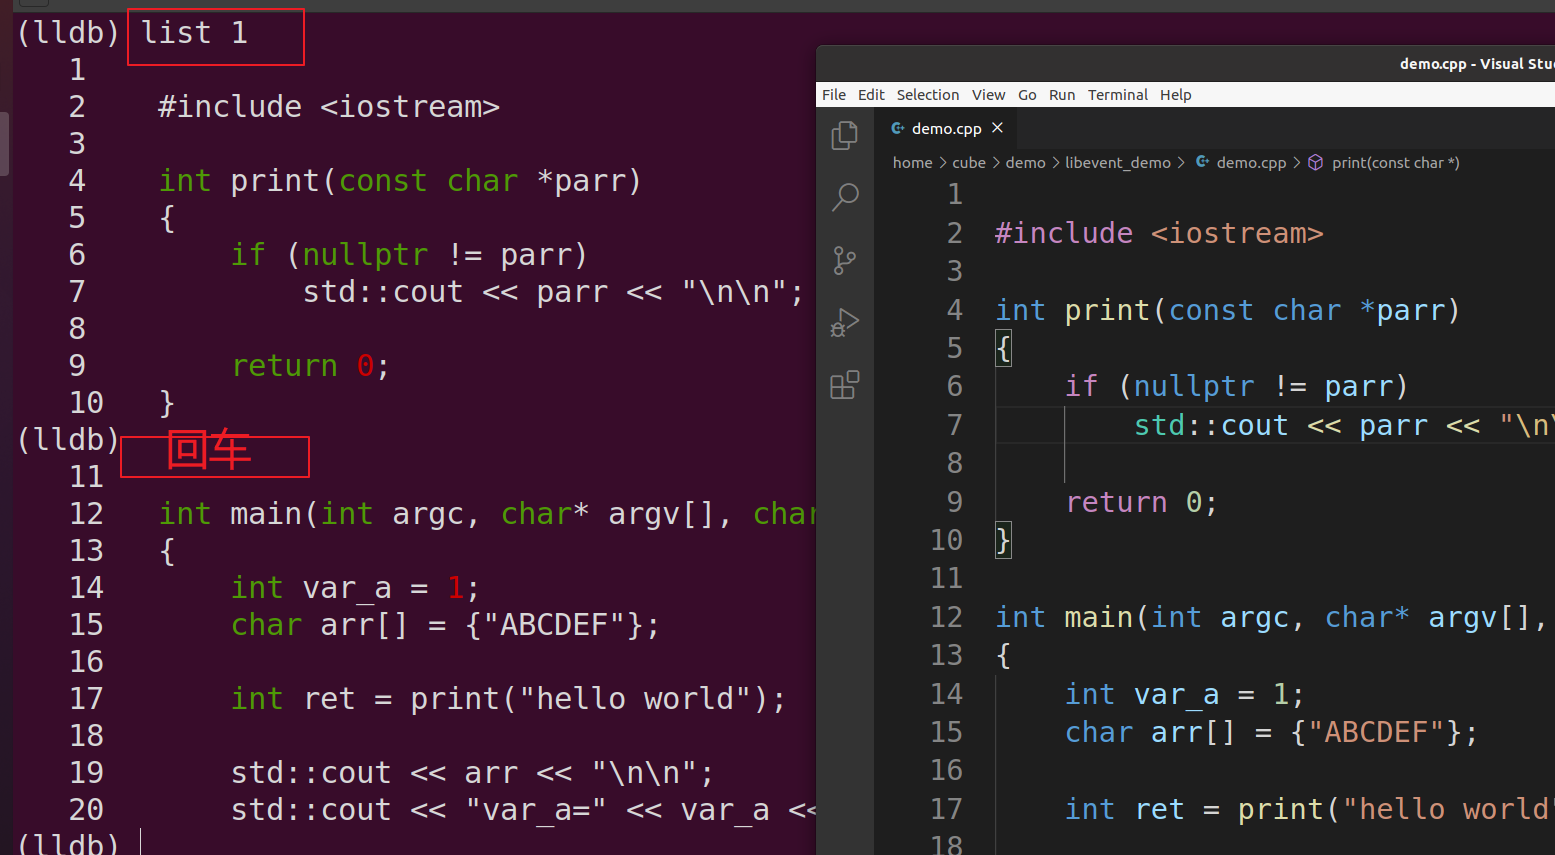
上面的list 1将从第一行显示10行代码。下面接着按下回车,默认显示10行代码。
查看函数
使用命令list [函数名]可查看函数代码。
breakpoint 断点
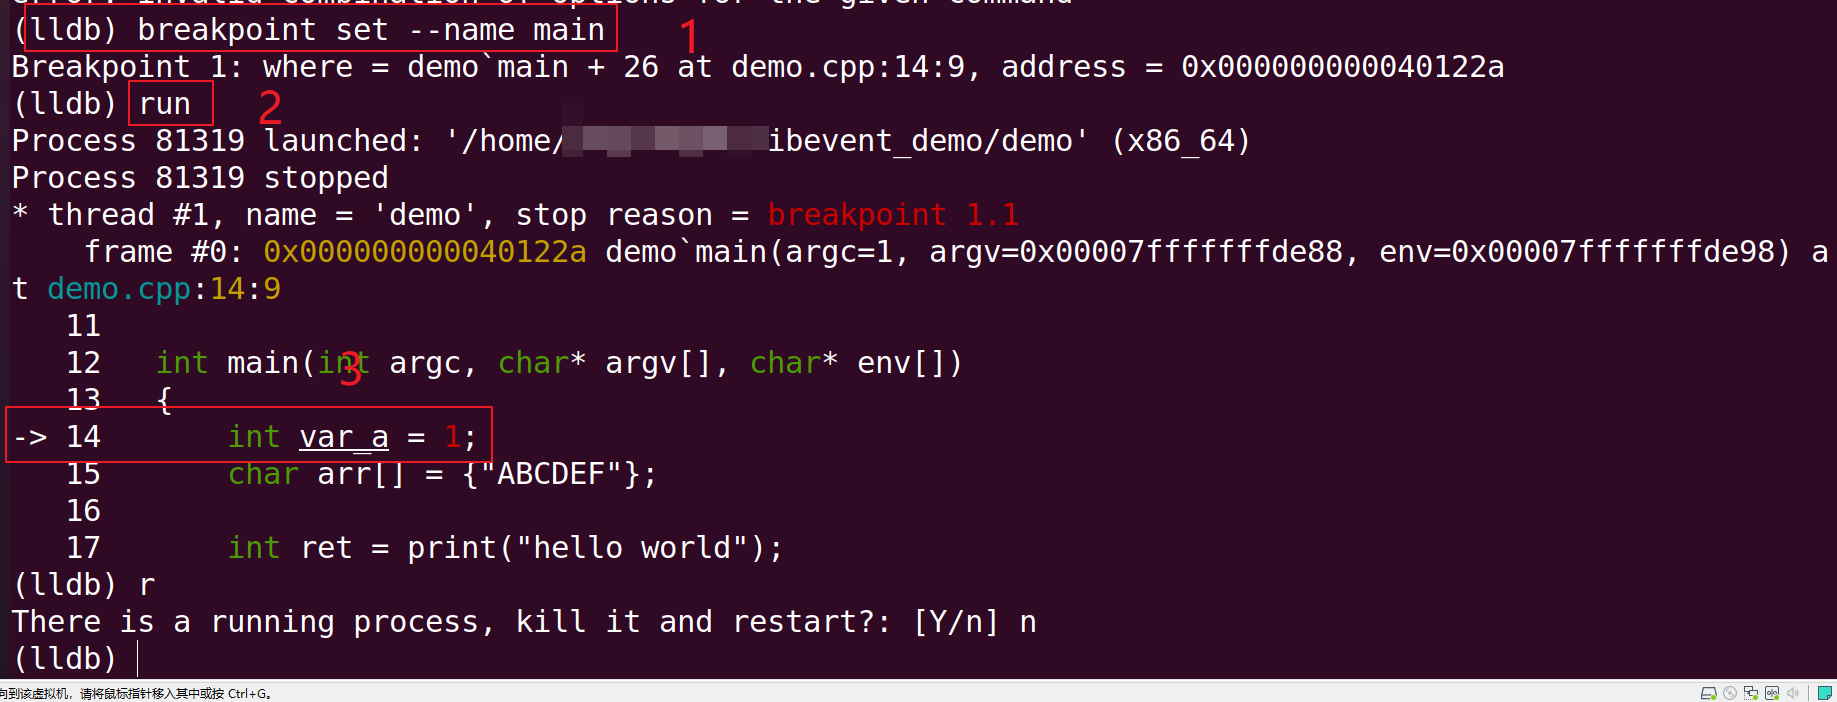
函数名设置断点
breakpoint set --name [函数名] 可设置断点。 如下图,设置了main函数断点。

设置断点后,再执行run,可见程序已经停在了函数的入口处。
行号设置断点
breakpoint set --line [行号] s设置断点. 下面演示了在当前文件的第8行设置断点。且断点序号为3
(lldb) breakpoint set --line 8

Breakpoint 3: where = demo`main + 33 at demo.cpp:8:10, address = 0x0000000000401201
根据文件名设置断点
breakpoint set --file [文件名] --line [行号]。 下面演示 将断点设置在文件car.hpp中的第17行
(lldb) breakpoint set --file car.hpp --line 17

Breakpoint 1: where = demo`car::print_name() + 12 at car.hpp:18:19, address = 0x00000000004012ec
删除所有断点
breakpoint delete可删除所有断点,并提示确认 。
(lldb) breakpoint delete

About to delete all breakpoints, do you want to do that?: [Y/n]
删除某个断点
断点列表
(lldb) breakpoint list

Current breakpoints:

2: name = 'main', locations = 1

  2.1: where = demo`main + 26 at demo.cpp:7:9, address = demo[0x00000000004011fa], unresolved, hit count = 0

3: file = '/home/xxx/demo/libevent_demo/demo.cpp', line = 8, exact_match = 0, locations = 1

  3.1: where = demo`main + 33 at demo.cpp:8:10, address = demo[0x0000000000401201], unresolved, hit count = 0

4: file = '/home/xxx/demo/libevent_demo/demo.cpp', line = 10, exact_match = 0, locations = 1

  4.1: where = demo`main + 47 at demo.cpp:10:15, address = demo[0x000000000040120f], unresolved, hit count = 0
- 使用
breakpoint delete [断点序号]可删除指定断点。 下面删除序号为2的断点和删除后的断点列表
(lldb) breakpoint delete 2

1 breakpoints deleted; 0 breakpoint locations disabled.

(lldb) breakpoint list

Current breakpoints:

3: file = '/home/cube/demo/libevent_demo/demo.cpp', line = 8, exact_match = 0, locations = 1

  3.1: where = demo`main + 33 at demo.cpp:8:10, address = demo[0x0000000000401201], unresolved, hit count = 0

4: file = '/home/cube/demo/libevent_demo/demo.cpp', line = 10, exact_match = 0, locations = 1

  4.1: where = demo`main + 47 at demo.cpp:10:15, address = demo[0x000000000040120f], unresolved, hit count = 0
- 使用
breakpoint delete [n-m]可删除从序号n到序号m之间的断点。一个例子
(lldb) breakpoint delete 3-4

2 breakpoints deleted; 0 breakpoint locations disabled.

(lldb) breakpoint list

No breakpoints currently set.
- 删除多个不连续断点
使用breakpoint delete [序号1] [序号2] [序号3].....可删除多个断点。
(lldb) breakpoint delete 5 7 8

3 breakpoints deleted; 0 breakpoint locations disabled.

(lldb) breakpoint list

Current breakpoints:

6: file = '/home/cube/demo/libevent_demo/demo.cpp', line = 9, exact_match = 0, locations = 1

  6.1: where = demo`main + 47 at demo.cpp:10:15, address = demo[0x000000000040120f], unresolved, hit count = 0
查看断点列表
使用
breakpoint list可以查看所有断点。

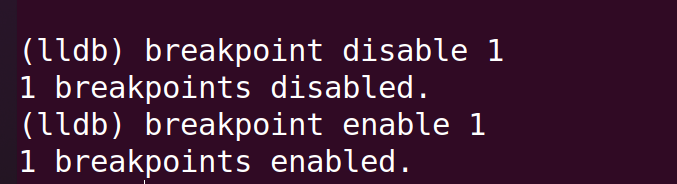
圈出来的是序号,可设置多个断点,用这个序号作为唯一标识。禁用断点:
breakpoint disable [序号], 例如,breakpoint disable 1启动断点:
breakpoint enable [序号],例如:breakpoint enable 1
run 运行
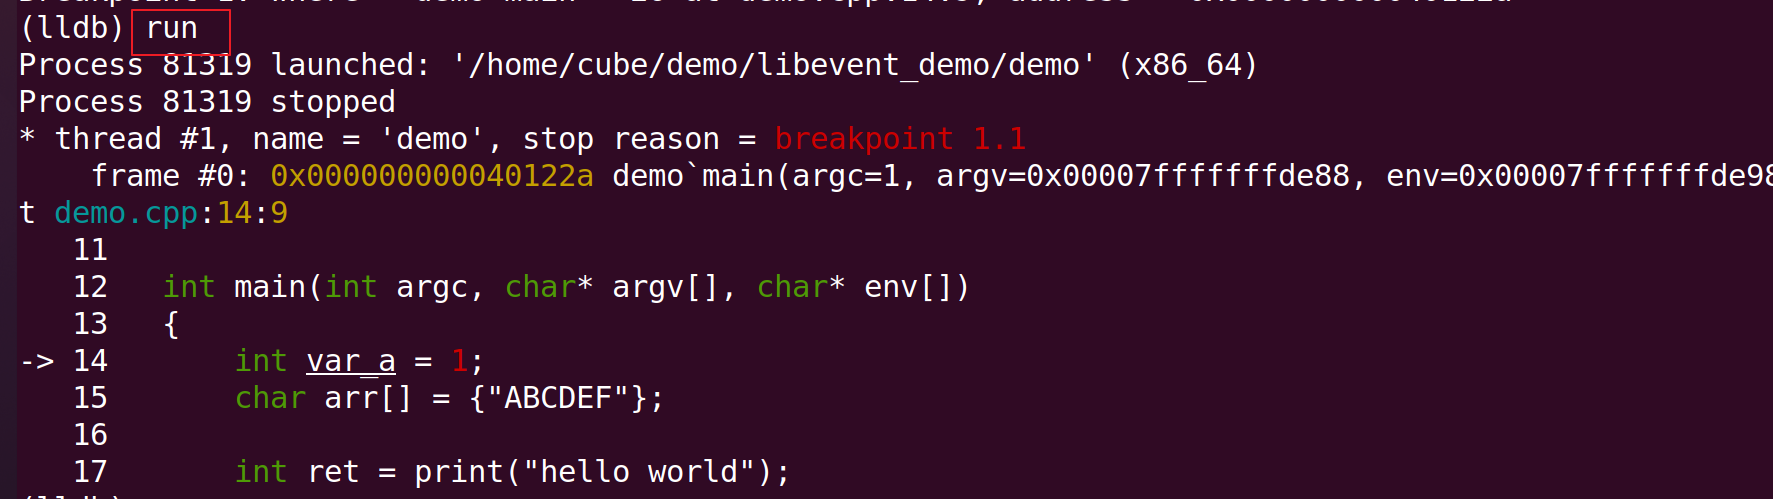
run命令可以让程序运行起来。
next 下一步
使用 next or n 可以单步执行
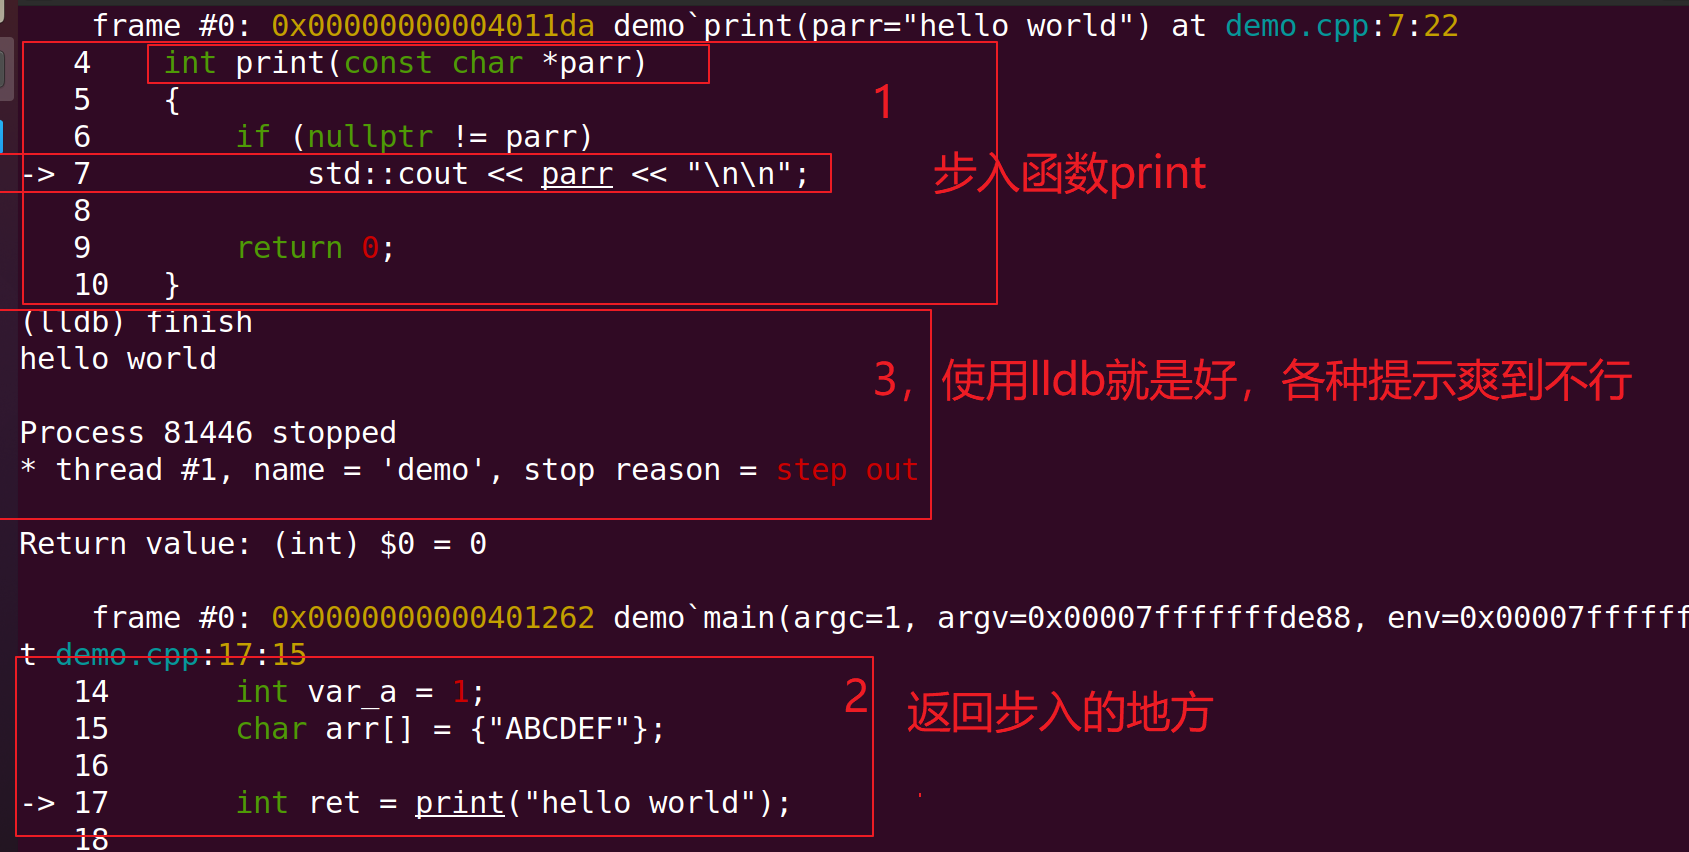
step 步入
使用 step or s 步入 函数。
finish 跳出
使用 finish 跳出,返回步入的地方,
p和po输出变量
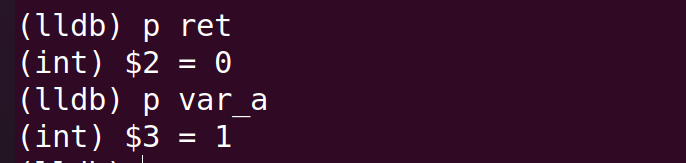
p
使用p [变量名] 可以查看变量的值。
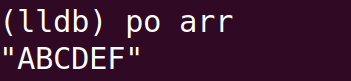
po
使用 po [指针变量名] 可以查看其值
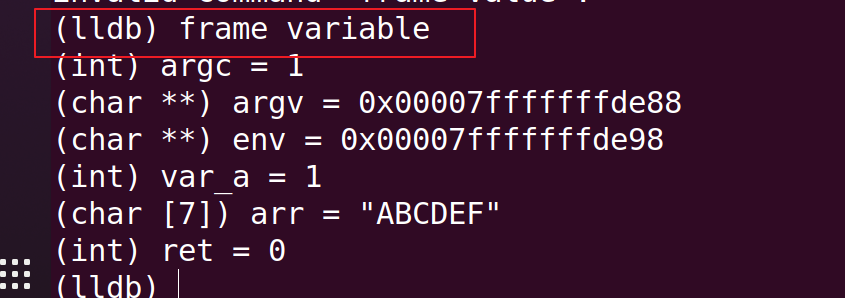
frame查看变量值
使用frame variable 可以查看当前frame中的所有value
expression 修改变量值
使用expression [变量名]=[value]可以修改变量的值。(做ios tweak 分析时,这招就挺好使)。
例如: expression ret=10.
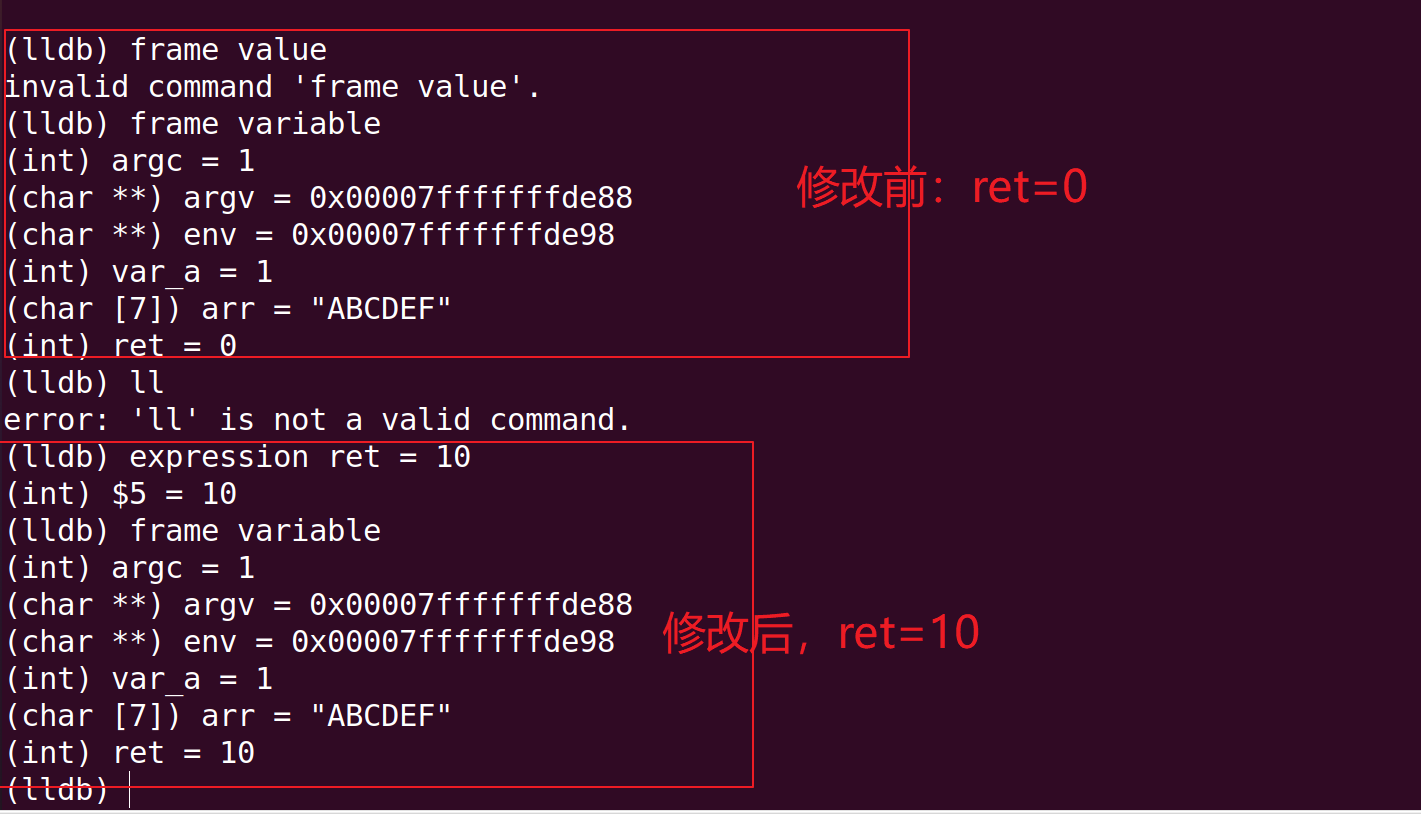
程序继续执行,发现输出的ret由0变为10.

lldb调试C++总结(1)的更多相关文章
- iOS逆向工程之Hopper+LLDB调试第三方App
LLDB是Low Level Debugger的简称,在iOS开发的调试中LLDB是经常使用的,LLDB是Xcode内置的动态调试工具.使用LLDB可以动态的调试你的应用程序,如果你不做其他的额外处理 ...
- iOS LLDB调试器
随着Xcode 5的发布,LLDB调试器已经取代了GDB,成为了Xcode工程中默认的调试器.它与LLVM编译器一起,带给我们更丰富的流程控制和数据检测的调试功能.LLDB为Xcode提供了底层调试环 ...
- 使用Python脚本强化LLDB调试器
LLDB是Xcode自带的调试器,作为一个iOS应用开发程序员,平时我在开发应用时会使用LLDB来调试代码.在逆向应用时,也会用到LLDB来跟踪应用的执行过程. LLDB还内置了一个Python解析器 ...
- LLDB调试基本使用
在平时开发中,我们可能需要调试某些东西,比如查看给服务器发请求时传过去的参数,如果不适用LLDB的话我们用的最多的就是通过NSLog方式去打印,但现在我们可以精简这个步骤,那就是使用LLDB调试命令. ...
- iOS 开发者旅途中的指南针 - LLDB 调试技术
文章转载于:iOS 开发者旅途中的指南针 - LLDB 调试技术 今天给大家介绍的内容,无关乎任何功能性开发技术,但又对开发的效率影响至深,这就是调试技术. 何为调试呢,比如我们用 print 函数在 ...
- centos7使用lldb调试netcore应用转储dump文件
centos7下安装lldb,dotnet netcore 进程生成转储文件,并使用lldb进行分析 随着netcore应用在linux上部署的应用越来越多,碰到cpu 100%,内存暴涨的情况也一直 ...
- centos7 lldb 调试netcore应用的内存泄漏和死循环示例(dump文件调试)
写个demo来玩一玩linux平台下使用lldb加载sos来调试netcore应用. 当然,在真实的产线环境中需要分析的数据和难度远远高于demo所示,所以demo的作用也仅仅只能起到介绍工具的作用. ...
- Xcode - LLDB调试技巧
LLDB是Xcode默认的调试器,它与LLVM编译器一起,带给我们更丰富的流程控制和数据检测的调试功能.平时用Xcode运行程序,实际走的都是LLDB.熟练使用LLDB,可以让你debug事半功倍. ...
- Swift 使用 LLDB 调试命令
swift 和 oc 的语法不一样: Xcode 调试技巧之 Swift 篇 打印和赋值,观察数值变量和view对象属性 p指令可打印其对象类型.内存地址以及该对象的值等具体信息, po指令则是打印其 ...
- iOS - 浅谈LLDB调试器
摘要 LLDB是Xcode默认的调试器,它与LLVM编译器一起,带给我们更丰富的流程控制和数据检测的调试功能.平时用Xcode运行程序,实际走的都是LLDB.熟练使用LLDB,可以让你debug事半功 ...
随机推荐
- Latex 文档格式化
title: "Latex 文档格式化" author: 李龙翔 date: "Nov 22, 2019" subject: "Markdown&qu ...
- Perl去重fasta序列
常规方法 #! usr/bin/perl -w use strict; my $input=shift; my %hash; open IN,"<$input"; $/=&q ...
- datamash 命令行下的快速计算工具
github地址:https://github.com/agordon/datamash
- Linux三剑客之老三grep
说明: Linux系统中grep命令是一种强大的文本搜索工具,它能使用正则表达式搜索文本,并把匹配的行打印出来.工作中我们常常用它来过滤出我们想要的数据. 格式: grep [OPTIONS] 基本参 ...
- mysql 索引的注意事项
mysql 无法使用索引的查询 索引是什么,为什么要用索引,索引使用的时候要注意什么,那些情况下索引无法起作用. 1,索引是什么 mysql的索引也是一张表,并且是一个有序的表,主要记录了需要索引的数 ...
- C#表头固定
<%@ Control Language="C#" AutoEventWireup="true" CodeFile="info.ascx.cs& ...
- c++基础知识03
1.嵌套循环案例--九九乘法表 int main() { //利用嵌套循环乘法口诀表 for (int n = 1; n <= 9; n++) { for (int m = 1; m <= ...
- 日常Java 2021/10/4
读取控制台输入 将System.in包装在BufferedReader对象中来创建一个字符流 BufferedReader b = new BufferedReader(new InputStream ...
- A Child's History of England.47
CHAPTER 13 ENGLAND UNDER RICHARD THE FIRST, CALLED THE LION-HEART In the year of our Lord one thousa ...
- Hibernate持久化标志符生成策略
generator子元素定义持久化标识符的生成策略,为持久化类对应的数据库表的主键找到了赋值方法,HIbernate默认将使用assigned的持久化标识符生成策略.关系型数据库的主键定义方式:(1) ...