
宋宝华:关于Ftrace的一个完整案例【转】
Ftrace简介
Ftrace是Linux进行代码级实践分析最有效的工具之一,比如我们进行一个系统调用,出来的时间过长,我们想知道时间花哪里去了,利用Ftrace就可以追踪到一级级的时间分布。
Ftrace案例
写一个proc模块,包含一个proc的读和写的入口。test_proc_show()故意调用了一个kill_time()的函数,而kill_time()的函数,又调用了mdelay(2)和kill_moretime()的函数,该函数体内调用mdelay(2)。
kill_time()的函数和kill_moretime()函数前面都加了noinline以避免被编译器inline优化掉。
#include <linux/module.h>

#include <linux/kernel.h>

#include <linux/init.h>

#include <linux/version.h>

#include <linux/proc_fs.h>

#include <linux/seq_file.h>

#include <linux/delay.h>

#include <linux/uaccess.h>

static unsigned int variable;

static struct proc_dir_entry *test_dir, *test_entry;

static noinline void kill_moretime(void)

{

mdelay(2);

}

static noinline void kill_time(void)

{

mdelay(2);

kill_moretime();

}

static int test_proc_show(struct seq_file *seq, void *v)

{

unsigned int *ptr_var = seq->private;

kill_time();

seq_printf(seq, "%u\n", *ptr_var);

return 0;

}

static ssize_t test_proc_write(struct file *file, const char __user *buffer,

size_t count, loff_t *ppos)

{

...

}

static int test_proc_open(struct inode *inode, struct file *file)

{

return single_open(file, test_proc_show, PDE_DATA(inode));

}

static const struct file_operations test_proc_fops =

{

.owner = THIS_MODULE,

.open = test_proc_open,

.read = seq_read,

.write = test_proc_write,

.llseek = seq_lseek,

.release = single_release,

};

static __init int test_proc_init(void)

{

test_dir = proc_mkdir("test_dir", NULL);

if (test_dir) {

test_entry = proc_create_data("test_rw",0666, test_dir, &test_proc_fops, &variable);

if (test_entry)

return 0;

}

return -ENOMEM;

}

module_init(test_proc_init);

static __exit void test_proc_cleanup(void)

{

remove_proc_entry("test_rw", test_dir);

remove_proc_entry("test_dir", NULL);

}

module_exit(test_proc_cleanup);

MODULE_AUTHOR("Barry Song <baohua@kernel.org>");

MODULE_DESCRIPTION("proc exmaple");

MODULE_LICENSE("GPL v2");
模块对应的Makefile如下:
KVERS = $(shell uname -r)

# Kernel modules

obj-m += proc.o

# Specify flags for the module compilation.

#EXTRA_CFLAGS=-g -O0

build: kernel_modules

kernel_modules:

 make -C /lib/modules/$(KVERS)/build M=$(CURDIR) modules

clean:

 make -C /lib/modules/$(KVERS)/build M=$(CURDIR) clean
编译并且加载:
$ make
baohua@baohua-perf:~/develop/training/debug/ftrace/proc$ $ sudo insmod proc.ko

[sudo] password for baohua:
之后/proc目录下/proc/test_dir/test_rw文件可被读写。
下面我们用Ftrace来跟踪test_proc_show()这个函数。
我们把启动ftrace的所有命令写到一个脚本function.sh里面:
#!/bin/bash

debugfs=/sys/kernel/debug

echo nop > $debugfs/tracing/current_tracer

echo 0 > $debugfs/tracing/tracing_on

echo $$ > $debugfs/tracing/set_ftrace_pid

echo function_graph > $debugfs/tracing/current_tracer

#replace test_proc_show by your function name

echo test_proc_show > $debugfs/tracing/set_graph_function

echo 1 > $debugfs/tracing/tracing_on
然后用这个脚本去启动cat /proc/test_dir/test_rw,这样ftrace下面test_proc_show()函数就被trace了。
# ./function.sh cat /proc/test_dir/test_rw
读取trace的结果:
# cat /sys/kernel/debug/tracing/trace > 1
接着用vim打开这个文件1,发现这个文件有600多行:
Ftrace结果怎么读?
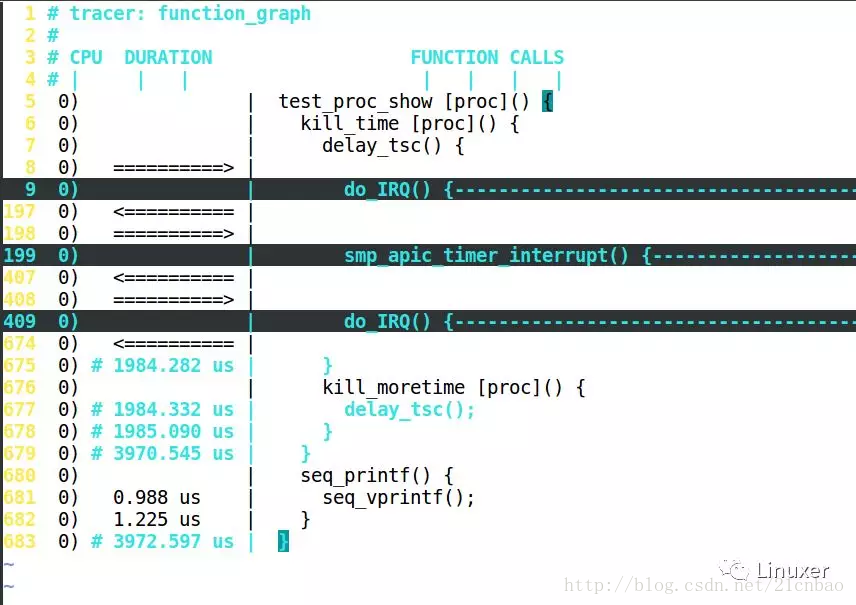
Ftrace结果怎么读?答案非常简单:如果是叶子函数,就直接在这个函数的前面显示它占用的时间,如果是非叶子,要等到 }的时候,再显示时间,如下图:
延迟比较大的部分,会有+、#等特殊标号:
'$' - greater than 1 second

 '@' - greater than 100 milisecond

 '*' - greater than 10 milisecond

 '#' - greater than 1000 microsecond

 '!' - greater than 100 microsecond

 '+' - greater than 10 microsecond

 ' ' - less than or equal to 10 microsecond.
vim对Ftrace进行折叠
上面那个Ftrace文件太大了,大到看不清。我们可以用vim来折叠之,不过需要一个vim的特别配置,我把它存放在了我的~目录,名字叫.fungraph-vim:
" Enable folding for ftrace function_graph traces.

"

" To use, :source this file while viewing a function_graph trace, or use vim's

" -S option to load from the command-line together with a trace.  You can then

" use the usual vim fold commands, such as "za", to open and close nested

" functions.  While closed, a fold will show the total time taken for a call,

" as would normally appear on the line with the closing brace.  Folded

" functions will not include finish_task_switch(), so folding should remain

" relatively sane even through a context switch.

"

" Note that this will almost certainly only work well with a

" single-CPU trace (e.g. trace-cmd report --cpu 1).

function! FunctionGraphFoldExpr(lnum)

  let line = getline(a:lnum)

  if line[-1:] == '{'

    if line =~ 'finish_task_switch() {$'

      return '>1'

    endif

    return 'a1'

  elseif line[-1:] == '}'

    return 's1'

  else

    return '='

  endif

endfunction

function! FunctionGraphFoldText()

  let s = split(getline(v:foldstart), '|', 1)

  if getline(v:foldend+1) =~ 'finish_task_switch() {$'

    let s[2] = ' task switch  '

  else

    let e = split(getline(v:foldend), '|', 1)

    let s[2] = e[2]

  endif

  return join(s, '|')

endfunction

setlocal foldexpr=FunctionGraphFoldExpr(v:lnum)

setlocal foldtext=FunctionGraphFoldText()

setlocal foldcolumn=12

setlocal foldmethod=expr
之后我们配置vim为这个模板来打开前面那个600多行的文件1:
vim -S ~/.fungraph-vim 1
这样我们看到的样子是:
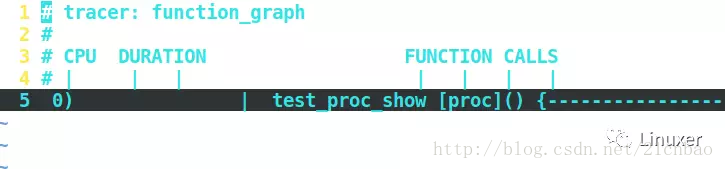
我们可以把光标移动到第5行,键盘敲打za,则展开为:

我们可以用z、a两个按键,搜索或者展开Ftrace的结果。
最后,https://github.com/brendangregg/perf-tools对Ftrace的功能进行了很好的封装和集成,建议大家用perf-tools来使用Ftrace,则效果更佳更简单。
宋宝华:关于Ftrace的一个完整案例【转】的更多相关文章
- 宋宝华:关于Ftrace的一个完整案例
本文系转载,著作权归作者所有.商业转载请联系作者获得授权,非商业转载请注明出处. 作者: 宋宝华 来源: 微信公众号linux阅码场(id: linuxdev) Ftrace简介 Ftrace是Lin ...
- 宋宝华:Docker 最初的2小时(Docker从入门到入门)
本文系转载,著作权归作者所有. 商业转载请联系作者获得授权,非商业转载请注明出处. 作者: 宋宝华 来源: 微信公众号linux阅码场(id: linuxdev) 最初的2小时,你会爱上Docker, ...
- 宋宝华: 关于Linux进程优先级数字混乱的彻底澄清
宋宝华: 关于Linux进程优先级数字混乱的彻底澄清 原创: 宋宝华 Linux阅码场 9月20日 https://mp.weixin.qq.com/s/44Gamu17Vkl77OGV2KkRmQ ...
- 宋宝华:Linux设备驱动框架里的设计模式之——模板方法(Template Method)
本文系转载,著作权归作者所有.商业转载请联系作者获得授权,非商业转载请注明出处. 作者: 宋宝华 来源: 微信公众号linux阅码场(id: linuxdev) 前言 <设计模式>这本经典 ...
- 宋宝华: Linux内核编程广泛使用的前向声明(Forward Declaration)
本文系转载,著作权归作者所有.商业转载请联系作者获得授权,非商业转载请注明出处. 作者:宋宝华 来源: 微信公众号linux阅码场(id: linuxdev) 前向声明 编程定律 先强调一点:在一切可 ...
- 宋宝华:关于ARM Linux原子操作的实现
本文系转载,著作权归作者所有.商业转载请联系作者获得授权,非商业转载请注明出处. 作者: 宋宝华 来源: 微信公众号linux阅码场(id: linuxdev) 竞态无所不在 首先我们要理解竞态(ra ...
- 宋宝华:Docker 最初的2小时(Docker从入门到入门)【转】
最初的2小时,你会爱上Docker,对原理和使用流程有个最基本的理解,避免满世界无头苍蝇式找资料.本人反对暴风骤雨式多管齐下狂轰滥炸的学习方式,提倡迭代学习法,就是先知道怎么玩,有个感性认识,再深入学 ...
- 宋宝华:swappiness=0究竟意味着什么?
http://mp.weixin.qq.com/s/BixMISiPz3sR9FDNfVSJ6w 本文解释swappiness的作用,以及swappiness=0究竟意味着什么. 内存回收 我们都知道 ...
- 《Linux设备驱动开发详解(第3版)》(即《Linux设备驱动开发详解:基于最新的Linux 4.0内核》)--宋宝华
http://blog.csdn.net/21cnbao/article/details/45322629
随机推荐
- 【Spark篇】---SparkStreaming算子操作transform和updateStateByKey
一.前述 今天分享一篇SparkStreaming常用的算子transform和updateStateByKey. 可以通过transform算子,对Dstream做RDD到RDD的任意操作.其实就是 ...
- BBS论坛(二十六)
26.发布帖子前台代码逻辑完成 (1)front/hooks.py from .views import bp from flask import session,g from .models imp ...
- 说一说MVC的CompressActionFilterAttrubute(五)
通过action对文件流压缩,提高带宽速度!!! 引用using System.IO.Compression; public override void OnActionExecuting(Actio ...
- Asp.Net SignalR GlobalHost外部通知
GlobalHost 外部通知 之前都是在集线器类中进行服务器对客户端的通知操作,但是在开发中往往会有需求监控某个系统 ,比如OA系统 上级领导在上面宣布下午两点要开会 那么就要通知到其他的人.这里 ...
- vim配置python编程环境及YouCompleteMe的安装教程
python号称人工智能语言,现在可算大热,这篇博客将介绍如何用vim打造一款自己专属的python编程环境. step1 由于安装YouCompleteMe需要vim8.0及以上版本,所以得安装使用 ...
- python基础6--面向对象基础、装饰器
1.类 class Student: def __init__(self, name, grade): self.name = name self.grade = grade def introduc ...
- MySQL 笔记整理(6) --全局锁和表锁:给表加个字段怎么有这么多阻碍
笔记记录自林晓斌(丁奇)老师的<MySQL实战45讲> 6) --全局锁和表锁:给表加个字段怎么有这么多阻碍 数据库锁设计的初衷是处理并发问题.作为多用户共享的资源,当出现并发访问的时候, ...
- JSON字符串反序列化成对象_部分属性值反序列化失败
简介:本人在开发webapi接口时遇到了:一个复杂的Json字符串在反序列化为对象时报,无法发序列化其中的一个属性对象? 使用方法: InternalRecommendRequestFormModel ...
- Android开发——Notification通知的各种Style详解
本来是想与之前讲解使用Notification通知使用一起写的,查看了资料,觉得有必要将这Style部分单独拿出来讲解 前篇:Android开发——Notification通知的使用及Notifica ...
- 中间件(3)NoSQL
NoSQL最常见的解释是non-relational,或者not only SQL,从字段意思上就可以看出,它是指非关系型数据库的统称. NoSQL诞生的背景 随着大型网站分布式架构的发展,使用传统关 ...