
iReport jasperReports 生成表格
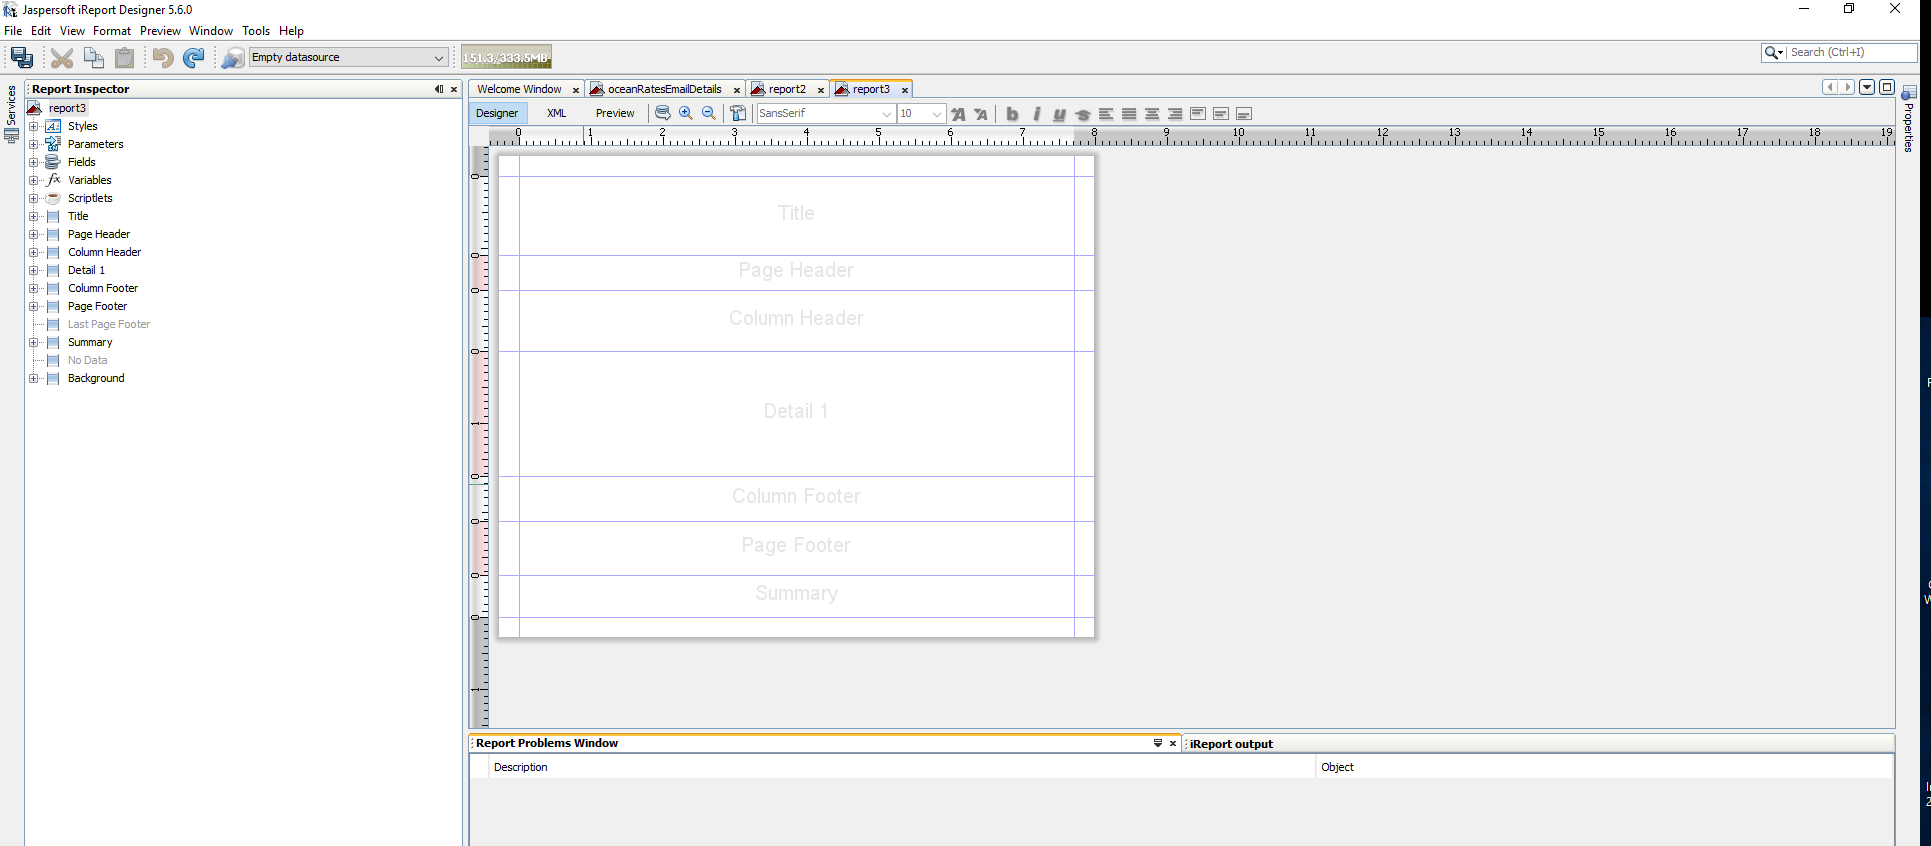
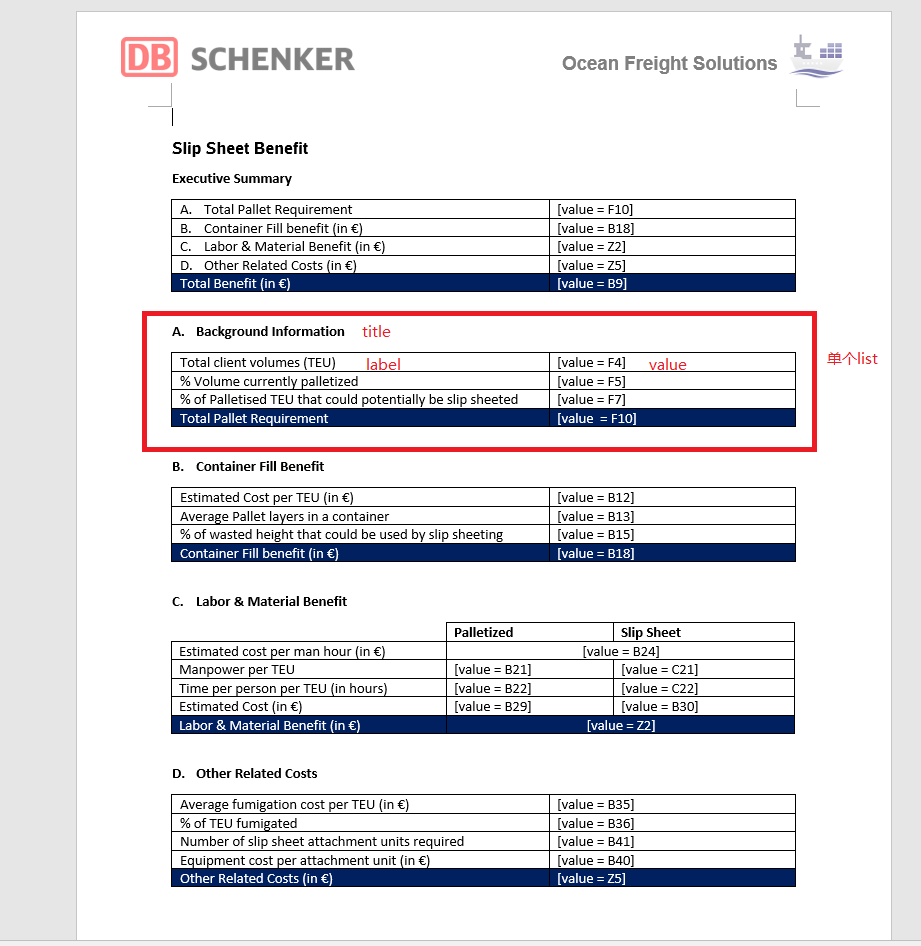

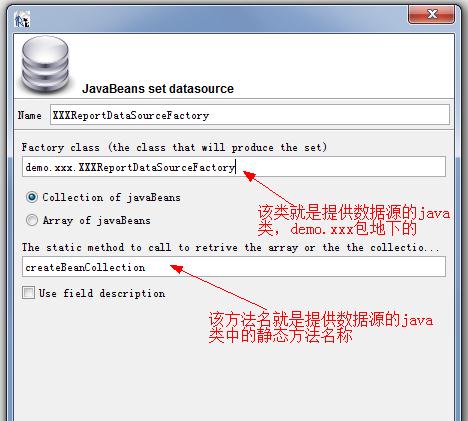
4.指定要在页面展示和页面控制的数据
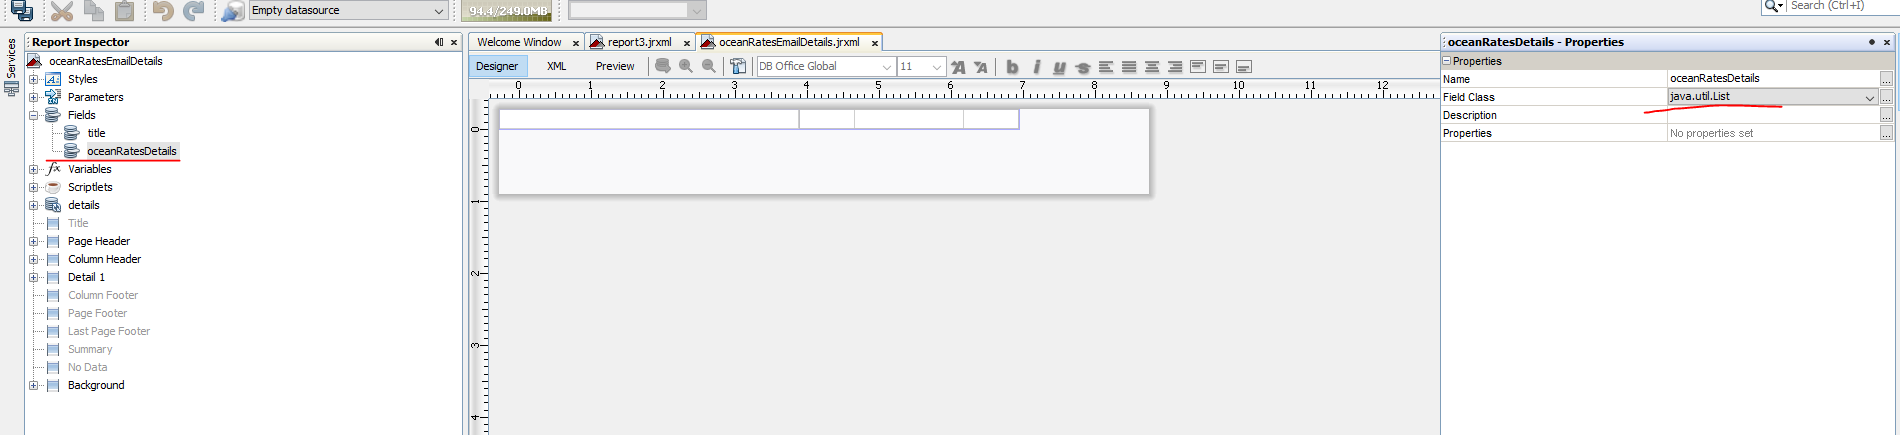
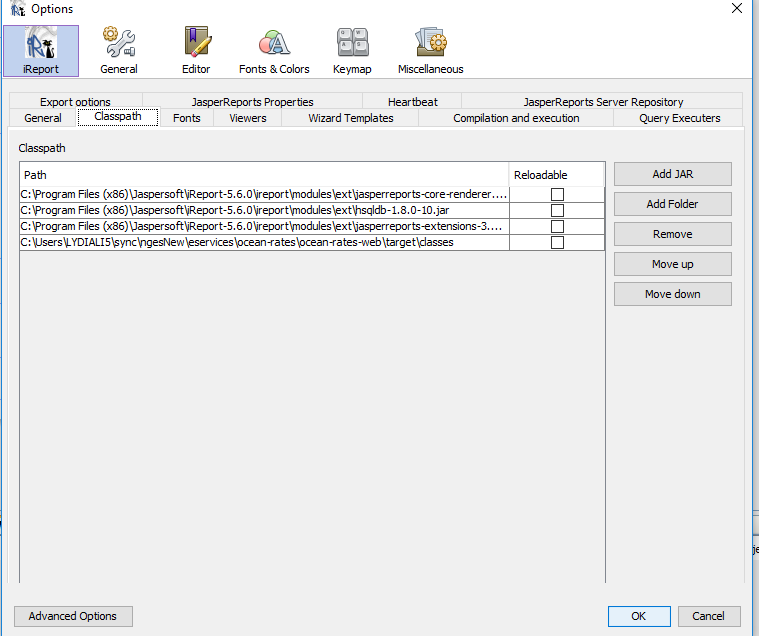
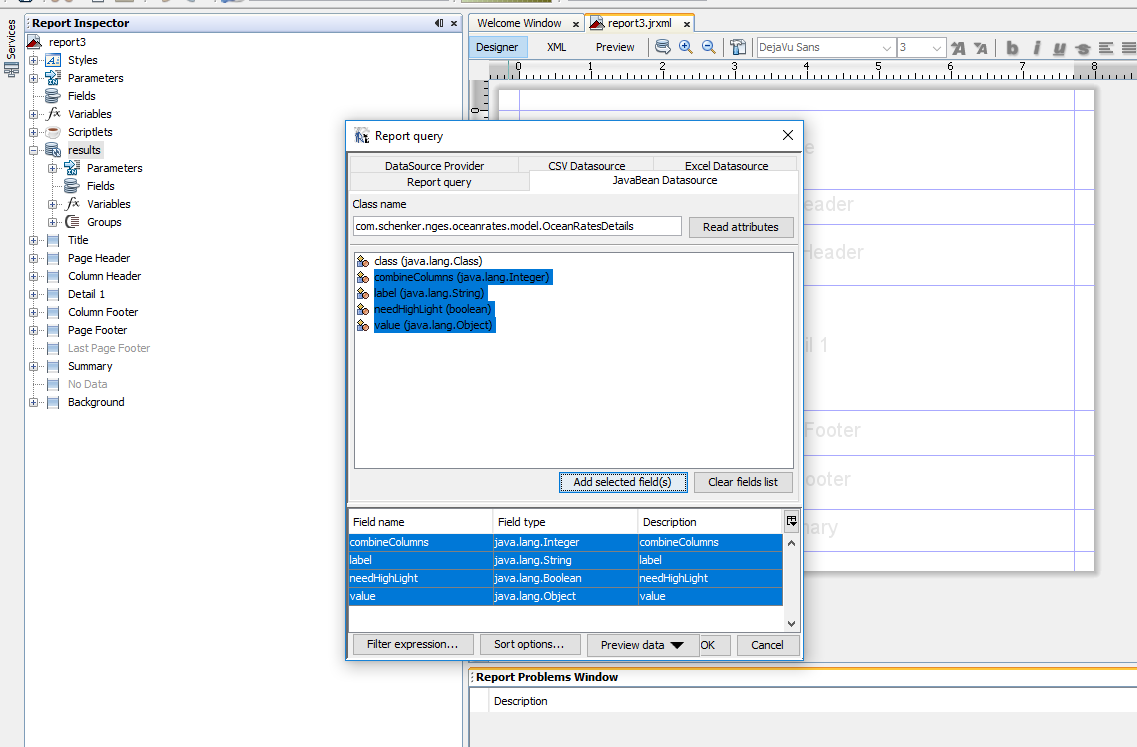
5.创建表格
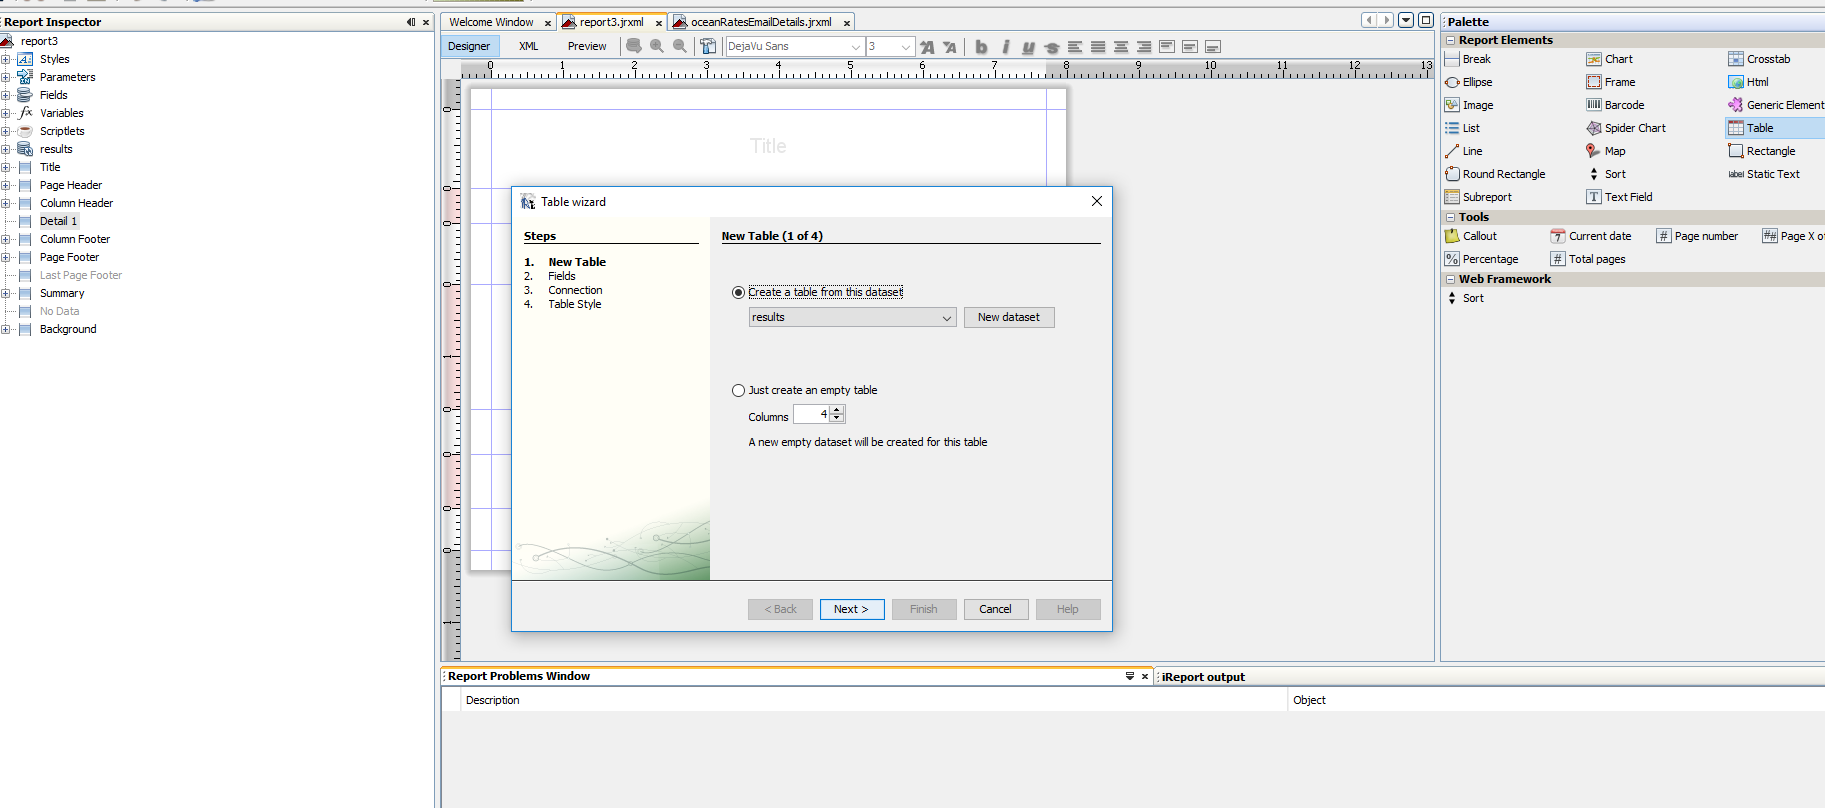
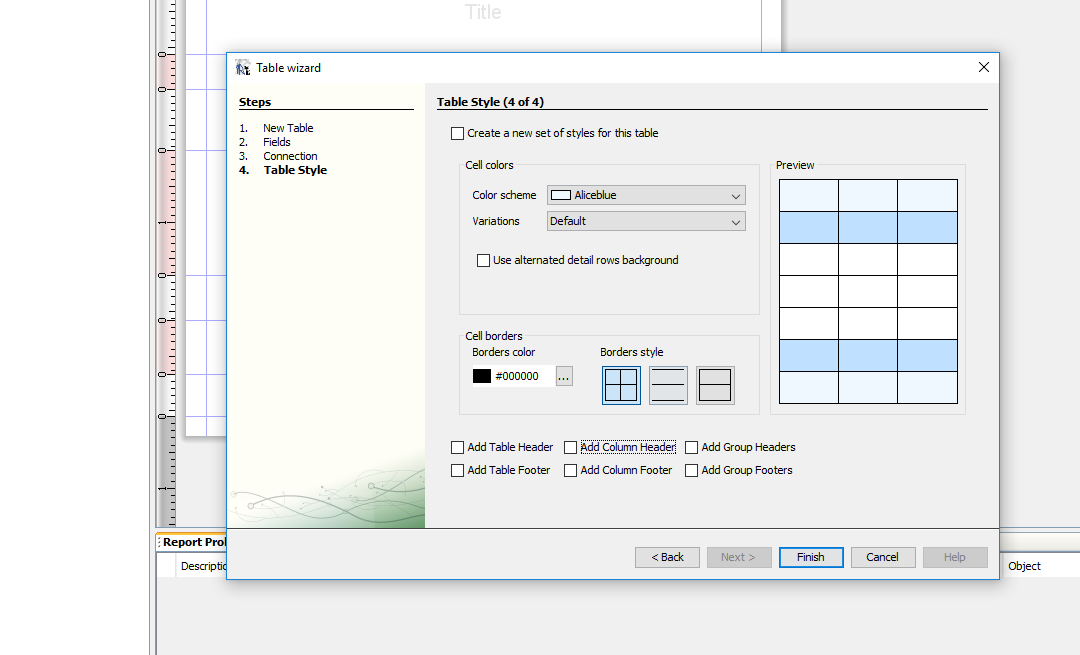
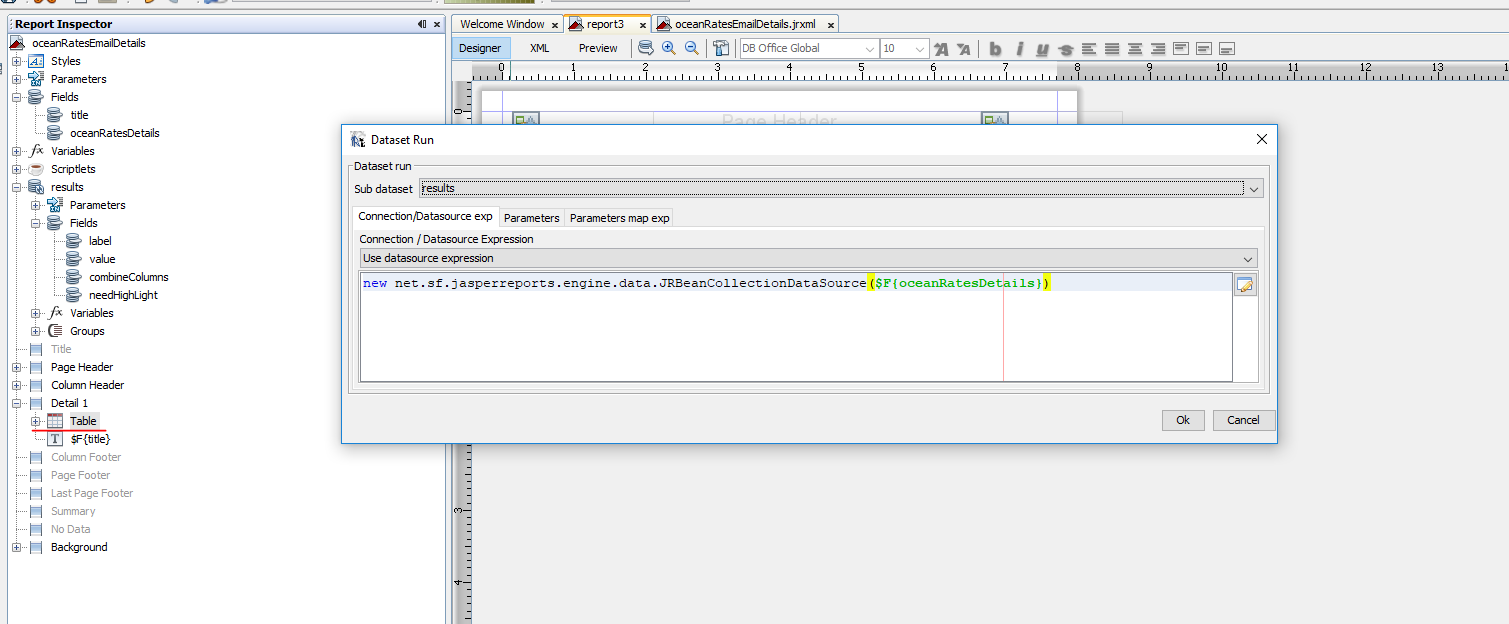
<?xml version="1.0" encoding="UTF-8"?>
<jasperReport xmlns="http://jasperreports.sourceforge.net/jasperreports" xmlns:xsi="http://www.w3.org/2001/XMLSchema-instance" xsi:schemaLocation="http://jasperreports.sourceforge.net/jasperreports http://jasperreports.sourceforge.net/xsd/jasperreport.xsd" name="oceanRatesEmailDetails" pageWidth="595" pageHeight="842" columnWidth="555" leftMargin="20" rightMargin="20" topMargin="20" bottomMargin="20" uuid="7c39aa93-0bd8-495f-acf2-8c13fccc68d9">
<property name="ireport.zoom" value="1.0"/>
<property name="ireport.x" value="0"/>
<property name="ireport.y" value="0"/>
<subDataset name="details" uuid="8fcf3031-129c-40c1-9d56-37fe078bfce7">
<field name="label" class="java.lang.String"/>
<field name="value" class="java.lang.Object"/>
<field name="combineColumns" class="java.lang.Integer"/>
<field name="needHighLight" class="java.lang.Boolean"/>
</subDataset>
<parameter name="SUBREPORT_DIR" class="java.lang.String" isForPrompting="false">
<defaultValueExpression><![CDATA[""]]></defaultValueExpression>
</parameter>
<field name="title" class="java.lang.String"/>
<field name="oceanRatesDetails" class="java.util.List"/>
<background>
<band splitType="Stretch"/>
</background>
<pageHeader>
<band height="28" splitType="Stretch">
<image>
<reportElement x="10" y="0" width="142" height="28" uuid="4074945c-59ac-4f4a-a931-f6db80a21f5f"/>
<imageExpression><![CDATA[$P{SUBREPORT_DIR} + "DB-SCHENKER_rgb_M.png"]]></imageExpression>
</image>
<textField>
<reportElement x="298" y="0" width="181" height="28" uuid="4bc7d029-9773-48bf-8be1-8af975e2c464"/>
<textElement verticalAlignment="Middle">
<font fontName="DB Office Global" size="16"/>
</textElement>
<textFieldExpression><![CDATA[$R{ocean-rates.slip-sheet-benefit.mail.header.title}]]></textFieldExpression>
</textField>
<image>
<reportElement x="479" y="0" width="142" height="28" uuid="4074945c-59ac-4f4a-a931-f63b80a23f5f"/>
<imageExpression><![CDATA[$P{SUBREPORT_DIR} + "oceanFrightSolutions.png"]]></imageExpression>
</image>
</band>
</pageHeader>
<columnHeader>
<band height="30" splitType="Stretch">
<textField>
<reportElement x="10" y="10" width="336" height="20" uuid="7309912c-bd55-41a0-88ec-142f770790eb"/>
<textElement>
<font fontName="DB Office Global" size="13" isBold="true"/>
</textElement>
<textFieldExpression><![CDATA[$R{ocean-rates.slip-sheet-benefit.title}]]></textFieldExpression>
</textField>
</band>
</columnHeader>
<detail>
<band height="125" splitType="Stretch">
<componentElement>
<reportElement key="table" mode="Opaque" x="10" y="20" width="650" height="85" uuid="d17eb789-8d34-4619-bc0d-210e5711bbfe"/>
<jr:table xmlns:jr="http://jasperreports.sourceforge.net/jasperreports/components" xsi:schemaLocation="http://jasperreports.sourceforge.net/jasperreports/components http://jasperreports.sourceforge.net/xsd/components.xsd">
<datasetRun subDataset="details" uuid="c355b7b5-7454-4ea4-8dd1-e413601ed152">
<dataSourceExpression><![CDATA[new net.sf.jasperreports.engine.data.JRBeanCollectionDataSource($F{oceanRatesDetails})]]></dataSourceExpression>
</datasetRun>
<jr:column width="300" uuid="2c546703-e51e-456c-8fac-d42cc8fece36">
<jr:detailCell height="20" rowSpan="1">
<textField>
<reportElement mode="Opaque" x="0" y="0" width="300" height="20" forecolor="#000000" backcolor="#FFFFFF" uuid="3770bd9e-d595-431a-b0bd-ed6c5813c485">
<printWhenExpression><![CDATA[$F{needHighLight}==false]]></printWhenExpression>
</reportElement>
<box topPadding="1" leftPadding="2">
<pen lineWidth="0.25"/>
<topPen lineWidth="0.25"/>
<leftPen lineWidth="0.25"/>
<bottomPen lineWidth="0.25"/>
<rightPen lineWidth="0.25"/>
</box>
<textElement>
<font fontName="DB Office Global" size="11"/>
</textElement>
<textFieldExpression><![CDATA[$F{label}]]></textFieldExpression>
</textField>
<textField>
<reportElement mode="Opaque" x="0" y="0" width="300" height="20" forecolor="#FFFFFF" backcolor="#003399" uuid="3770bc9e-d595-431a-b0bd-ed6c5823c485">
<printWhenExpression><![CDATA[$F{needHighLight}==true]]></printWhenExpression>
</reportElement>
<box topPadding="1" leftPadding="2" rightPadding="0">
<pen lineWidth="0.25" lineColor="#000000"/>
<topPen lineWidth="0.25" lineColor="#000000"/>
<leftPen lineWidth="0.25" lineColor="#000000"/>
<bottomPen lineWidth="0.25" lineColor="#000000"/>
<rightPen lineWidth="0.25" lineColor="#000000"/>
</box>
<textElement>
<font fontName="DB Office Global" size="11"/>
</textElement>
<textFieldExpression><![CDATA[$F{label}]]></textFieldExpression>
</textField>
</jr:detailCell>
</jr:column>
<jr:columnGroup width="220" uuid="a51ca014-f035-49d2-bf23-cbb80a4ef5e3">
<jr:column width="220" uuid="e7eb1ec7-cee4-4be2-a9b6-fe572d5629de">
<jr:detailCell height="20">
<textField>
<reportElement mode="Opaque" x="0" y="0" width="220" height="20" forecolor="#FFFFFF" backcolor="#003399" uuid="0ab2394e-8a4a-4ca9-af8e-7284795c6e10">
<printWhenExpression><![CDATA[$F{needHighLight}==true && $F{combineColumns}==null]]></printWhenExpression>
</reportElement>
<box topPadding="1" leftPadding="2">
<pen lineWidth="0.25" lineColor="#000000"/>
<topPen lineWidth="0.25" lineColor="#000000"/>
<leftPen lineWidth="0.25" lineColor="#000000"/>
<bottomPen lineWidth="0.25" lineColor="#000000"/>
<rightPen lineWidth="0.25" lineColor="#000000"/>
</box>
<textElement>
<font fontName="DB Office Global" size="11"/>
</textElement>
<textFieldExpression><![CDATA[""+$F{value}]]></textFieldExpression>
</textField>
<textField>
<reportElement mode="Opaque" x="0" y="0" width="220" height="20" forecolor="#000000" backcolor="#FFFFFF" uuid="0ab2294e-8a4a-4ca9-af8e-7284795c6e20">
<printWhenExpression><![CDATA[$F{needHighLight}==false && $F{combineColumns}==null]]></printWhenExpression>
</reportElement>
<box topPadding="1" leftPadding="2">
<pen lineWidth="0.25" lineColor="#000000"/>
<topPen lineWidth="0.25" lineColor="#000000"/>
<leftPen lineWidth="0.25" lineColor="#000000"/>
<bottomPen lineWidth="0.25" lineColor="#000000"/>
<rightPen lineWidth="0.25" lineColor="#000000"/>
</box>
<textElement>
<font fontName="DB Office Global" size="11"/>
</textElement>
<textFieldExpression><![CDATA[""+$F{value}]]></textFieldExpression>
</textField>
<textField>
<reportElement mode="Opaque" x="0" y="0" width="220" height="20" forecolor="#FFFFFF" backcolor="#003399" uuid="0ab2394e-8a4a-04c9-af8e-7284795c6e10">
<printWhenExpression><![CDATA[$F{needHighLight}==true && $F{combineColumns}==1]]></printWhenExpression>
</reportElement>
<box topPadding="1" leftPadding="100">
<pen lineWidth="0.25" lineColor="#000000"/>
<topPen lineWidth="0.25" lineColor="#000000"/>
<leftPen lineWidth="0.25" lineColor="#000000"/>
<bottomPen lineWidth="0.25" lineColor="#000000"/>
<rightPen lineWidth="0.25" lineColor="#000000"/>
</box>
<textElement textAlignment="Center" verticalAlignment="Middle">
<font fontName="DB Office Global" size="11"/>
</textElement>
<textFieldExpression><![CDATA[""+$F{value}]]></textFieldExpression>
</textField>
<textField>
<reportElement mode="Opaque" x="0" y="0" width="220" height="20" forecolor="#000000" backcolor="#FFFFFF" uuid="ab22944e-8a4a-4ca9-af8e-7384795c6e30">
<printWhenExpression><![CDATA[$F{needHighLight}==false && $F{combineColumns}==1]]></printWhenExpression>
</reportElement>
<box topPadding="1" leftPadding="100">
<pen lineWidth="0.25" lineColor="#000000"/>
<topPen lineWidth="0.25" lineColor="#000000"/>
<leftPen lineWidth="0.25" lineColor="#000000"/>
<bottomPen lineWidth="0.25" lineColor="#000000"/>
<rightPen lineWidth="0.25" lineColor="#000000"/>
</box>
<textElement textAlignment="Center" verticalAlignment="Middle">
<font fontName="DB Office Global" size="11"/>
</textElement>
<textFieldExpression><![CDATA[""+$F{value}]]></textFieldExpression>
</textField>
<textField>
<reportElement mode="Opaque" x="0" y="0" width="110" height="20" forecolor="#000000" backcolor="#FFFFFF" uuid="0ab2194e-8a4a-4ca9-af8e-7284795c6e10">
<printWhenExpression><![CDATA[$F{combineColumns}==2]]></printWhenExpression>
</reportElement>
<box topPadding="1" leftPadding="2">
<pen lineWidth="0.25"/>
<topPen lineWidth="0.25"/>
<leftPen lineWidth="0.25"/>
<bottomPen lineWidth="0.25"/>
<rightPen lineWidth="0.25"/>
</box>
<textElement>
<font fontName="DB Office Global" size="11"/>
</textElement>
<textFieldExpression><![CDATA[""+((ArrayList<Object>)$F{value}).get(0)]]></textFieldExpression>
</textField>
<textField>
<reportElement mode="Opaque" x="110" y="0" width="110" height="20" forecolor="#000000" backcolor="#FFFFFF" uuid="01b82940-8a4a-4cc9-af8e-7284795c6e10">
<printWhenExpression><![CDATA[$F{combineColumns}==2]]></printWhenExpression>
</reportElement>
<box topPadding="1" leftPadding="2" rightPadding="0">
<pen lineWidth="0.25"/>
<topPen lineWidth="0.25"/>
<leftPen lineWidth="0.25"/>
<bottomPen lineWidth="0.25"/>
<rightPen lineWidth="0.25"/>
</box>
<textElement>
<font fontName="DB Office Global" size="11"/>
</textElement>
<textFieldExpression><![CDATA[""+((ArrayList<Object>)$F{value}).get(1)]]></textFieldExpression>
</textField>
</jr:detailCell>
</jr:column>
</jr:columnGroup>
</jr:table>
</componentElement>
<textField>
<reportElement mode="Opaque" x="10" y="0" width="545" height="20" uuid="0961c008-c4d9-4673-827d-a2b798f5fd3c"/>
<textElement>
<font fontName="DB Office Global" size="12"/>
</textElement>
<textFieldExpression><![CDATA[$F{title}]]></textFieldExpression>
</textField>
</band>
</detail>
</jasperReport>
iReport jasperReports 生成表格的更多相关文章
- java 如何在pdf中生成表格
1.目标 在pdf中生成一个可变表头的表格,并向其中填充数据.通过泛型动态的生成表头,通过反射动态获取实体类(我这里是User)的get方法动态获得数据,从而达到动态生成表格. 每天生成一个文件夹存储 ...
- js动态生成表格
动态生成表格 *创建一个页面:两个输入框和一个按钮 *代码和步骤 /* 1.得到输入的行 ...
- Android 自动生成表格
Layout.xml <?xml version="1.0" encoding="utf-8"?> <LinearLayout xmlns:a ...
- JavaScript案例七:简单生成表格
JavaScript简单生成表格,巩固基础知识点... <!DOCTYPE html> <html> <head> <title>JavaScript简 ...
- 【转】ASP.NET中服务器控件Table动态生成表格及其属性介绍
下文所有内容转自开源中国:http://www.oschina.net/question/565065_86453#tags_nav ================================= ...
- (转载)PHP 动态生成表格
(转载)http://hi.baidu.com/shawns/item/c7d51f351c6a0482b711dba6 提要:PHP能够高效地生成HTML代码,其中,动态生成表格是实际应用中经常碰到 ...
- Ext Designer生成表格
1.生成表格代码 Ext.MyPanel=Ext.extend(Ext.Panel ,{ xtype:"panel", title:"我的面板", width: ...
- Js--动态生成表格
<div> <h1>动态生成表格</h1> <div id="table1"> 行 ...
- JS动态生成表格后 合并单元格
JS动态生成表格后 合并单元格 最近做项目碰到表格中的单元格合并的问题,需求是这样的,首先发ajax请求 请求回来后的数据 动态生成表格数据,但是生成后如果编号或者(根据其他的内容)有相同时,要合并单 ...
随机推荐
- Ubuntu下Apache配置网站根路径
安装之后apache默认的跟路径是/var/www/ 如何修改这个默认路径呢? 直接编辑/etc/apache2/sites-available/default-ssl.conf,将Docum ...
- Unity3D Shaderlab 学习记录
unity3d 定制的表面着色器(Surface Shader)的标准输出结构是这种: struct SurfaceOutput { half3 Albedo; //反射率 half3 Norm ...
- 8.spring:事务管理(上):Spring的数据库编程、编程式事务管理
Spring的数据库编程 Spring框架提供了JDBC模板模式------>JdbcTemplate 简化了开发,在开发中并不经常是使用 实际开发更多使用的是Hibernate和MyBatis ...
- HUD 1288 Hat's Tea(反向的贪心,非常好的一道题)
传送门:http://acm.hdu.edu.cn/showproblem.php?pid=1288 Hat's Tea Time Limit: 2000/1000 MS (Java/Others) ...
- performPeriodicTask
/********************************************************************* * @fn performPeriodicTask 执行 ...
- SSH整合(一)
一.ssh原始整合方式 不需要任何整合包,就是简单的将三个框架集合到一起 hibernate 导入jar包: hibernate-release-5.0.7.Fin ...
- Mybartis逆向工程
Mybartis逆向工程 0.创建工程项目,切记莫用中文,亲测在运行时报错 1.Pom文件,使用mybatis-generator插件 <?xml version="1.0" ...
- 一台ECS服务器,部署多(两)应用,且应用配置不同域名
场景 产品环境服务器有两台,前后端各分配一台服务器.现在在不增加机器的情况下,需要增加部署一套服务给台北地区服务. 现有的前端部署方案. 产品环境部署方案详解 实现 配置NAT步骤 ECS配置多网卡, ...
- Spring异常重试框架Spring Retry
Spring Retry支持集成到Spring或者Spring Boot项目中,而它支持AOP的切面注入写法,所以在引入时必须引入aspectjweaver.jar包. 快速集成的代码样例: @Con ...
- PHP的高效率写法
1.尽量静态化: 如果一个方法能被静态,那就声明它为静态的,速度可提高1/4,甚至我测试的时候,这个提高了近三倍. 当然了,这个测试方法需要在十万级以上次执行,效果才明显. 其实静态方法和非静态方法的 ...