python matplotlib
背景:
1)数据可视化
目前还处于python入门阶段,主要想通过numpy、matplotlib进行数据可视化。
安装:
操作系统:windows7
1)python2.7 安装numpy、matplotlib
pip安装numpy没有问题
pip通过tar安装matplotlib不成功,提示缺少freetype、png,反正挺麻烦的。
2)python3.5安装numpy、matplotlib
pip直接搞定,安装matplotlib的时候会安装关联的模块。
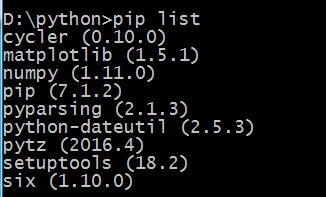
安装numpy和matplotlib后,pip list展示安装了哪些模块。
使用:
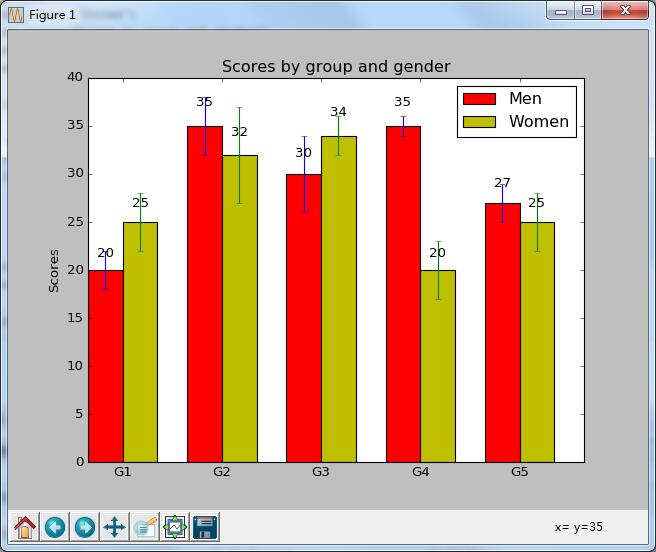
网上随便找了个例子,如下:
import numpy as np

import matplotlib.pyplot as plt

N = 5

menMeans = (20, 35, 30, 35, 27)

menStd =   (2, 3, 4, 1, 2)

ind = np.arange(N)  # the x locations for the groups

width = 0.35       # the width of the bars

fig, ax = plt.subplots()

rects1 = ax.bar(ind, menMeans, width, color='r', yerr=menStd)

womenMeans = (25, 32, 34, 20, 25)

womenStd =   (3, 5, 2, 3, 3)

rects2 = ax.bar(ind+width, womenMeans, width, color='y', yerr=womenStd)

# add some

ax.set_ylabel('Scores')

ax.set_title('Scores by group and gender')

ax.set_xticks(ind+width)

ax.set_xticklabels( ('G1', 'G2', 'G3', 'G4', 'G5') )

ax.legend( (rects1[0], rects2[0]), ('Men', 'Women') )

def autolabel(rects):

    # attach some text labels

    for rect in rects:

        height = rect.get_height()

        ax.text(rect.get_x()+rect.get_width()/2., 1.05*height, '%d'%int(height),

                ha='center', va='bottom')

autolabel(rects1)

autolabel(rects2)

plt.show()
运行图:
----------------------------------------------------
python matplotlib的更多相关文章
- python matplotlib 中文显示参数设置
python matplotlib 中文显示参数设置 方法一:每次编写代码时进行参数设置 #coding:utf-8import matplotlib.pyplot as pltplt.rcParam ...
- python matplotlib plot 数据中的中文无法正常显示的解决办法
转发自:http://blog.csdn.net/laoyaotask/article/details/22117745?utm_source=tuicool python matplotlib pl ...
- python matplotlib画图产生的Type 3 fonts字体没有嵌入问题
ScholarOne's 对python matplotlib画图产生的Type 3 fonts字体不兼容,更改措施: 在程序中添加如下语句 import matplotlib matplotlib. ...
- 使用Python matplotlib做动态曲线
今天看到“Python实时监控CPU使用率”的教程: https://www.w3cschool.cn/python3/python3-ja3d2z2g.html 自己也学习如何使用Python ma ...
- python matplotlib 中文显示乱码设置
python matplotlib 中文显示乱码设置 原因:是matplotlib库中没有中文字体.1 解决方案:1.进入C:\Anaconda64\Lib\site-packages\matplot ...
- Python - matplotlib 数据可视化
在许多实际问题中,经常要对给出的数据进行可视化,便于观察. 今天专门针对Python中的数据可视化模块--matplotlib这块内容系统的整理,方便查找使用. 本文来自于对<利用python进 ...
- 转:使用 python Matplotlib 库 绘图 及 相关问题
使用 python Matplotlib 库绘图 转:http://blog.csdn.net/daniel_ustc/article/details/9714163 Matplotlib ...
- python+matplotlib 绘制等高线
python+matplotlib 绘制等高线 步骤有七: 有一个m*n维的矩阵(data),其元素的值代表高度 构造两个向量:x(1*n)和y(1*m).这两个向量用来构造网格坐标矩阵(网格坐标矩阵 ...
- 安装python Matplotlib 库
转:使用 python Matplotlib 库 绘图 及 相关问题 使用 python Matplotlib 库绘图 转:http://blog.csdn.net/daniel_ustc ...
- python matplotlib.pyplot 散点图详解(1)
python matplotlib.pyplot散点图详解(1) 一.创建散点图 可以用scatter函数创建散点图 并使用show函数显示散点图 代码如下: import matplotlib.py ...
随机推荐
- css3之边框新属性
border属性 属性 描述 border-image 图片边框 border-radius 圆角 box-shadow 矩形阴影
- horizon 修改local的logging 配置
再部署完horizon的开发环境后,首先要做的就是修改下logging的输出. 我用的开发软件是pycharm, 所以,为了方便在 console里看到输出.需要在 /home/geiao/repo/ ...
- vijos1144(小胖守皇宫)
也是ural1039 描述 huyichen世子事件后,xuzhenyi成了皇上特聘的御前一品侍卫. 皇宫以午门为起点,直到后宫嫔妃们的寝宫,呈一棵树的形状:某些宫殿间可以互相望见.大内保卫森严,三步 ...
- java基础-反射之Class.forName
Class.forName 查阅javaAPI public static Class<?> forName(String className) throws ClassNotFoundE ...
- bzoj 1064
题意:戳这里 思路:很明显是一个图论模型.. 就两种图形: 1.图中存在环,那么就是所有环的gcd为最大答案.gcd的大于3的最小约数为最小答案 2.不存在环,那么是每个弱连通块的最长链之和为最大答案 ...
- 在myeclipse文件中如何创建properties类型的文件,从而连接数据库
File->New->File->点击->在编辑处出输入:文件名.properties 文件的主要功能连接数据库,例如: driver=oracle.jdbc.Oracle ...
- 微软BI 之SSIS 系列 - 再谈Lookup 缓存
开篇介绍 关于 Lookup 的缓存其实在之前的一篇文章中已经提到了 微软BI 之SSIS 系列 - Lookup 组件的使用与它的几种缓存模式 - Full Cache, Partial Cache ...
- Nim教程【五】
妈蛋,花了两天时间才搞定博客园的API, 比预期的时间整整多了1天, 不管怎么说,总算把博客园的客户端搞定了 这篇文章就是用博客园的客户端发布的, 先贴张图,给大家看看, 后面我会和博客园的领导商量一 ...
- vim和tmux主题颜色不一致问题
没开tmux时使用vim 以及 开了tmux后使用vim 主题颜色不一致.随便打开一个.py文件,发现着色较深,非常影响阅读. 开始在.tmux.conf 中设置set -g defaul ...
- 从源代码分析Android-Universal-Image-Loader图片下载技巧
在手机上尤其需要考虑网络对图片下载的影响,常见的情况是在2G网络.在3G网络需要不同的下载策略,也就是说在慢速网络与快速网络中下载需要考虑不同的策略.一种常见的策略就是Android客户端和服务端相配 ...