python matplotlib
背景:
1)数据可视化
目前还处于python入门阶段,主要想通过numpy、matplotlib进行数据可视化。
安装:
操作系统:windows7
1)python2.7 安装numpy、matplotlib
pip安装numpy没有问题
pip通过tar安装matplotlib不成功,提示缺少freetype、png,反正挺麻烦的。
2)python3.5安装numpy、matplotlib
pip直接搞定,安装matplotlib的时候会安装关联的模块。
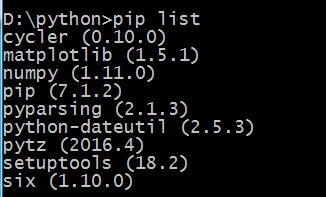
安装numpy和matplotlib后,pip list展示安装了哪些模块。
使用:
网上随便找了个例子,如下:
import numpy as np
import matplotlib.pyplot as plt N = 5
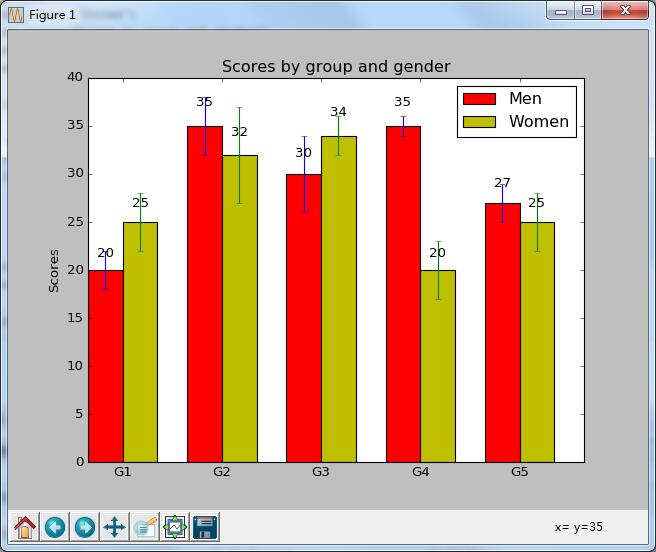
menMeans = (20, 35, 30, 35, 27)
menStd = (2, 3, 4, 1, 2) ind = np.arange(N) # the x locations for the groups
width = 0.35 # the width of the bars fig, ax = plt.subplots()
rects1 = ax.bar(ind, menMeans, width, color='r', yerr=menStd) womenMeans = (25, 32, 34, 20, 25)
womenStd = (3, 5, 2, 3, 3)
rects2 = ax.bar(ind+width, womenMeans, width, color='y', yerr=womenStd) # add some
ax.set_ylabel('Scores')
ax.set_title('Scores by group and gender')
ax.set_xticks(ind+width)
ax.set_xticklabels( ('G1', 'G2', 'G3', 'G4', 'G5') ) ax.legend( (rects1[0], rects2[0]), ('Men', 'Women') ) def autolabel(rects):
# attach some text labels
for rect in rects:
height = rect.get_height()
ax.text(rect.get_x()+rect.get_width()/2., 1.05*height, '%d'%int(height),
ha='center', va='bottom') autolabel(rects1)
autolabel(rects2) plt.show()
运行图:
----------------------------------------------------
python matplotlib的更多相关文章
- python matplotlib 中文显示参数设置
python matplotlib 中文显示参数设置 方法一:每次编写代码时进行参数设置 #coding:utf-8import matplotlib.pyplot as pltplt.rcParam ...
- python matplotlib plot 数据中的中文无法正常显示的解决办法
转发自:http://blog.csdn.net/laoyaotask/article/details/22117745?utm_source=tuicool python matplotlib pl ...
- python matplotlib画图产生的Type 3 fonts字体没有嵌入问题
ScholarOne's 对python matplotlib画图产生的Type 3 fonts字体不兼容,更改措施: 在程序中添加如下语句 import matplotlib matplotlib. ...
- 使用Python matplotlib做动态曲线
今天看到“Python实时监控CPU使用率”的教程: https://www.w3cschool.cn/python3/python3-ja3d2z2g.html 自己也学习如何使用Python ma ...
- python matplotlib 中文显示乱码设置
python matplotlib 中文显示乱码设置 原因:是matplotlib库中没有中文字体.1 解决方案:1.进入C:\Anaconda64\Lib\site-packages\matplot ...
- Python - matplotlib 数据可视化
在许多实际问题中,经常要对给出的数据进行可视化,便于观察. 今天专门针对Python中的数据可视化模块--matplotlib这块内容系统的整理,方便查找使用. 本文来自于对<利用python进 ...
- 转:使用 python Matplotlib 库 绘图 及 相关问题
使用 python Matplotlib 库绘图 转:http://blog.csdn.net/daniel_ustc/article/details/9714163 Matplotlib ...
- python+matplotlib 绘制等高线
python+matplotlib 绘制等高线 步骤有七: 有一个m*n维的矩阵(data),其元素的值代表高度 构造两个向量:x(1*n)和y(1*m).这两个向量用来构造网格坐标矩阵(网格坐标矩阵 ...
- 安装python Matplotlib 库
转:使用 python Matplotlib 库 绘图 及 相关问题 使用 python Matplotlib 库绘图 转:http://blog.csdn.net/daniel_ustc ...
- python matplotlib.pyplot 散点图详解(1)
python matplotlib.pyplot散点图详解(1) 一.创建散点图 可以用scatter函数创建散点图 并使用show函数显示散点图 代码如下: import matplotlib.py ...
随机推荐
- 清空form表单下所有的input值-------------jquery
$(':input','#' + formid).not(':button, :submit, :reset').val('').removeAttr('checked').removeAttr('s ...
- UWP深入学习三:依赖属性、附加属性和数据绑定
Dependency properties overview Custom dependency properties Attached properties overview Custom atta ...
- C# 基础(3)
跳转语句 Goto(现在一般不使用) 标志位 Flag true false 常量:(不可改变的量) 语法: Const 类型 变量名 = 常量值 在定义时赋值,其他地方不能赋值 枚举 是自己定义了一 ...
- json+servlet+ajax
json-lib-2.3-jdk15.jar commons-beanutils-1.7.0.jar commons-httpclient-3.1.jar commons-lang-2.3.jar c ...
- Java 关键字、标识符、注释、常量与变量、数据类型,算术、赋值、比较、逻辑、位、三元运算符和流程控制、break、continue【3】
若有不正之处,请多多谅解并欢迎批评指正,不甚感激.请尊重作者劳动成果: 本文原创作者:pipi-changing本文原创出处:http://www.cnblogs.com/pipi-changing/ ...
- 开始学CI
未来一段时间的学习计划 1.codeIgniter 2.angular JS 深入 3.react 4.python 边工作边学习,保持进步
- stopImmediatePropagation的应用
在众多的方法里面,event.stopImmediatePropagation 算是比较少用的一个方法,拼写上感觉一半像 event.stopPropagation.对于stopPropagation ...
- Robot Framework-Windows版本安装
Robot Framework-Mac版本安装 Robot Framework-Windows版本安装 Robot Framework-工具简介及入门使用 Robot Framework-Databa ...
- 中兴手机关闭3G网络
手机总是自动在2G和3G之间切换,关闭3G算了. 拨*983*683# 出来画面,然后选GSM Only即可 网上还有另一种方法: *#*#4636#*#* 在这个里,我没有找到GSM Only
- 使用ODP.NET一次执行多句SQL语句
在实际开发的时候有的时候希望一次执行多句SQL语句,又不想使用Transcation的话,可以直接将多句SQL语句拼接起来.例如: var sql = "Begin " + &qu ...