Prometheus + Grafana 部署说明之「安装」
说明
在前面的Prometheus学习系列文章里,大致介绍说明了Prometheus和Grafana的一些使用,现在开始介绍如何从头开始部署Prometheus+Grafana,来监控各个相关的指标数据来进行展示。
部署
Prometheus基于Golang编写(需要安装),编译后的软件包,不依赖于任何的第三方依赖。用户只需要下载对应平台的二进制包,解压并且添加基本的配置即可正常启动Prometheus Server。
环境:
系统:

centos-release--4.1708.el7.centos.x86_64

IP:10.47.97.47

Prometheus:

prometheus-2.14.

Grafana:

grafana-6.5.-
下载:
:Prometheuswget https://github.com/prometheus/prometheus/releases/download/v2.14.0/prometheus-2.14.0.linux-amd64.tar.gz

:Grafana:

wget https://dl.grafana.com/oss/release/grafana-6.5.1-1.x86_64.rpm
安装
1: Prometheus 安装
- 添加用户prometheus
useradd --no-create-home --shell /bin/false prometheus
- 创建相关目录
mkdir /etc/prometheus

mkdir /var/lib/prometheus - 改目录权限
chown prometheus:prometheus /etc/prometheus

chown prometheus:prometheus /var/lib/prometheus - 解压 & 移动到相应目录
tar xvf prometheus-2.14..linux-amd64.tar.gz

cp prometheus-2.14..linux-amd64/prometheus /usr/local/bin/

cp prometheus-2.14..linux-amd64/promtool /usr/local/bin/

cp -r prometheus-2.14..linux-amd64/consoles/ /etc/prometheus/

cp -r prometheus-2.14..linux-amd64/console_libraries/ /etc/prometheus/

cp prometheus-2.14..linux-amd64/prometheus.yml /etc/prometheus/

chown prometheus:prometheus /usr/local/bin/prometheus

chown prometheus:prometheus /usr/local/bin/promtool

chown -R prometheus:prometheus /etc/prometheus/consoles

chown -R prometheus:prometheus /etc/prometheus/console_libraries

chown -R prometheus:prometheus /etc/prometheus/prometheus.yml - 配置Prometheus service,端口为9099
vim /etc/systemd/system/prometheus.service
[Unit]

Description=Prometheus

Wants=network-online.target

After=network-online.target

[Service]

User=prometheus

Group=prometheus

Type=simple

ExecStart=/usr/local/bin/prometheus \

    --config.file /etc/prometheus/prometheus.yml \

    --storage.tsdb.path /var/lib/prometheus/ \

    --web.console.templates=/etc/prometheus/consoles \

    --web.console.libraries=/etc/prometheus/console_libraries \

    --web.listen-address=:

[Install]

WantedBy=multi-user.target - 加载systemd服务 & 启动
# 加载

systemctl daemon-reload
# 开机启动
systemctl enable prometheus.service

# 启动

systemctl start prometheus

# 查看状态

systemctl status prometheus - 查看状态:systemctl status prometheus
# systemctl status prometheus

● prometheus.service - Prometheus

   Loaded: loaded (/etc/systemd/system/prometheus.service; enabled; vendor preset: disabled)

   Active: active (running) since Mon -- :: CST; 1min 8s ago

 Main PID:  (prometheus)

   CGroup: /system.slice/prometheus.service

           └─ /usr/local/bin/prometheus --config.file /etc/prometheus/prometheus.yml --storage.tsdb.path /var/lib/prometheus/ --web.console.templates=/etc/prometheus/consoles --web.console.librari...

Dec  :: test26-mysql03 prometheus[]: level=info ts=--09T10::.175Z caller=head.go: component=tsdb msg="WAL segment loaded" segment= maxSegment=

Dec  :: test26-mysql03 prometheus[]: level=info ts=--09T10::.175Z caller=head.go: component=tsdb msg="WAL segment loaded" segment= maxSegment=

Dec  :: test26-mysql03 prometheus[]: level=info ts=--09T10::.176Z caller=head.go: component=tsdb msg="WAL segment loaded" segment= maxSegment=

Dec  :: test26-mysql03 prometheus[]: level=info ts=--09T10::.178Z caller=head.go: component=tsdb msg="WAL segment loaded" segment= maxSegment=

Dec  :: test26-mysql03 prometheus[]: level=info ts=--09T10::.178Z caller=head.go: component=tsdb msg="WAL segment loaded" segment= maxSegment=

Dec  :: test26-mysql03 prometheus[]: level=info ts=--09T10::.180Z caller=main.go: fs_type=EXT4_SUPER_MAGIC

Dec  :: test26-mysql03 prometheus[]: level=info ts=--09T10::.180Z caller=main.go: msg="TSDB started"

Dec  :: test26-mysql03 prometheus[]: level=info ts=--09T10::.180Z caller=main.go: msg="Loading configuration file" filename=/etc/prometheus/prometheus.yml

Dec  :: test26-mysql03 prometheus[]: level=info ts=--09T10::.182Z caller=main.go: msg="Completed loading of configuration file" filename=/etc/prometheus/prometheus.yml

Dec :: test26-mysql03 prometheus[]: level=info ts=--09T10::.182Z caller=main.go: msg="Server is ready to receive web requests." - 命令行启动:
sudo -u prometheus /usr/local/bin/prometheus --config.file /etc/prometheus/prometheus.yml --storage.tsdb.path /var/lib/prometheus/ --web.console.templates=/etc/prometheus/consoles --web.console.libraries=/etc/prometheus/console_libraries --web.listen-address=:
- 访问URL:
http://10.47.97.47:9099/graph
- 配置文件:
# my global config

global:

  scrape_interval:     15s # Set the scrape interval to every  seconds. Default is every  minute.

  evaluation_interval: 15s # Evaluate rules every  seconds. The default is every  minute.

  # scrape_timeout is set to the global default (10s).

# Alertmanager configuration

alerting:

  alertmanagers:

  - static_configs:

    - targets:

      # - alertmanager:

# Load rules once and periodically evaluate them according to the global 'evaluation_interval'.

rule_files:

  # - "first_rules.yml"

  # - "second_rules.yml"

# A scrape configuration containing exactly one endpoint to scrape:

# Here it's Prometheus itself.

scrape_configs:

  # The job name is added as a label `job=<job_name>` to any timeseries scraped from this config.

  - job_name: 'prometheus'

    # metrics_path defaults to '/metrics'

    # scheme defaults to 'http'.

    static_configs:

    - targets: ['localhost:9099']

  - job_name: 'node_exporter'

    scrape_interval: 1s

    static_configs:

    - targets: ['a:9199','b:9199','c:9199','d:9199']

    relabel_configs:

    - action: replace

      source_labels: ['__address__']  ##源标签

      regex: (.*):(.*)             ##正则,会匹配到__address__值

      replacement: $       ##引用正则匹配到的内容

target_label: HOSTNAME ##赋予新的标签,名为HOSTNAME之后可以访问到Prometheus的Web界面。到此Prometheus的安装结束。更多的参数可以看Prometheus学习系列(二)之Prometheus FIRST STEPS和Prometheus学习系列(四)之Prometheus 配置说明
2: Grafana 安装
- 下载完rpm包之后,直接执行:
sudo yum localinstall grafana-6.5.-.x86_64.rpm
- 安装完之后进行Grafana配置的修改:修改端口 vim /etc/grafana/grafana.ini ,关于配置说明请见:官方文档、Grafana配置和Grafana 配置文件详解
http_port =
- 加载systemd服务 & 启动
直接启动

$ sudo service grafana-server start
#配置为在引导时启动
$ sudo /sbin/chkconfig --add grafana-server
#加载
$ systemctl daemon-reload
#开启
$ systemctl start grafana-server
#查看状态
$ systemctl status grafana-server
#开启启动
sudo systemctl enable grafana-server.service - 日志&数据目录
日志目录:

配置为在引导时启动

数据目录:

/var/lib/grafana/grafana.db - 访问URL:
http://10.47.97.47:3333
在1、2操作中,已经把Prometheus和Grafana安装完毕,现在开始安装Exporter来采集数据。
3.Exporter 安装
① node_exporter 安装
node_exporter的作用是用于机器系统数据收集,监控服务器CPU、内存、磁盘、I/O、网络等等信息。
- 下载
wget https://github.com/prometheus/node_exporter/releases/download/v0.18.1/node_exporter-0.18.1.linux-amd64.tar.gz
- 安装
# 解压

tar xvf node_exporter-0.18..linux-amd64.tar.gz

cp node_exporter /usr/sbin/

#帮助

node_exporter --help

#开启,端口:

node_exporter --web.listen-address=:9199 - 加载systemd服务 & 启动 vim /etc/systemd/system/node_exporter.service
[Unit]

Description=node_exporter

Documentation=https://prometheus.io/

After=network.target

[Service]

Type=simple

User=prometheus

ExecStart=/usr/sbin/node_exporter --web.listen-address=:9199

Restart=on-failure

[Install]

WantedBy=multi-user.target
systemctl 启动
# 加载

systemctl daemon-reload

# 开机启动

systemctl enable node_exporter.service

# 启动

systemctl start node_exporter

# 查看状态

systemctl status node_exporter
此时,node_exporter启动后已经开始采集指标信息,可以通过地址访问:http://10.47.97.47:9199/metrics
② mysqld_exporter 安装
mysqld_exporter的作用是用于MySQL数据库数据收集。
- 下载
wget https://github.com/prometheus/mysqld_exporter/releases/download/v0.12.1/mysqld_exporter-0.12.1.linux-amd64.tar.gz
- 安装
# 解压

tar xvf mysqld_exporter-0.12..linux-amd64.tar.gz

cp mysqld_exporter /usr/sbin/

#帮助

mysqld_exporter --help

#连接被监控数据库,数据库信息保存在以下的任意一个地方

:环境变量

export DATA_SOURCE_NAME='user:password@(hostname:3306)/'

./mysqld_exporter <flags>

:配置文件

vim ~/.my.cnf

[client]

host=10.27.27.27

port=

user=root

password=root - 启动
可以放到systemctl里启动,也可以直接运行:./mysqld_exporter
INFO[] Starting mysqld_exporter (version=0.12., branch=HEAD, revision=48667bf7c3b438b5e93b259f3d17b70a7c9aff96) source="mysqld_exporter.go:257"
INFO[] Build context (go=go1.12.7, user=root@0b3e56a7bc0a, date=-::) source="mysqld_exporter.go:258"
INFO[] Enabled scrapers: source="mysqld_exporter.go:269"
INFO[] --collect.global_status source="mysqld_exporter.go:273"
INFO[] --collect.global_variables source="mysqld_exporter.go:273"
INFO[] --collect.slave_status source="mysqld_exporter.go:273"
INFO[] --collect.info_schema.innodb_cmp source="mysqld_exporter.go:273"
INFO[] --collect.info_schema.innodb_cmpmem source="mysqld_exporter.go:273"
INFO[] --collect.info_schema.query_response_time source="mysqld_exporter.go:273"
INFO[] Listening on : source="mysqld_exporter.go:283"
其他的exporter可以见官网。
可视化监控
上面已经安装部署好了Prometheus、Grafana和Exporter,现在需要把这3者联系起来进行数据展示。如已经安装了node_exporter,需要把node_exporter采集的信息配置到Prometheus上。即修改Prometheus配置文件:
在scrape_configs选项组下面添加:
  - job_name: 'node_exporter'

    scrape_interval: 1s

    static_configs:

    - targets: ['localhost:9199']
重启Prometheus:
systemctl restart prometheus
此时可以在Prometheus上进行出图了:通过相关的PromSQL得到各种数据指标,如node_load5。Prometheus上面比较适合做一些调试,不适合看监控指标,需要把结果放到Grafana上进行展示。
在Grafana上(http://10.47.97.47:3333)进行配置数据源。把Prometheus(http://10.47.97.47:9099)做为数据源添加进去。如:

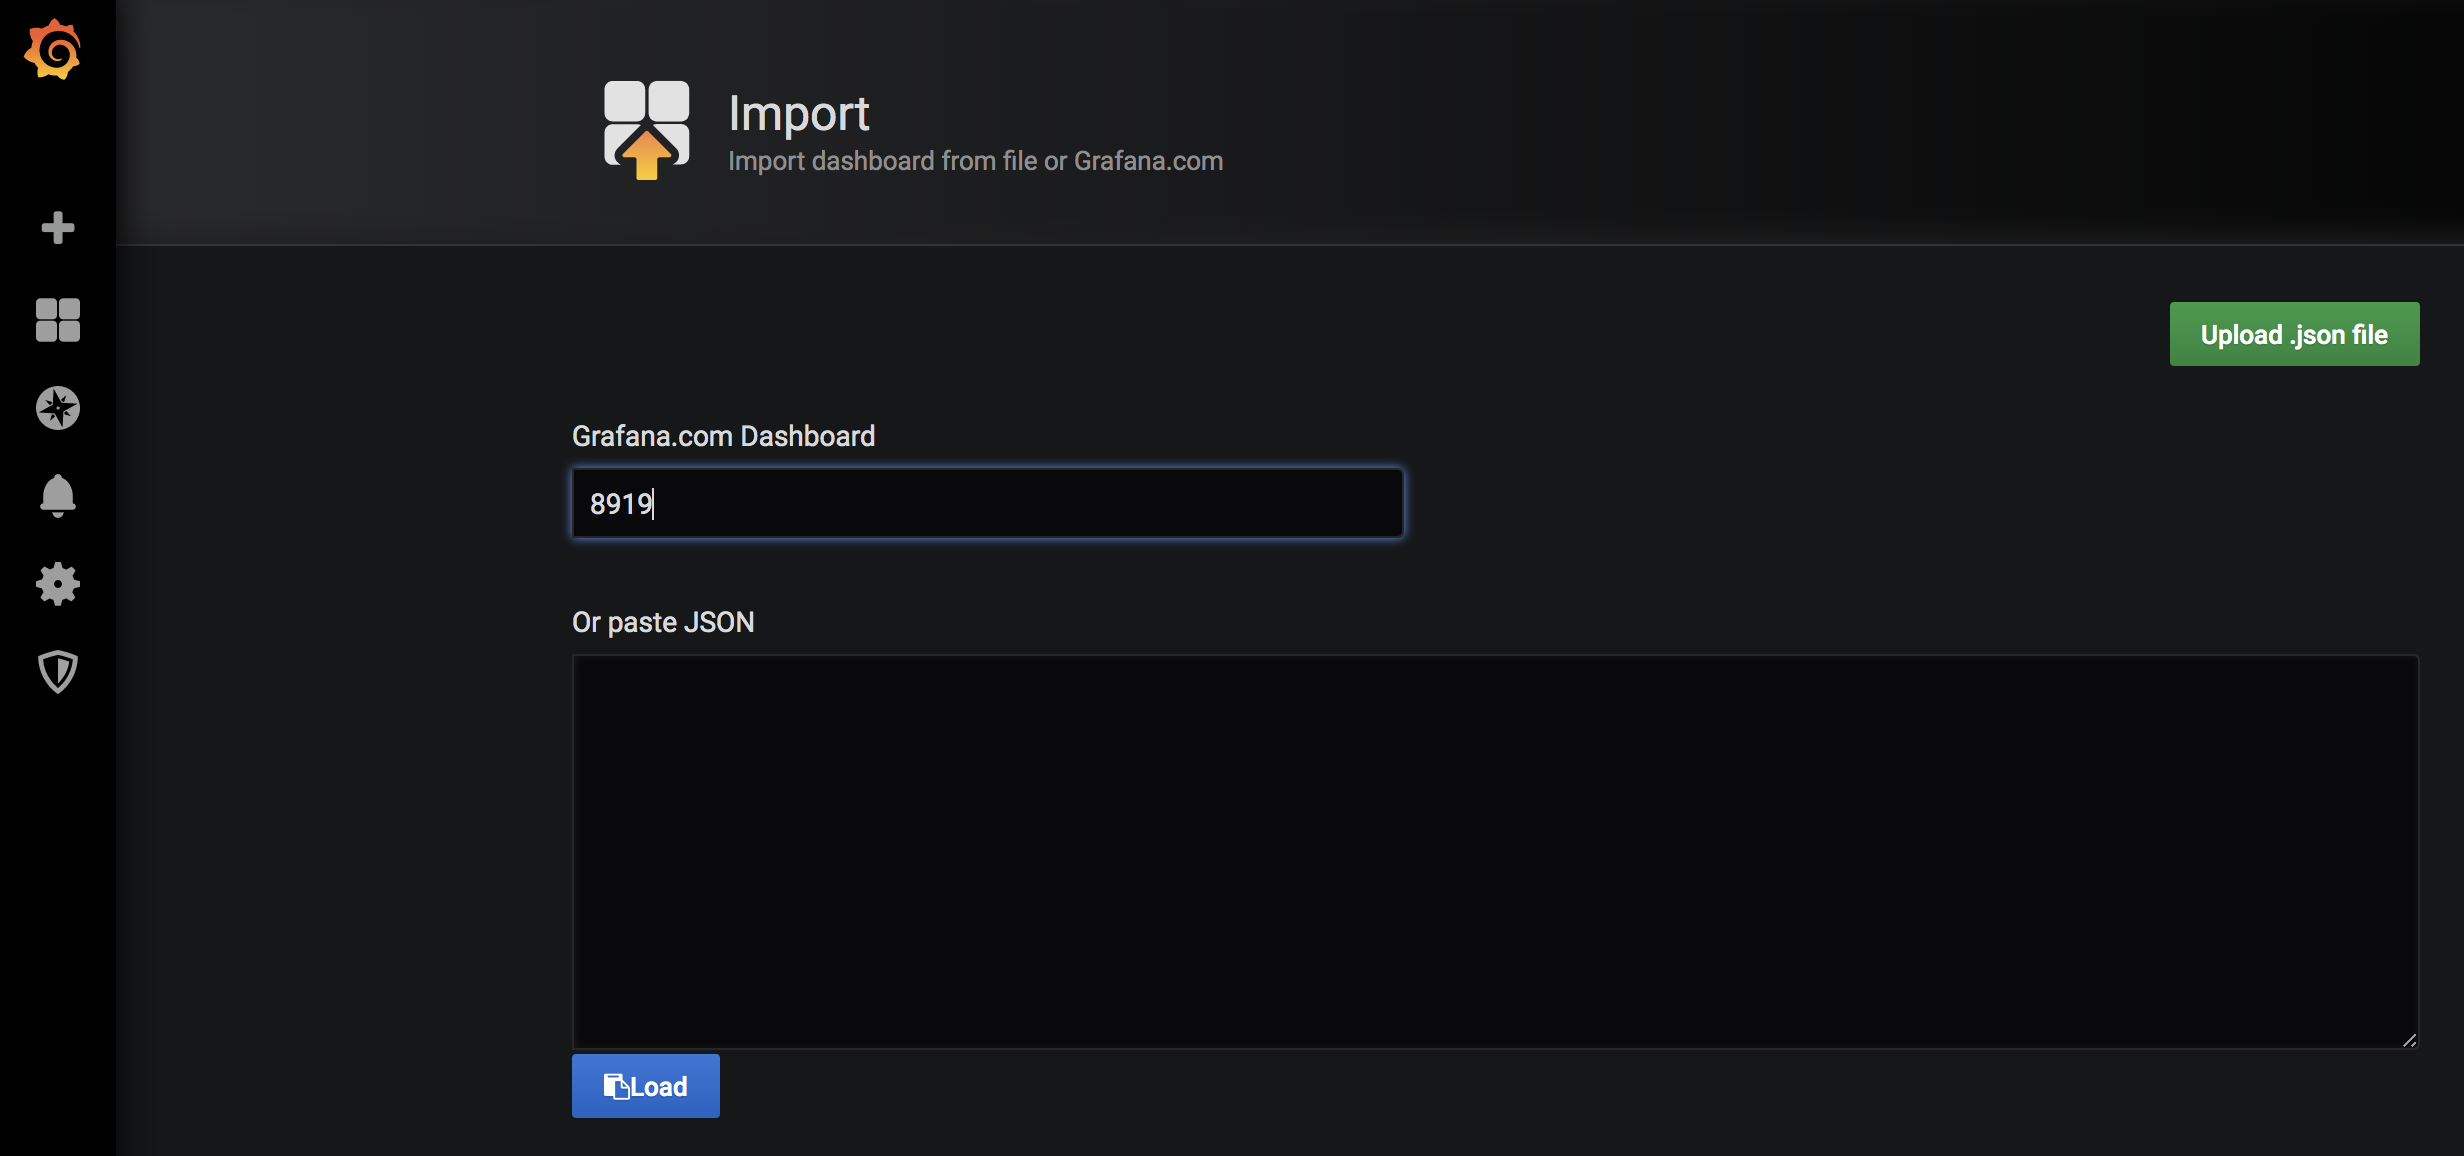
根据实际情况设置好各个值,保存完成。 然后去官网找个模板导入:比如导入的ID是8919:
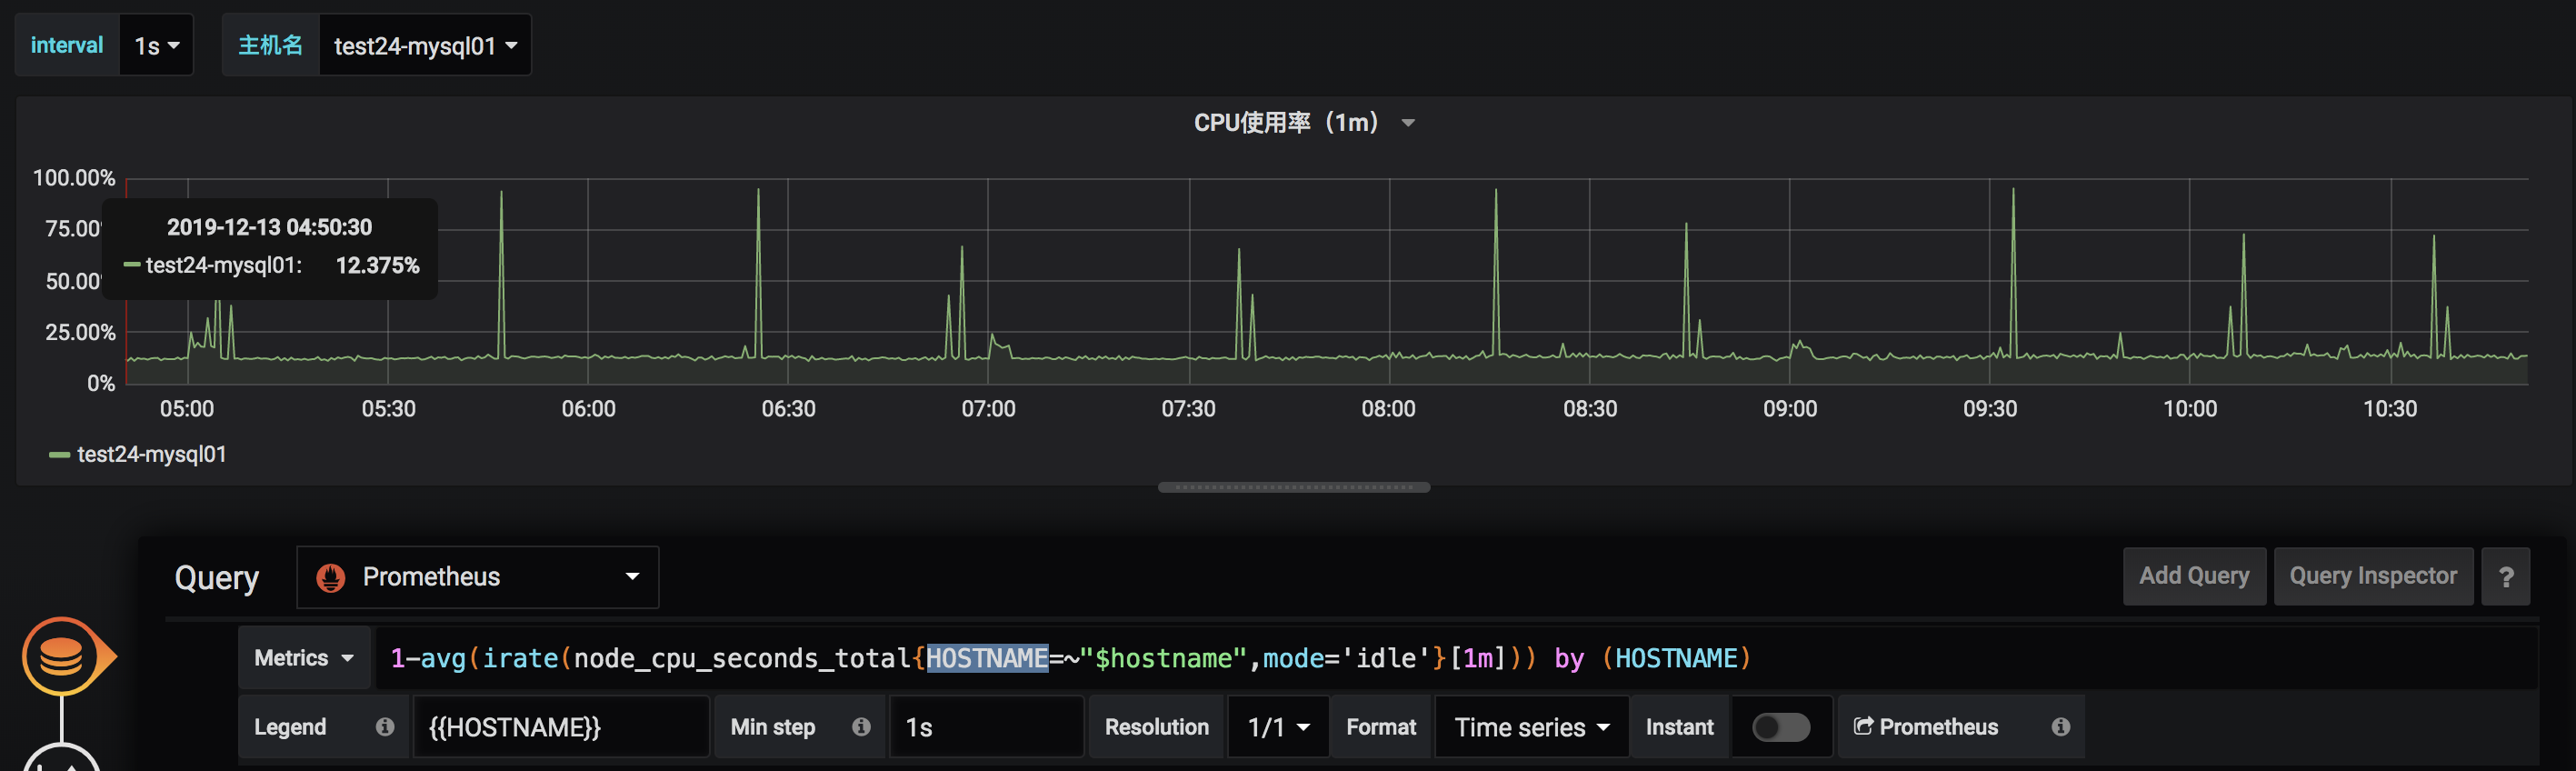
完成之后,可以看到相关的监控图标了。现在根据表达式自定义一个图:如定义一个CPU使用率:
-avg(irate(node_cpu_seconds_total{HOSTNAME=~"$hostname",mode='idle'}[1m])) by (HOSTNAME)
HOSTNAME:node_cpu_seconds_total metrice里的一个label。
$hostname:在设置里设置的一个变量。最终展示图如:
关于更多的图可以自行定义,关于PromSQL可以见Prometheus PromQL说明
Prometheus + Grafana 部署说明之「安装」的更多相关文章
- prometheus + grafana部署RabbitMQ监控
prometheus + grafana部署RabbitMQ监控 1.grafana导入dashboards https://grafana.com/dashboards/2121 2.expor ...
- Kubernetes+Prometheus+Grafana部署笔记
一.基础概念 1.1 基础概念 Kubernetes(通常写成“k8s”)Kubernetes是Google开源的容器集群管理系统.其设计目标是在主机集群之间提供一个能够自动化部署.可拓展.应用容器可 ...
- Grafana部署监控docker服务
Grafana部署监控docker服务 一.使用InfluxDB+cAdvisor+Grafana配置Docker监控 1.1Docker监控组件 1.2cAdvisor: 1.3Docker监控安装 ...
- SpringCloud微服务实战——搭建企业级开发框架(四十五):【微服务监控告警实现方式二】使用Actuator(Micrometer)+Prometheus+Grafana实现完整的微服务监控
无论是使用SpringBootAdmin还是使用Prometheus+Grafana都离不开SpringBoot提供的核心组件Actuator.提到Actuator,又不得不提Micrometer ...
- prometheus+grafana监控mysql
prometheus+grafana监控mysql 1.安装配置MySQL官方的 Yum Repository(有mysql只需设置监控账号即可) [root@localhost ~]# wget - ...
- SpringBoot2.x整合Prometheus+Grafana【附源码+视频】
图文并茂,新手入门教程,建议收藏 SpringBoot2.x整合Prometheus+Grafana[附源码+视频] 附源码+视频 目录 工程简介 简介 Prometheus grafana Spri ...
- prometheus + grafana安装部署(centos6.8)
官方网址:https://prometheus.io/ GitHub网址:https://github.com/prometheus/prometheus 软件下载地址:https://prometh ...
- kubernetes(k8s) Prometheus+grafana监控告警安装部署
主机数据收集 主机数据的采集是集群监控的基础:外部模块收集各个主机采集到的数据分析就能对整个集群完成监控和告警等功能.一般主机数据采集和对外提供数据使用cAdvisor 和node-exporter等 ...
- Prometheus+Grafana监控部署实践
参考文档: Prometheus github:https://github.com/prometheus grafana github:https://github.com/grafana/graf ...
随机推荐
- C++中用stringstream类进行数据类型的转换
我们在进行C++编程过程中,经常需要进行数据类型的转换. stringstream 类的作用就是进行数据类型转换.要想在程序中使用 stringstream 类,我们需要在源程序文件中包含头文件inc ...
- Vue 路由规则--传参数
1,query方法去获取参数 <!DOCTYPE html> <html lang="en"> <head> <meta charset= ...
- AIM Tech Round (Div. 2)
A. Save Luke 题意:给一个人的长度d,然后给一个区间长度0~L,给你两个子弹的速度v1,v2,两颗子弹从0和L向中间射去(其实不是子弹,是一种电影里面那种绞牙机之类的东西就是一个人被困在里 ...
- 【codeforces 764C】Timofey and a tree
time limit per test2 seconds memory limit per test256 megabytes inputstandard input outputstandard o ...
- 微信小程序之在线试题(1)
最近在做一套公司的市场化培训项目,涉及到手机端在线答题的设计,首先摒弃app的模式,那就只剩下微信公众号和小程序,而公众号是可以关联小程序,所以我们只需要做好一套小程序. 因为篇幅问题,下面只讲解在线 ...
- 响应式自适应布局代码,rem布局
响应式自适应布局代码 首先是先设置根字体大小,PC端一般是16px为根字体,移动端会有不同的,根据情况来设置 js部分 document.querySelector('html').style.fon ...
- Js中没有方法的重载
<script type="text/javascript"> //方法名相同,后面的方法覆盖了前面的方法.后面的方法需要一个name,但没给传值,所以是undefin ...
- Linux 内核存取配置空间
在驱动已探测到设备后, 它常常需要读或写 3 个地址空间: 内存, 端口, 和配置. 特别 地, 存取配置空间对驱动是至关重要的, 因为这是唯一的找到设备被映射到内存和 I/O 空间的位置的方法. 因 ...
- CF1137 C. Museums Tour
CF1137 C. Museums Tour 一般来说的正常思路:看到有向图的第一思路都是缩点(但是要分析一波证明强联通分量中的个体可以拼凑成整体,一般都是边和点可以经过无数次然后贡献只算一次这种类型 ...
- MFC 封装类为静态链接库
mfc自带的基本控件都不怎么美观,所以一般开发者都会自定义类对控件进行重绘.手里也积累了不少控件的重绘,对对话框.静态文本.列表框等. 但是每次都要把这些类重新导入到新的工程里,比较麻烦,而且我也不想 ...