Prometheus+Grafana监控部署实践
参考文档:
- Prometheus github:https://github.com/prometheus
- grafana github:https://github.com/grafana/grafana
- Prometheus getting_started:https://prometheus.io/docs/prometheus/latest/getting_started/
- Prometheus node_exporter:https://github.com/prometheus/node_exporter
- Prometheus部署(docker,optional):https://prometheus.io/docs/prometheus/latest/installation/
- Prometheus配置文件详解:https://prometheus.io/docs/prometheus/latest/configuration/configuration/
- grafana 部署:http://docs.grafana.org/installation/rpm/
一.环境
1. 拓扑
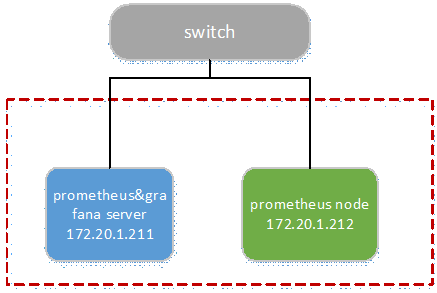
2. 节点
|
Node |
OS |
Hostname |
IP |
Remark |
|
prometheus& grafana server |
centos 7.4 |
prometheus |
172.20.1.211 |
|
|
prometheus node |
centos 7.4 |
node1 |
172.20.1.212 |
3. 版本(截止20171130)
|
Soft/Node |
Version |
Download |
|
prometheus |
2.0.0 |
|
|
node_exporter |
v0.15.1 |
|
|
grafana |
4.6.2-1 |
https://s3-us-west-2.amazonaws.com/grafana-releases/release/grafana-4.6.2-1.x86_64.rpm |
二.部署prometheus
在prometheus& grafana server节点部署prometheus服务。
1. 下载&部署
# 下载
[root@prometheus src]# cd /usr/local/src/
[root@prometheus src]# wget https://github.com/prometheus/prometheus/releases/download/v2.0.0/prometheus-2.0.0.linux-amd64.tar.gz # 部署到/usr/local/目录
# promethus不用编译安装,解压目录中有配置文件与启动文件
[root@prometheus src]# tar -zxvf prometheus-2.0.0.linux-amd64.tar.gz -C /usr/local/
[root@prometheus src]# cd /usr/local/
[root@prometheus local]# mv prometheus-2.0.0.linux-amd64/ prometheus/ # 验证
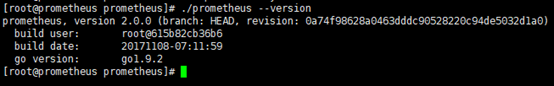
[root@prometheus local]# cd prometheus/
[root@prometheus prometheus]# ./prometheus --version
2. 配置文件
# 解压目录中的prometheus.yml

# 简单验证,主要配置采用默认文件配置,有修改/新增处用红色标示

[root@prometheus prometheus]# vim prometheus.yml

# 全局配置

global:

  scrape_interval:     15s # 设置抓取(pull)时间间隔,默认是1m

  evaluation_interval: 15s # 设置rules评估时间间隔,默认是1m

  # scrape_timeout is set to the global default (10s).

# 告警管理配置,暂未使用,默认配置

alerting:

  alertmanagers:

  - static_configs:

    - targets:

      # - alertmanager:9093

# 加载rules,并根据设置的时间间隔定期评估,暂未使用,默认配置

rule_files:

  # - "first_rules.yml"

  # - "second_rules.yml"

# 抓取(pull),即监控目标配置

# 默认只有主机本身的监控配置

scrape_configs:

  # 监控目标的label(这里的监控目标只是一个metric,而不是指某特定主机,可以在特定主机取多个监控目标),在抓取的每条时间序列表中都会添加此label

  - job_name: 'prometheus'

    # metrics_path defaults to '/metrics'

    # scheme defaults to 'http'.

    # 可覆盖全局配置设置的抓取间隔,由15秒重写成5秒。

    scrape_interval: 5s

    # 静态指定监控目标,暂不涉及使用一些服务发现机制发现目标

static_configs:

      - targets: ['localhost:9090']

        # (opentional)再添加一个label,标识了监控目标的主机

labels:

          instance: prometheus

  - job_name: 'linux'

    scrape_interval: 10s

static_configs:

  # 采用node_exporter默认开放的端口

      - targets: ['172.20.1.212:9100']

labels:

          instance: node1
3. 设置用户
# 添加用户,后期用此账号启动服务

[root@prometheus prom etheus]# groupadd prometheus

[root@prometheus prometheus]# useradd -g prometheus -s /sbin/nologin prometheus

# 赋权

[root@prometheus prometheus]# cd ~

[root@prometheus ~]# chown -R prometheus:prometheus /usr/local/prometheus/

# 创建prometheus运行数据目录

[root@prometheus ~]# mkdir -p /var/lib/prometheus

[root@prometheus ~]# chown -R prometheus:prometheus /var/lib/prometheus/
4. 设置开机启动
[root@prometheus ~]# touch /usr/lib/systemd/system/prometheus.service

[root@prometheus ~]# chown prometheus:prometheus /usr/lib/systemd/system/prometheus.service

[root@prometheus ~]# vim /usr/lib/systemd/system/prometheus.service

[Unit]

Description=Prometheus

Documentation=https://prometheus.io/

After=network.target

[Service]

# Type设置为notify时,服务会不断重启

Type=simple

User=prometheus

# --storage.tsdb.path是可选项,默认数据目录在运行目录的./dada目录中

ExecStart=/usr/local/prometheus/prometheus --config.file=/usr/local/prometheus/prometheus.yml --storage.tsdb.path=/var/lib/prometheus

Restart=on-failure

[Install]

WantedBy=multi-user.target

# 设置开机启动

[root@prometheus ~]# systemctl enable Prometheus

[root@prometheus ~]# systemctl start prometheus
5. 设置iptables
[root@prometheus ~]# vim /etc/sysconfig/iptables

-A INPUT -p tcp -m state --state NEW -m tcp --dport 9090 -j ACCEPT

[root@prometheus ~]# service iptables restart
6. 启动并验证
1)查看服务状态
[root@prometheus ~]# systemctl status prometheus
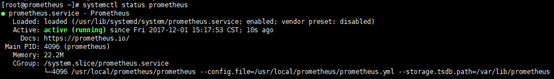
[root@prometheus ~]# netstat -tunlp | grep 9090

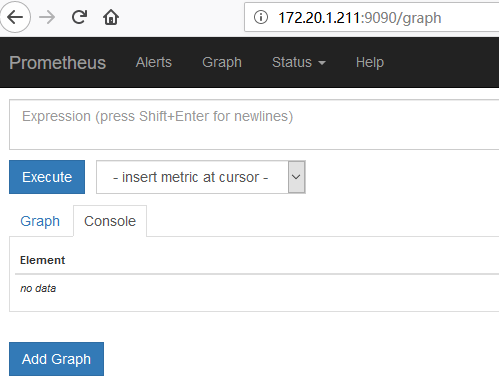
2)web ui
Prometheus自带有简单的UI,http://172.20.1.211:9090
在Status菜单下,Configuration,Rule,Targets等,
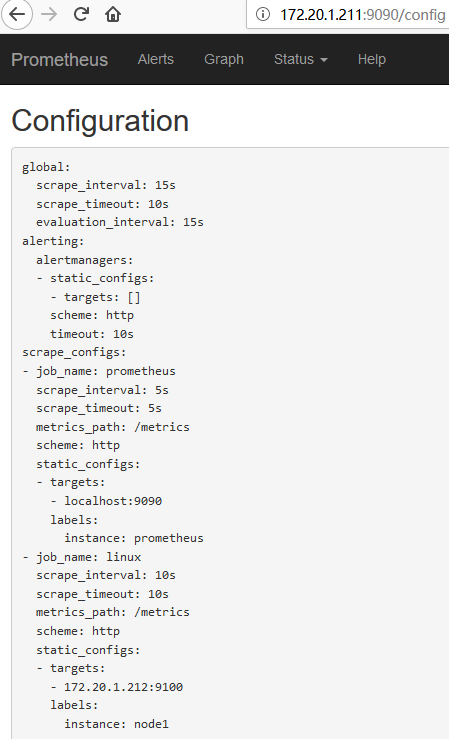
Statu-->Configuration展示prometheus.yml的配置,如下:
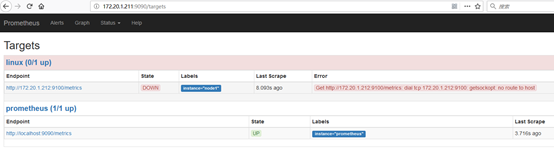
Statu-->Targets展示监控具体的监控目标,这里监控目标"linux"暂未设置node_exporter,未scrape数据,如下:
7. 绘图
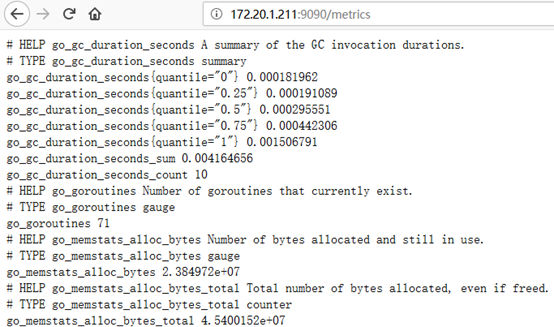
访问:http://172.20.1.211:9090/metrics,查看从exporter具体能抓到的数据,如下:
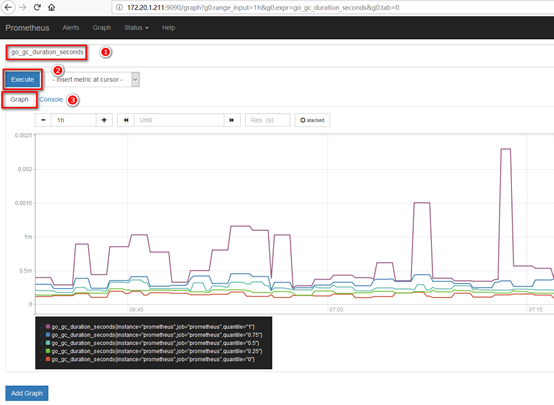
访问:http://172.20.1.211:9090,在输入框中任意输入1个exporter能抓取得值,点击"Execute"与"Execute"按钮,即可见相应抓取数据的图形,同时可对时间与unit做调整,如下:
三.部署node_exporter
Node_exporter收集机器的系统数据,这里采用prometheus官方提供的exporter,除node_exporter外,官方还提供consul,memcached,haproxy,mysqld等exporter,具体可查看官网。
这里在prometheus node节点部署相关服务。
1. 下载&部署
# 下载

[root@node1 ~]# cd /usr/local/src/

[root@node1 src]# wget https://github.com/prometheus/node_exporter/releases/download/v0.15.1/node_exporter-0.15.1.linux-amd64.tar.gz

# 部署

[root@node1 src]# tar -zxvf node_exporter-0.15.1.linux-amd64.tar.gz -C /usr/local/

[root@node1 src]# cd /usr/local/

[root@node1 local]# mv node_exporter-0.15.1.linux-amd64/ node_exporter/
2. 设置用户
[root@node1 ~]# groupadd prometheus

[root@node1 ~]# useradd -g prometheus -s /sbin/nologin prometheus

[root@node1 ~]# chown -R prometheus:prometheus /usr/local/node_exporter/
3. 设置开机启动
[root@node1 ~]# vim /usr/lib/systemd/system/node_exporter.service

[Unit]

Description=node_exporter

Documentation=https://prometheus.io/

After=network.target

[Service]

Type=simple

User=prometheus

ExecStart=/usr/local/node_exporter/node_exporter

Restart=on-failure

[Install]

WantedBy=multi-user.target

[root@node1 ~]# systemctl enable node_exporter

[root@node1 ~]# systemctl start node_exporter
4. 设置iptables
# 官方node_exporter默认使用9100端口

[root@node1 ~]# vim /etc/sysconfig/iptables

-A INPUT -p tcp -m state --state NEW -m tcp --dport 9100 -j ACCEPT

[root@node1 ~]# service iptables restart
5. 验证
访问:http://172.20.1.211:9090,可见node1主机已经可被监控,如下:

四.部署grafana
在prometheus& grafana server节点部署grafana服务。
1. 下载&安装
# 下载

[root@prometheus ~]# cd /usr/local/src/

[root@prometheus src]# wget https://s3-us-west-2.amazonaws.com/grafana-releases/release/grafana-4.6.2-1.x86_64.rpm

# 安装

[root@prometheus src]# yum localinstall grafana-4.6.2-1.x86_64.rpm
2. 配置文件
配置文件位于/etc/grafana/grafana.ini,这里暂时保持默认配置即可。
3. 设置开机启动
[root@prometheus src]# systemctl enable grafana-server

[root@prometheus src]# systemctl start grafana-server
4. 设置iptables
# grafana-server默认使用3000端口

[root@prometheus src]# vim /etc/sysconfig/iptables

-A INPUT -p tcp -m state --state NEW -m tcp --dport 3000 -j ACCEPT

[root@prometheus src]# service iptables restart
5. 添加数据源
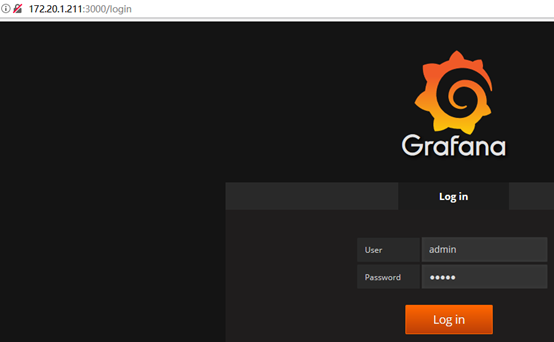
1)登陆
访问:http://172.20.1.211:3000,默认账号/密码:admin/admin
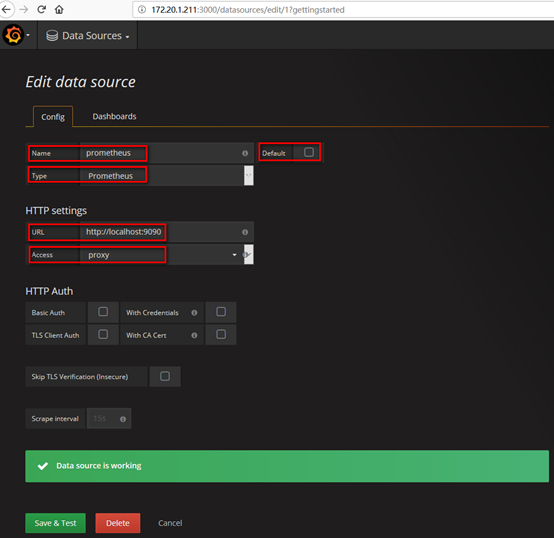
2)添加数据源
在登陆首页,点击"Add data source"按钮,跳转到添加数据源页面,配置如下:
Name: prometheus
Type: prometheus
URL: http://localhost:9090/
Access: proxy
取消Default的勾选,其余默认,点击"Add",如下:
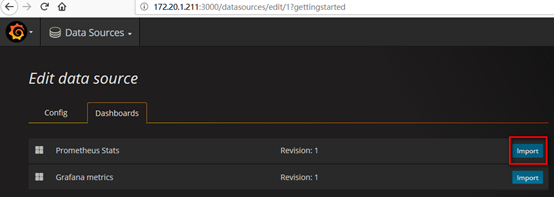
在"Dashboards"页签下"import"自带的模版,如下:
6. 导入dashboard
从grafana官网下载相关dashboaed到本地,如:https://grafana.com/dashboards/405
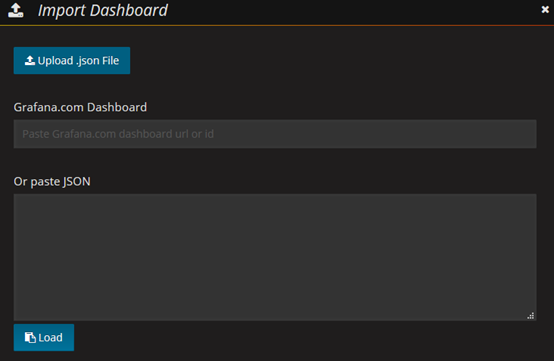
Grafana首页-->左上角图标-->Dashboard-->import
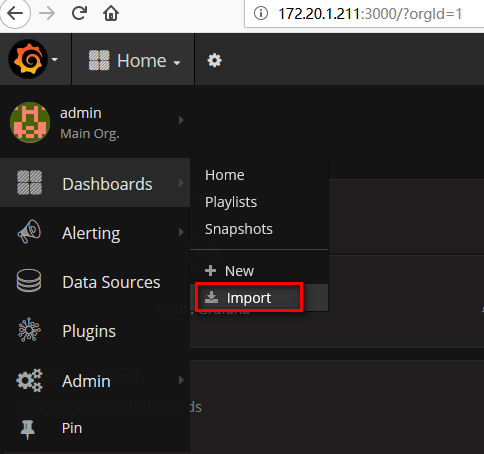
Upload已下载至本地的json文件(或者使用dashboard id,如这里的405),如下:
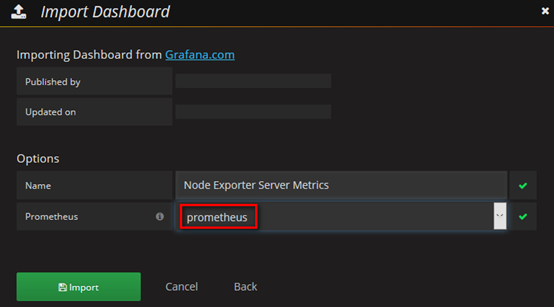
数据源选择"prometheus",即添加的数据源name,点击"Import"按钮,如下:
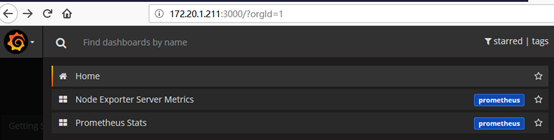
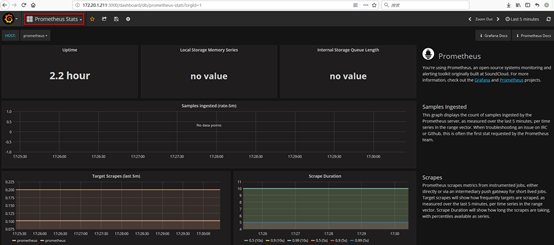
7. 查看dashboard
Grafana首页-->左上角图标-->Dashboard-->Home,Home下拉列表中可见有已添加的两个dashboard,"Prometheus Stats"与"Node Exporter Server Metrics",选择1个即可,如下:

Prometheus+Grafana监控部署实践的更多相关文章
- 使用Prometheus+Grafana监控MySQL实践
一.介绍Prometheus Prometheus(普罗米修斯)是一套开源的监控&报警&时间序列数据库的组合,起始是由SoundCloud公司开发的.随着发展,越来越多公司和组织接受采 ...
- Prometheus Grafana监控全方位实践
这次就不用 docker 部署服务了,这样大家会更容易接受.欢迎阅读. 引言 Prometheus 是一个监控系统,也是一个时间序列数据库,用Go语言开发的,官方文档.通过从某些特定的目标如主机,My ...
- 部署Prometheus+Grafana监控
Prometheus 1.不是很友好,各种配置都手写 2.对docker和k8s监控有成熟解决方案 Prometheus(普罗米修斯) 是一个最初在SoudCloud上构建的监控系统,开源项目,拥有非 ...
- [转帖]Prometheus+Grafana监控Kubernetes
原博客的位置: https://blog.csdn.net/shenhonglei1234/article/details/80503353 感谢原作者 这里记录一下自己试验过程中遇到的问题: . 自 ...
- Prometheus + Grafana 监控系统搭
本文主要介绍基于Prometheus + Grafana 监控Linux服务器. 一.Prometheus 概述(略) 与其他监控系统对比 1 Prometheus vs. Zabbix Zabbix ...
- Prometheus+Grafana监控Kubernetes
涉及文件下载地址:链接:https://pan.baidu.com/s/18XHK7ex_J0rzTtfW-QA2eA 密码:0qn6 文件中需要下载的镜像需要自己提前下载好,eg:prom/node ...
- cAdvisor+Prometheus+Grafana监控docker
cAdvisor+Prometheus+Grafana监控docker 一.cAdvisor(需要监控的主机都要安装) 官方地址:https://github.com/google/cadvisor ...
- prometheus+grafana监控redis
prometheus+grafana监控redis redis安装配置 https://www.cnblogs.com/autohome7390/p/6433956.html redis_export ...
- prometheus+grafana监控mysql
prometheus+grafana监控mysql 1.安装配置MySQL官方的 Yum Repository(有mysql只需设置监控账号即可) [root@localhost ~]# wget - ...
随机推荐
- Oracle 的PL/SQL语言使用
--PL/SQL语言(procedure language 过程化语言) --1.声明类型 declare k number; m ; --Character String buffer too sm ...
- Linux基础入门 第一章:Linux环境搭建——Redhat 6.4图文安装教程
1.创建新的虚拟机 2.选择自定义 3.选择Workstation 10.0 4.选择稍后安装操作系统 5.选择Red Hat 6 64位 6.对虚拟机命名和选择安装位置 7.选择处理器配置 8.选择 ...
- PHP设置Redis key在当天有效|SCP对拷如何连接指定端口(非22端口)的远程主机
$redis->set($key,$value); $expireTime = mktime(23, 59, 59, date("m"), date("d" ...
- js 里常用的数组操作方法
var ar=[112,44,55,66,77,88,99,'00',77]; var ar1=['ddd','fff','ggg']; //concat() 拼接一个或多个数组: //console ...
- MySQL慢日志查询实践
慢日志查询作用 慢日志查询的主要功能就是,记录sql语句中超过设定的时间阈值的查询语句.例如,一条查询sql语句,我们设置的阈值为1s,当这条查询语句的执行时间超过了1s,则将被写入到慢查询配置的日志 ...
- 音频算法之小黄人变声 附完整C代码
前面提及到<大话音频变声原理 附简单示例代码>与<声音变调算法PitchShift(模拟汤姆猫) 附完整C++算法实现代码> 都稍微讲过变声的原理和具体实现. 大家都知道,算法 ...
- Gblocks命令行
使用默认的设置: $ Gblocks proteins.fasta -t=p 必须是 fasta 文件在前,参数在后.若没有参数,则进入交互式界面. Gblocks cds.fasta −t=c −b ...
- PMP十五至尊图(第六版)
PMP(Project Management Professinoal)项目经理专业资格认证,由美国项目管理学会PMI(Project Management Institute)发起并组织的一种资格认 ...
- EntityFramework6.1自动生成复数名称数据表的问题
遇到一个很奇怪的问题,两个程序部署在两个不同的机器上,一个是.net 4.6.1另外一个是.net 4.0的运行时,两个项目都引用了EntityFramework6.1.3.程序分别执行后,4.0环境 ...
- sublime_text3常用配置
安装(pojie)不再赘述. 一.设置字体与编码 preferences->Settings->Settings-User,在大括号中输入如下内容: “font_size”:16.0, “ ...