
Python prometheus_client使用方式
#!/usr/bin/env python

# -*- coding: utf8 -*-

import socket,re

from prometheus_client import generate_latest, Gauge,Info

from prometheus_client.core import CollectorRegistry

from psutil import virtual_memory

from psutil import cpu_times

def check_port(ip, port):

    '''socket检测端口连通性'''

    s = socket.socket(socket.AF_INET, socket.SOCK_STREAM)

    s.settimeout(2)

    try:

        s.connect((ip, int(port)))

        s.shutdown(2)

        return True

    except:

        return False

REGISTRY = CollectorRegistry(auto_describe=False)

allportdata = [{'ip':'xxx.xxx.xxx.xxx','port':22},{'ip':'yyy.yyy.yyy.yyy','port':22},{'ip':'zzz.zzz.zzz.zzz','port':22}]

mem_percent = Gauge(

    "system_memory_percent",

    "Total system memory percent.",

    registry=REGISTRY)

cpu_per = Gauge(

    "system_cpu_percent",

    "Total system cpu percent.",

    registry=REGISTRY)

mem_percent.set(virtual_memory().percent)

cpu_per.set(cpu_times().system)

METRIC_NAME_RE = re.compile(r'^[a-zA-Z_:][a-zA-Z0-9_:]*$')

name = 'ip_port_conn_status'

documentation = "IP PORT SOCKET CONNECT STATUS."

portcheck = Gauge(name=name, documentation=documentation, labelnames=('ip', 'port'), registry=REGISTRY)

for i in allportdata:

    status = check_port(i['ip'], i['port'])

    portcheck.labels(i['ip'], i['port']).inc(status)

result = generate_latest(REGISTRY).decode()

print(result)
Python prometheus-client 安装
pip install prometheus-client
Python封装
# encoding: utf-8

from prometheus_client import Counter, Gauge, Summary

from prometheus_client.core import CollectorRegistry

from prometheus_client.exposition import choose_encoder

class Monitor:

    def __init__(self):

    # 注册收集器&最大耗时map

    self.collector_registry = CollectorRegistry(auto_describe=False)

    self.request_time_max_map = {}

    # 接口调用summary统计

    self.http_request_summary = Summary(name="http_server_requests_seconds",

                                   documentation="Num of request time summary",

                                   labelnames=("method", "code", "uri"),

                                   registry=self.collector_registry)

    # 接口最大耗时统计

    self.http_request_max_cost = Gauge(name="http_server_requests_seconds_max",

                                  documentation="Number of request max cost",

                                  labelnames=("method", "code", "uri"),

                                  registry=self.collector_registry)

    # 请求失败次数统计

    self.http_request_fail_count = Counter(name="http_server_requests_error",

                                      documentation="Times of request fail in total",

                                      labelnames=("method", "code", "uri"),

                                      registry=self.collector_registry)

    # 模型预测耗时统计

    self.http_request_predict_cost = Counter(name="http_server_requests_seconds_predict",

                                        documentation="Seconds of prediction cost in total",

                                        labelnames=("method", "code", "uri"),

                                        registry=self.collector_registry)

    # 图片下载耗时统计

    self.http_request_download_cost = Counter(name="http_server_requests_seconds_download",

                                         documentation="Seconds of download cost in total",

                                         labelnames=("method", "code", "uri"),

                                         registry=self.collector_registry)

    # 获取/metrics结果

    def get_prometheus_metrics_info(self, handler):

        encoder, content_type = choose_encoder(handler.request.headers.get('accept'))

        handler.set_header("Content-Type", content_type)

        handler.write(encoder(self.collector_registry))

        self.reset_request_time_max_map()

    # summary统计

    def set_prometheus_request_summary(self, handler):

        self.http_request_summary.labels(handler.request.method, handler.get_status(), handler.request.path).observe(handler.request.request_time())

        self.set_prometheus_request_max_cost(handler)

    # 自定义summary统计

    def set_prometheus_request_summary_customize(self, method, status, path, cost_time):

        self.http_request_summary.labels(method, status, path).observe(cost_time)

        self.set_prometheus_request_max_cost_customize(method, status, path, cost_time)

    # 失败统计

    def set_prometheus_request_fail_count(self, handler, amount=1.0):

        self.http_request_fail_count.labels(handler.request.method, handler.get_status(), handler.request.path).inc(amount)

    # 自定义失败统计

    def set_prometheus_request_fail_count_customize(self, method, status, path, amount=1.0):

        self.http_request_fail_count.labels(method, status, path).inc(amount)

    # 最大耗时统计

    def set_prometheus_request_max_cost(self, handler):

        requset_cost = handler.request.request_time()

        if self.check_request_time_max_map(handler.request.path, requset_cost):

            self.http_request_max_cost.labels(handler.request.method, handler.get_status(), handler.request.path).set(requset_cost)

            self.request_time_max_map[handler.request.path] = requset_cost

    # 自定义最大耗时统计

    def set_prometheus_request_max_cost_customize(self, method, status, path, cost_time):

        if self.check_request_time_max_map(path, cost_time):

            self.http_request_max_cost.labels(method, status, path).set(cost_time)

            self.request_time_max_map[path] = cost_time

    # 预测耗时统计

    def set_prometheus_request_predict_cost(self, handler, amount=1.0):

        self.http_request_predict_cost.labels(handler.request.method, handler.get_status(), handler.request.path).inc(amount)

    # 自定义预测耗时统计

    def set_prometheus_request_predict_cost_customize(self, method, status, path, cost_time):

        self.http_request_predict_cost.labels(method, status, path).inc(cost_time)

    # 下载耗时统计

    def set_prometheus_request_download_cost(self, handler, amount=1.0):

        self.http_request_download_cost.labels(handler.request.method, handler.get_status(), handler.request.path).inc(amount)

    # 自定义下载耗时统计

    def set_prometheus_request_download_cost_customize(self, method, status, path, cost_time):

        self.http_request_download_cost.labels(method, status, path).inc(cost_time)

    # 校验是否赋值最大耗时map

    def check_request_time_max_map(self, uri, cost):

        if uri not in self.request_time_max_map:

            return True

        if self.request_time_max_map[uri] < cost:

            return True

        return False

    # 重置最大耗时map

    def reset_request_time_max_map(self):

        for key in self.request_time_max_map:

            self.request_time_max_map[key] = 0.0
调用
import tornado

import tornado.ioloop

import tornado.web

import tornado.gen

from datetime import datetime

from tools.monitor import Monitor

global g_monitor

class ClassifierHandler(tornado.web.RequestHandler):

    def post(self):

        # TODO Something you need

        # work....

        # 统计Summary,包括请求次数和每次耗时

        g_monitor.set_prometheus_request_summary(self)

        self.write("OK")

class PingHandler(tornado.web.RequestHandler):

    def head(self):

        print('INFO', datetime.now(), "/ping Head.")

        g_monitor.set_prometheus_request_summary(self)

        self.write("OK")

    def get(self):

        print('INFO', datetime.now(), "/ping Get.")

        g_monitor.set_prometheus_request_summary(self)

        self.write("OK")

class MetricsHandler(tornado.web.RequestHandler):

    def get(self):

        print('INFO', datetime.now(), "/metrics Get.")

		g_monitor.set_prometheus_request_summary(self)

		# 通过Metrics接口返回统计结果

    	g_monitor.get_prometheus_metrics_info(self)

def make_app():

    return tornado.web.Application([

        (r"/ping?", PingHandler),

        (r"/metrics?", MetricsHandler),

        (r"/work?", ClassifierHandler)

    ])

if __name__ == "__main__":

    g_monitor = Monitor()

	app = make_app()

    app.listen(port)

    tornado.ioloop.IOLoop.current().start()
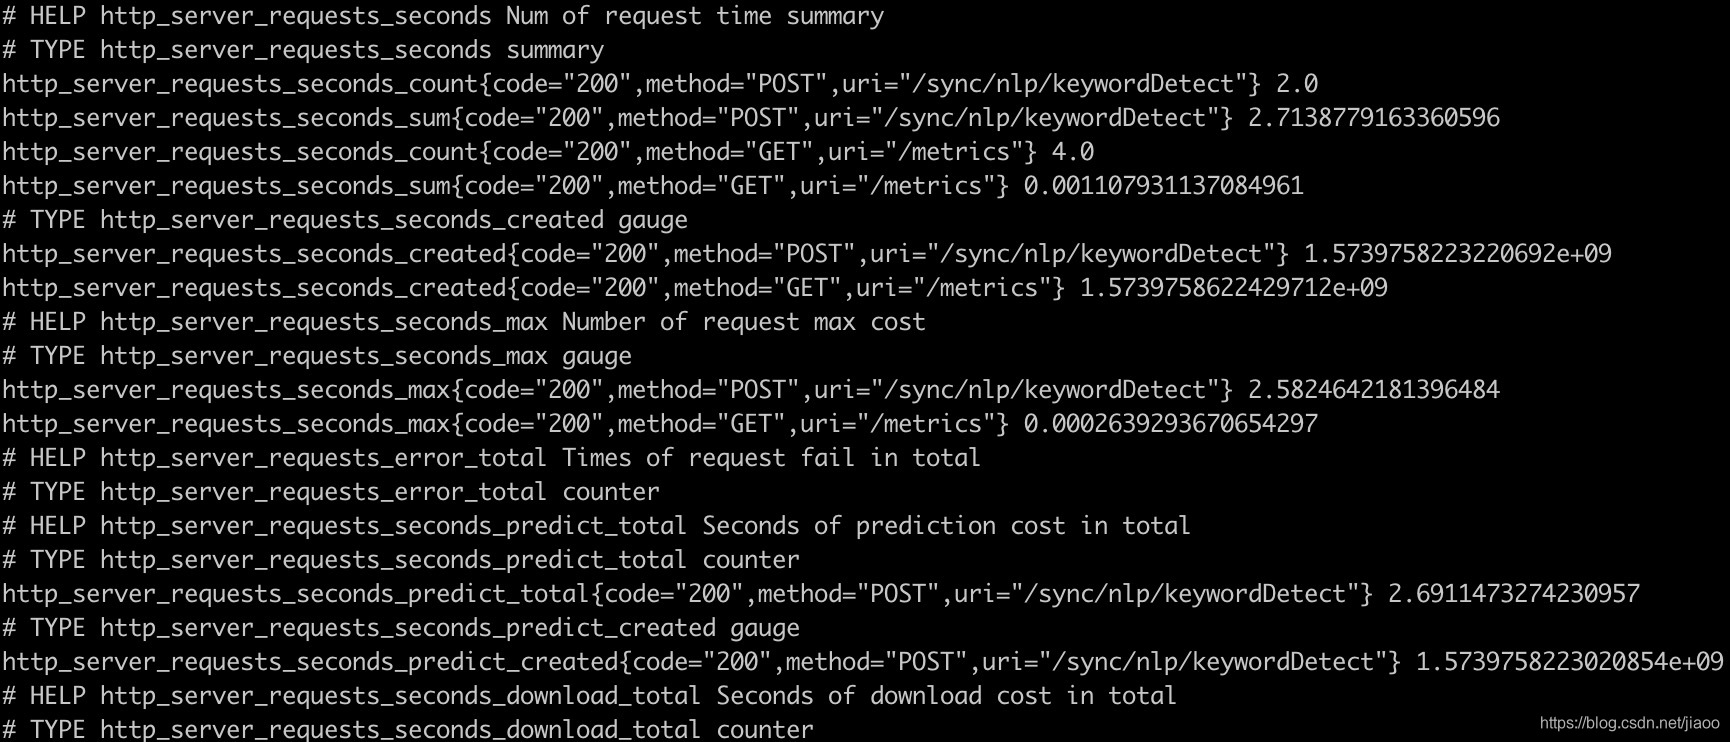
Metrics返回结果实例
Python prometheus_client使用方式的更多相关文章
- [修]python普通继承方式和super继承方式
[转]python普通继承方式和super继承方式 原文出自:http://www.360doc.com/content/13/0306/15/9934052_269664772.shtml 原文的错 ...
- 【转】python 退出程序的方式
[转]python 退出程序的方式 python程序退出方式[sys.exit() os._exit() os.kill() os.popen(...)] 知乎说明 http://www.zhihu. ...
- 理解 Python 的执行方式,与字节码 bytecode 玩耍 (上)
这里有个博客讲 Python 内部机制,已经有一些中文翻译. 可能因为我用的Python 3.5,例子跑起来有些不一样. 此外,我又查了其他一些参考资料,总结如下: Python 的执行方式 先看一个 ...
- 理解 Python 的执行方式,与字节码 bytecode 玩耍 (下)
上次写到,Python 的执行方式是把代码编译成bytecode(字节码)指令,然后由虚拟机来执行这些 bytecode 而 bytecode 长成这个样子: b'|\x00\x00d\x01\x0 ...
- [Spark][python]以DataFrame方式打开Json文件的例子
[Spark][python]以DataFrame方式打开Json文件的例子: [training@localhost ~]$ cat people.json{"name":&qu ...
- python 退出程序的方式
python程序退出方式[sys.exit() os._exit() os.kill() os.popen(...)] 知乎说明 http://www.zhihu.com/question/21187 ...
- Python模块调用方式详解
Python模块调用方式详解 作者:尹正杰 版权声明:原创作品,谢绝转载!否则将追究法律责任. 模块,用一砣代码实现了某个功能的代码集合. 类似于函数式编程和面向过程编程,函数式编程则完成一个功能,其 ...
- python通过get方式,post方式发送http请求和接收http响应-urllib urllib2
python通过get方式,post方式发送http请求和接收http响应-- import urllib模块,urllib2模块, httplib模块 http://blog.163.com/xyc ...
- 大华摄像头报警接口中图片加密,python调用c++方式实现解密
项目中,大华摄像头的报警信息,里面有图片地址,需要1天内取下来,保持留痕 可惜,图片下载后,加密了,大华提供了android,ios,c++例子,没有提供java解密例子 没办法,只好先用c++例子简 ...
- [原]Python Web部署方式总结
不要让服务器裸奔 学过PHP的都了解,php的正式环境部署非常简单,改几个文件就OK,用FastCgi方式也是分分钟的事情.相比起来,Python在web应用上的部署就繁杂的多,主要是工具繁多,主流服 ...
随机推荐
- mysql 死锁原因及解决办法
Mysql 锁类型 一.锁类型介绍: MySQL 有三种锁的级别:页级.表级.行级. 表级锁:开销小,加锁快:不会出现死锁:锁定粒度大,发生锁冲突的概率最高,并发度最低. 行级锁:开销大,加锁慢:会出 ...
- SQL全表扫描优化基础知识
1.模糊查询效率很低: 原因:like本身效率就比较低,应该尽量避免查询条件使用like:对于like '%...%'(全模糊)这样的条件,是无法使用索引的,全表扫描自然效率很低:另外,由于匹配算法的 ...
- Nuxt Kit 的使用指南:模块创建与管理
title: Nuxt Kit 的使用指南:模块创建与管理 date: 2024/9/11 updated: 2024/9/11 author: cmdragon excerpt: 摘要:本文是关于N ...
- SQL Server – Transaction & Isolation 事务与隔离
前言 上回在谈到 Concurrency 并发控制 时, 有提到过事务的概念. 这篇就补上它具体的实现. 以前写过相关的文章: sql server 学习笔记 (nested transaction ...
- ubuntu莫名的 系统出现文件系统只读
运维记录 日期:2024年9月15日 问题描述: 在安装多个 LNMP 服务后,系统重启出现了问题.当尝试运行 apt update 命令时,系统出现了如下错误信息: 忽略:1 http://secu ...
- 一组.NET MAUI绘制的开源控件 - AlohaKit
前言 今天大姚给大家分享一组.NET MAUI绘制的开源.免费(MIT License)UI控件库:AlohaKit. MAUI介绍 .NET MAUI是一个开源.免费(MIT License)的跨平 ...
- 一个.NET开源、快速、低延迟的异步套接字服务器和客户端库
前言 最近有不少小伙伴在问:.NET有什么值得推荐的网络通信框架?今天大姚给大家分享一个.NET开源.免费(MIT License).快速.低延迟的异步套接字服务器和客户端库:NetCoreServe ...
- CodeMaid:一款基于.NET开发的Visual Studio代码简化和整理实用插件
前言 今天大姚给大家分享一款由.NET开源.免费.强大的Visual Studio代码简化.整理.格式化实用插件:CodeMaid. 工具介绍 CodeMaid是一款由.NET开源.免费.强大的Vis ...
- ftrace options 中的irq-info
/sys/kernel/debug/tracing/options/irq_info 是 ftrace 中的一个选项,用于启用或禁用有关中断的详细信息的跟踪. options/irq_info 的具体 ...
- /proc/pids/status
/proc/279/status是一个Linux内核中的文件,其中包含了当前进程的状态信息.每行的含义如下: Name: 进程的名称,例如"java"或"bash&quo ...