Poisson Distribution——泊松分布
老师留个小作业,用EXCEL做不同lambda(np)的泊松分布图,这里分别用EXCEL,Python,MATLAB和R简单画一下。
1. EXCEL
运用EXCEL统计学公式,POISSON,算出各个数据,作图。资料参考这里。
=POISSON.DIST(B$1,$A2,0)
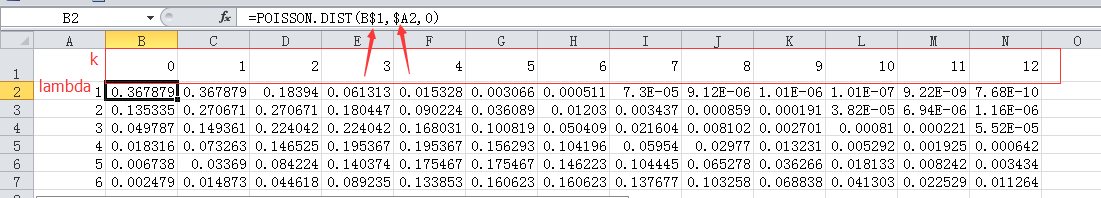
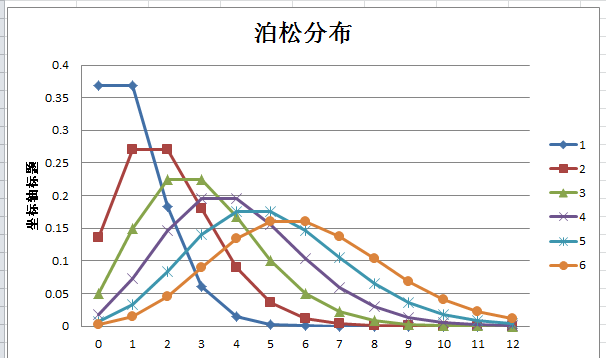
注意这里绝对引用的方式,写完公式之后,直接上下左右拖动鼠标即可自动填充。之后插入图表。如下。
2.Python
这里stats.poisson.pmf中的pmf是probability mass function(概率质量函数)的缩写。
以下引自WIKI:
在概率论中,概率质量函数(probability mass function,简写为pmf)是离散随机变量在各特定取值上的概率。
概率质量函数和概率密度函数不同之处在于:概率质量函数是对离散随机变量定义的,本身代表该值的概率;
概率密度函数是对连续随机变量定义的,本身不是概率,只有对连续随机变量的概率密度函数在某区间内进行积分后才是概率。
import scipy.stats as stats
import matplotlib.pyplot as plt k = range(0,13)
for ld in range(7):
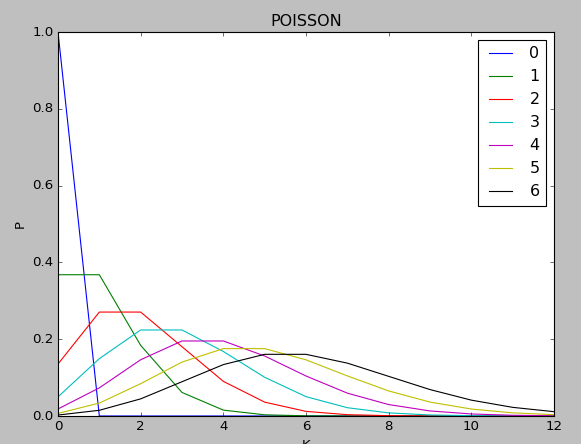
y = stats.poisson.pmf(k,ld)
plt.xlabel('K')
plt.ylabel('P')
plt.title('POISSON')
plt.plot(y,label=str(ld)) plt.legend()
plt.show()
输出图形:
3.MATLAB
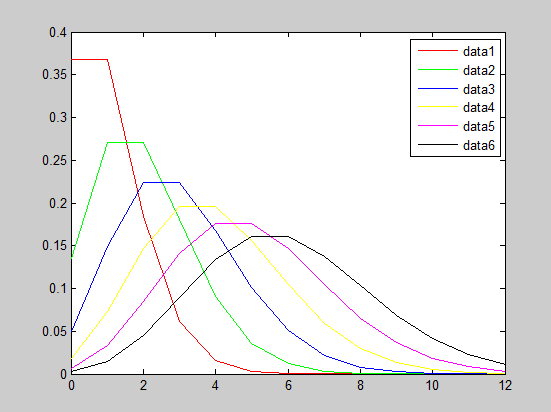
x=0:12;

c = ['r','g','b','y','m','k'];

for i = (1:6)

    y=poisspdf(x,i);

    plot(x,y,c(i));

    hold on

end
输出如下:
4.R
pmf <- function(lambda){

  y = list()

  for(k in 0:12){

      y[k+1] <- round(dpois(x=k,lambda),3)

  }

  return(y)

}

mycols <- runif(10,min=1,max=length(colors()))

for(i in 1:6){

  par(new=TRUE)

  y = plot(c(0:12),pmf(i),type='l',ylim=c(0,0.4),col = mycols[i])

  }
输出:
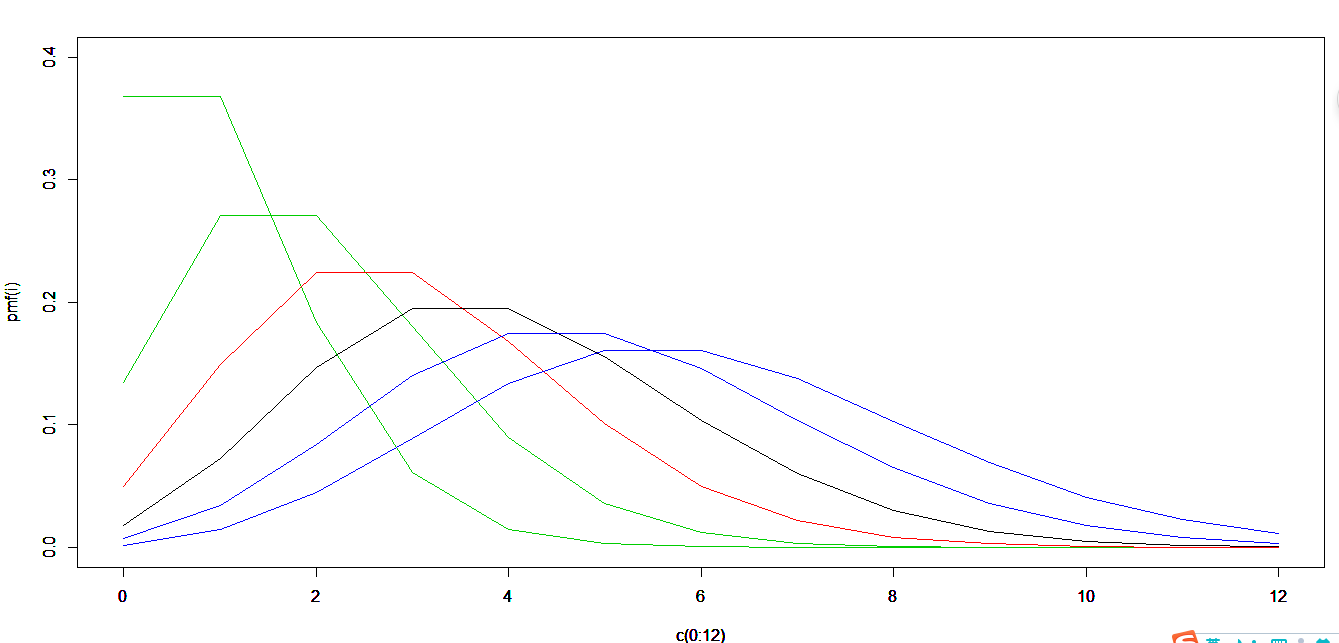
美中不足的是,楼主不知道如何为每条线设置标签。查了一下午legend函数,还是没搞定。。。
解决了回头补充吧。。。
###################################################
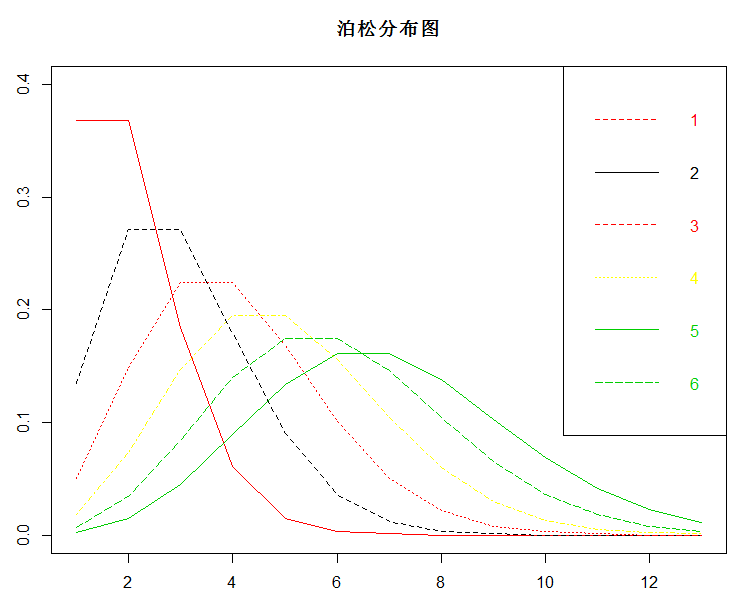
来补充了。。。问了问大佬们,给出下面的方法
pmf <- function(lambda){

  y = list()

  for(k in 0:12){

    y[k+1] <- round(dpois(x=k,lambda),3)

  }

  y = unlist(y)

  return(y)

}

mycols <- runif(10,min=1,max=length(colors()))

y_data <- matrix(unlist(lapply(1:6,FUN = pmf)),ncol = 6)

matplot(y_data,type='l',ylim=c(0,0.4),col = mycols)

colnames(y_data) = 1:ncol(y_data)

matplot(y_data,type='l',sub = "标记",ylim=c(0,0.4),col = mycols,main = "泊松分布图")

legend(

  "topright"

  ,legend = colnames(y_data)

  ,text.col = mycols

  ,col = mycols

  ,lty = mycols

)
输出:
Poisson Distribution——泊松分布的更多相关文章
- Poisson distribution 泊松分布 指数分布
Poisson distribution - Wikipedia https://en.wikipedia.org/wiki/Poisson_distribution Jupyter Notebook ...
- 【概率论】5-4:泊松分布(The Poisson Distribution)
title: [概率论]5-4:泊松分布(The Poisson Distribution) categories: - Mathematic - Probability keywords: - Po ...
- [转]Poisson Distribution
Poisson Distribution Given a Poisson process, the probability of obtaining exactly successes in tria ...
- 基本概率分布Basic Concept of Probability Distributions 2: Poisson Distribution
PDF version PMF A discrete random variable $X$ is said to have a Poisson distribution with parameter ...
- NLP&数据挖掘基础知识
Basis(基础): SSE(Sum of Squared Error, 平方误差和) SAE(Sum of Absolute Error, 绝对误差和) SRE(Sum of Relative Er ...
- 常用的机器学习&数据挖掘知识点【转】
转自: [基础]常用的机器学习&数据挖掘知识点 Basis(基础): MSE(Mean Square Error 均方误差),LMS(LeastMean Square 最小均方),LSM(Le ...
- 【基础】常用的机器学习&数据挖掘知识点
Basis(基础): MSE(Mean Square Error 均方误差),LMS(LeastMean Square 最小均方),LSM(Least Square Methods 最小二乘法),ML ...
- R代码展示各种统计学分布 | 生物信息学举例
二项分布 | Binomial distribution 泊松分布 | Poisson Distribution 正态分布 | Normal Distribution | Gaussian distr ...
- 常用的机器学习&数据挖掘知识(点)总结
Basis(基础): MSE(Mean Square Error 均方误差), LMS(LeastMean Square 最小均方), LSM(Least Square Methods 最小二乘法), ...
随机推荐
- 【转】Struts1.x系列教程(4):标签库概述与安装
转载地址:http://www.blogjava.net/nokiaguy/archive/2009/01/archive/2009/01/archive/2009/01/archive/2009/0 ...
- Uva 11090 在环中
题目链接:http://vjudge.net/contest/143318#problem/A 题意: 求平均权值最小的回路. 分析: 平均权值不可能超过最大边,二分查,然后,由于是平均权值,就可以转 ...
- 【iOS】The differences between Class Extension and Header File 类扩展与头文件的区别
. As the name suggests, they extend the class. A class continuation is another name. The class exten ...
- NavBarControl
https://documentation.devexpress.com/#WindowsForms/clsDevExpressXtraNavBarNavBarControltopic Views h ...
- jsp表格数据导出到Execl
1.关于“下载” 需要设置页面header的一个属性为:Content-Disposition: attachment; filename=下载的文件.txt 如: <a href=" ...
- JavaScript 获取当前时间戳
转自博客(http://blog.sina.com.cn/s/blog_8772845101019kg5.html) JavaScript 获取当前时间戳:第一种方法: var timestamp = ...
- Knockout 新版应用开发教程之创建view models与监控属性
最近抽出点时间研究MVVM,包括司徒正美的avalon,google的angular,以及Knockout,博客园Tom的Knockout指南 时隔2年了,ko更新了不少,所以文档也相应的变化了,所以 ...
- XMPP学习记录之实战篇
在学习iOS以来一直想要研究即时聊天方面的技术,因工作原因此计划一直搁浅,近日偷得时闲开始着手与XMPP的学习.在学习之前我一直认为XMPP对我来说是一个很有难度的挑战,在了解了协议的具体形式后,才发 ...
- mysql简介
1.什么是数据库 ? 数据库(Database)是按照数据结构来组织.存储和管理数据的仓库,它产生于距今六十多年前,随着信息技术和市场的发展,特别是二十世纪九十年代以后,数据管理不再仅仅是存储和管理数 ...
- Eclipse SVN 安装步骤
1.在eclipse中安装svn插件 Eclipse ---> Help ---> Install New Software ---> Add Name : 任意 Location ...