Echarts 柱状图配置详解
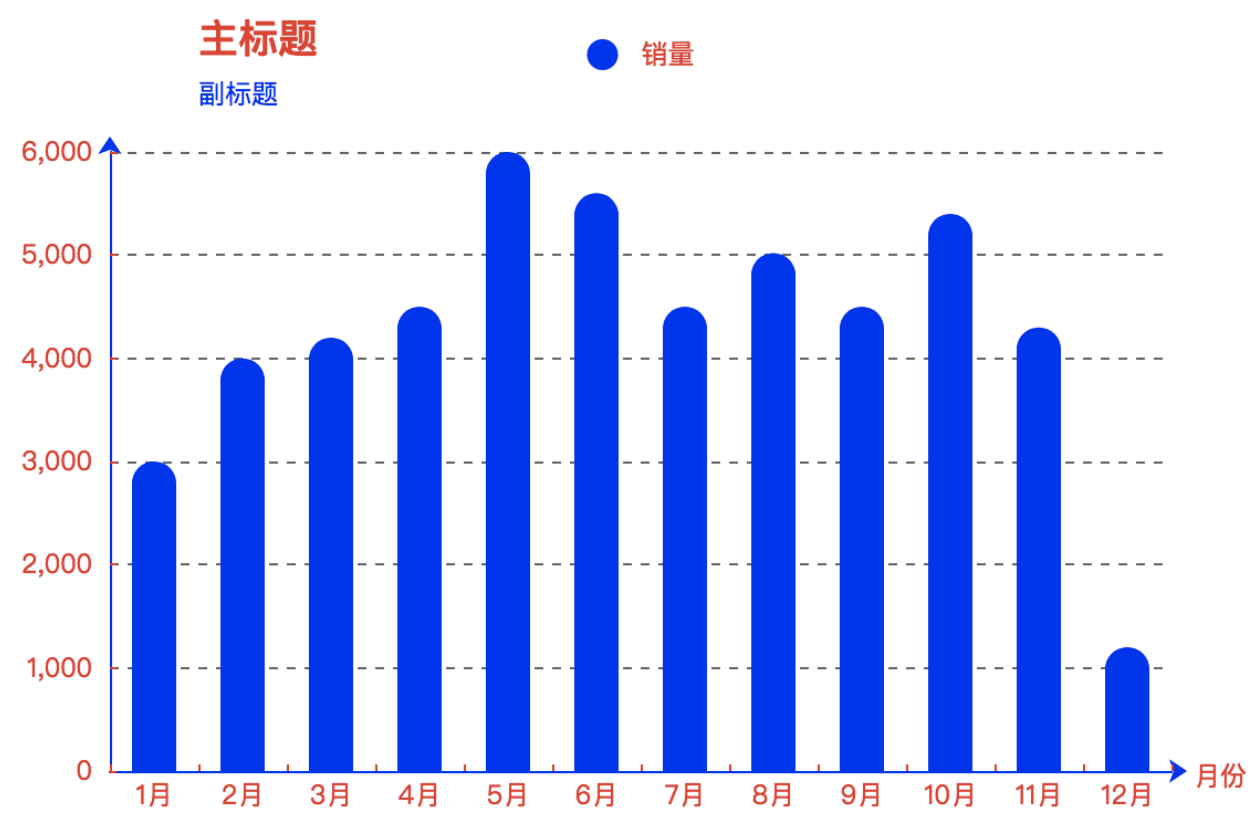
1、基本柱状图
// 指定图表的配置项和数据

var option = {

  // ----  标题 -----

  title: {

    text: '主标题',

    textStyle: {

      color: 'red'

    },

    subtext: '副标题',

    subtextStyle: {

      color: 'blue'

    },

    padding: [0, 0, 10, 100]  // 位置

  },

  // ---- legend ----

  legend: {

    type: 'plain',  // 图列类型,默认为 'plain'

    top: '1%',  // 图列相对容器的位置 top\bottom\left\right

    selected: {

      // '销量': true  // 图列选择,图形加载出来会显示选择的图列,默认为true

    },

    textStyle: {  // 图列内容样式

      color: '#fff',  // 字体颜色

      backgroundColor: 'black'  // 字体背景色

    },

    tooltip: {  // 图列提示框,默认不显示

      show: true,

      color: 'red'

    },

    data: [   // 图列内容

      {

        name: '销量',

        icon: 'circle',

        textStyle: {

          color: 'red',  // 单独设置某一个图列的颜色

          backgroundColor: '#fff' // 单独设置某一个图列的字体背景色

        }

      }

    ]

  },

  // ---  提示框 ----

  tooltip: {

    show: true,   // 是否显示提示框,默认为true

    trigger: 'item', // 数据项图形触发

    axisPointer: {   // 指示样式

      type: 'shadow',

      axis: 'auto'

    },

    padding: 5,

    textStyle: {   // 提示框内容的样式

      color: '#fff'

    }

  },

  // ---- gird区域 ---

  gird: {

    show: false,    // 是否显示直角坐标系网格

    top: 80,  // 相对位置 top\bottom\left\right

    containLabel: false, // gird 区域是否包含坐标轴的刻度标签

    tooltip: {

      show: true,

      trigger: 'item',   // 触发类型

      textStyle: {

        color: '#666'

      }

    }

  },

  //  ------  X轴 ------

  xAxis: {

    show: true,  // 是否显示

    position: 'bottom',  // x轴的位置

    offset: 0, // x轴相对于默认位置的偏移

    type: 'category',   // 轴类型, 默认为 'category'

    name: '月份',    // 轴名称

    nameLocation: 'end',  // 轴名称相对位置

    nameTextStyle: {   // 坐标轴名称样式

      color: 'red',

      padding: [5, 0, 0, -5]

    },

    nameGap: 15, // 坐标轴名称与轴线之间的距离

    nameRotate: 0,  // 坐标轴名字旋转

    axisLine: {       // 坐标轴 轴线

      show: true,  // 是否显示

      symbol: ['none', 'arrow'],  // 是否显示轴线箭头

      symbolSize: [8, 8], // 箭头大小

      symbolOffset: [0, 7],  // 箭头位置

      // ------   线 ---------

      lineStyle: {

        color: 'blue',

        width: 1,

        type: 'solid'

      }

    },

    axisTick: {    // 坐标轴 刻度

      show: true,  // 是否显示

      inside: true,  // 是否朝内

      length: 3,     // 长度

      lineStyle: {   // 默认取轴线的样式

        color: 'red',

        width: 1,

        type: 'solid'

      }

    },

    axisLabel: {    // 坐标轴标签

      show: true,  // 是否显示

      inside: false, // 是否朝内

      rotate: 0, // 旋转角度

      margin: 5, // 刻度标签与轴线之间的距离

      color: 'red'  // 默认取轴线的颜色

    },

    splitLine: {    // gird区域中的分割线

      show: false,  // 是否显示

      lineStyle: {

        // color: 'red',

        // width: 1,

        // type: 'solid'

      }

    },

    splitArea: {    // 网格区域

      show: false  // 是否显示,默认为false

    },

    data: ['1月', '2月', '3月', '4月', '5月', '6月', '7月', '8月', '9月', '10月', '11月', '12月']

  },

  //   ------   y轴  ----------

  yAxis: {

    show: true,  // 是否显示

    position: 'left', // y轴位置

    offset: 0, // y轴相对于默认位置的偏移

    type: 'value',  // 轴类型,默认为 ‘category’

    name: '销量',   // 轴名称

    nameLocation: 'end', // 轴名称相对位置value

    nameTextStyle: {    // 坐标轴名称样式

      color: '#fff',

      padding: [5, 0, 0, 5]  // 坐标轴名称相对位置

    },

    nameGap: 15, // 坐标轴名称与轴线之间的距离

    nameRotate: 270,  // 坐标轴名字旋转

    axisLine: {    // 坐标轴 轴线

      show: true,  // 是否显示

      //  -----   箭头 -----

      symbol: ['none', 'arrow'],  // 是否显示轴线箭头

      symbolSize: [8, 8],  // 箭头大小

      symbolOffset: [0, 7], // 箭头位置

      // ----- 线 -------

      lineStyle: {

        color: 'blue',

        width: 1,

        type: 'solid'

      }

    },

    axisTick: {      // 坐标轴的刻度

      show: true,    // 是否显示

      inside: true,  // 是否朝内

      length: 3,      // 长度

      lineStyle: {

        color: 'red',  // 默认取轴线的颜色

        width: 1,

        type: 'solid'

      }

    },

    axisLabel: {      // 坐标轴的标签

      show: true,    // 是否显示

      inside: false,  // 是否朝内

      rotate: 0,     // 旋转角度

      margin: 8,     // 刻度标签与轴线之间的距离

      color: 'red',  // 默认轴线的颜色

    },

    splitLine: {    // gird 区域中的分割线

      show: true,   // 是否显示

      lineStyle: {

        color: '#666',

        width: 1,

        type: 'dashed'

      }

    },

    splitArea: {     // 网格区域

      show: false   // 是否显示,默认为false

    }

  },

  //  -------   内容数据 -------

  series: [

    {

      name: '销量',      // 序列名称

      type: 'bar',      // 类型

      legendHoverLink: true,  // 是否启用图列 hover 时的联动高亮

      label: {   // 图形上的文本标签

        show: false,

        position: 'insideTop', // 相对位置

        rotate: 0,  // 旋转角度

        color: '#eee'

      },

      itemStyle: {    // 图形的形状

        color: 'blue',

        barBorderRadius: [18, 18, 0 ,0]

      },

      barWidth: 20,  // 柱形的宽度

      barCategoryGap: '20%',  // 柱形的间距

      data: [3000, 4000, 4200, 4500, 6000, 5600, 4500, 5020, 4500, 5400, 4300, 1200]

    }

  ]

};
html代码
<!DOCTYPE html>

<html>

<head>

    <meta charset="utf-8">

    <title>ECharts</title>

    <!-- 引入 echarts.js -->

    <script src="./echarts4.x.js"></script>

    <script type="text/javascript" src="./zhuzhangtu.js"></script>

</head>

<body>

    <!-- 为ECharts准备一个具备大小(宽高)的Dom -->

    <div id="main" style="width: 600px;height:400px;margin: 0 auto"></div>

    <script type="text/javascript">

        // 基于准备好的dom,初始化echarts实例

        var myChart = echarts.init(document.getElementById('main'));

        // 使用刚指定的配置项和数据显示图表。

        myChart.setOption(option);

    </script>

</body>

</html>
2、折叠柱状图

// 指定图表的配置项和数据

option = {

  title: {

    text: "",

    textStyle: {

      color: "#436EEE",

      fontSize: 17

    }

  },

  tooltip: {

    trigger: 'axis',

    axisPointer: {

      type: 'shadow'

    }

  },

  legend: {

    data:[

      {

        name: '政策法规',

        icon: 'circle',

        textStyle: {

          color: 'red',  // 单独设置某一个图列的颜色

          backgroundColor: '#fff' // 单独设置某一个图列的字体背景色

        }

      },

      {

        name: '经办规程',

        icon: 'circle',

        textStyle: {

          color: 'red',  // 单独设置某一个图列的颜色

          backgroundColor: '#fff' // 单独设置某一个图列的字体背景色

        }

      },

      {

        name: '业务场景模拟',

        icon: 'circle',

        textStyle: {

          color: 'red',  // 单独设置某一个图列的颜色

          backgroundColor: '#fff' // 单独设置某一个图列的字体背景色

        }

      },

      {

        name: '常见问题',

        icon: 'circle',

        textStyle: {

          color: 'red',  // 单独设置某一个图列的颜色

          backgroundColor: '#fff' // 单独设置某一个图列的字体背景色

        }

      }

    ]

  },

  //x轴显示

  xAxis: {

    data: [20180611, 20180612, 20180613, 20180614, 20180615, 20180616, 20180617],

    show: true,  // 是否显示

    position: 'bottom',  // x轴的位置

    offset: 0, // x轴相对于默认位置的偏移

    type: 'category',   // 轴类型, 默认为 'category'

    name: '月份',    // 轴名称

    nameLocation: 'end',  // 轴名称相对位置

    nameTextStyle: {   // 坐标轴名称样式

      color: 'red',

      padding: [5, 0, 0, -5]

    },

    nameGap: 15, // 坐标轴名称与轴线之间的距离

    nameRotate: 0,  // 坐标轴名字旋转

    axisLine: {       // 坐标轴 轴线

      show: true,  // 是否显示

      symbol: ['none', 'arrow'],  // 是否显示轴线箭头

      symbolSize: [8, 8], // 箭头大小

      symbolOffset: [0, 7],  // 箭头位置

      // ------   线 ---------

      lineStyle: {

        color: 'blue',

        width: 1,

        type: 'solid'

      }

    },

    axisTick: {    // 坐标轴 刻度

      show: true,  // 是否显示

      inside: true,  // 是否朝内

      length: 3,     // 长度

      lineStyle: {   // 默认取轴线的样式

        color: 'red',

        width: 1,

        type: 'solid'

      }

    },

    axisLabel: {    // 坐标轴标签

      show: true,  // 是否显示

      inside: false, // 是否朝内

      rotate: 0, // 旋转角度

      margin: 5, // 刻度标签与轴线之间的距离

      color: 'red'  // 默认取轴线的颜色

    },

    splitLine: {    // gird区域中的分割线

      show: false,  // 是否显示

      lineStyle: {

        // color: 'red',

        // width: 1,

        // type: 'solid'

      }

    },

    splitArea: {    // 网格区域

      show: false  // 是否显示,默认为false

    },

    // show: false

  },

  //   ------   y轴  ----------

  yAxis: {

    show: true,  // 是否显示

    position: 'left', // y轴位置

    offset: 0, // y轴相对于默认位置的偏移

    type: 'value',  // 轴类型,默认为 ‘category’

    name: '销量',   // 轴名称

    nameLocation: 'end', // 轴名称相对位置value

    nameTextStyle: {    // 坐标轴名称样式

      color: '#fff',

      padding: [5, 0, 0, 5]  // 坐标轴名称相对位置

    },

    nameGap: 15, // 坐标轴名称与轴线之间的距离

    nameRotate: 270,  // 坐标轴名字旋转

    axisLine: {    // 坐标轴 轴线

      show: true,  // 是否显示

      //  -----   箭头 -----

      symbol: ['none', 'arrow'],  // 是否显示轴线箭头

      symbolSize: [8, 8],  // 箭头大小

      symbolOffset: [0, 7], // 箭头位置

      // ----- 线 -------

      lineStyle: {

        color: 'blue',

        width: 1,

        type: 'solid'

      }

    },

    axisTick: {      // 坐标轴的刻度

      show: true,    // 是否显示

      inside: true,  // 是否朝内

      length: 3,      // 长度

      lineStyle: {

        color: 'red',  // 默认取轴线的颜色

        width: 1,

        type: 'solid'

      }

    },

    axisLabel: {      // 坐标轴的标签

      show: true,    // 是否显示

      inside: false,  // 是否朝内

      rotate: 0,     // 旋转角度

      margin: 8,     // 刻度标签与轴线之间的距离

      color: 'red',  // 默认轴线的颜色

    },

    splitLine: {    // gird 区域中的分割线

      show: true,   // 是否显示

      lineStyle: {

        color: '#666',

        width: 1,

        type: 'dashed'

      }

    },

    splitArea: {     // 网格区域

      show: false   // 是否显示,默认为false

    }

  },

  tooltip: {

    position: ['50%', '50%'],

    padding: [5, 10]

  },

  grid: {

    left: '0%'

  },

  series: [

    {

      name: "政策法规",

      type: "bar",

      stack: "业务",//折叠显示

      data: ["87.54", "88.54", "90", "91", "92", '95', '100'],

      barWidth : 25,

      //显示颜色

      itemStyle:{

        normal:{color:"blue"}

      },

      label: {   // 图形上的文本标签

        show: false,

        position: 'insideTop', // 相对位置

        rotate: 0,  // 旋转角度

        color: '#eee'

      }

    },

   {

     name: "经办规程",

     type: "bar",

     stack: "业务",

     data: ["87.54", "88.54", "90", "91", "92", '95', '100'],

     barWidth : 25,

     label: {   // 图形上的文本标签

        show: false,

        position: 'insideTop', // 相对位置

        rotate: 0,  // 旋转角度

        color: '#eee'

      },

     itemStyle:{

       normal:{color:"#FF8849"}

     }

   },

   {

     name: "业务场景模拟",

     type: "bar",

     stack: "业务",

     data: ["87.54", "88.54", "90", "91", "92", '95', '100'],

     barWidth : 25,

     label: {   // 图形上的文本标签

        show: false,

        position: 'insideTop', // 相对位置

        rotate: 0,  // 旋转角度

        color: '#eee'

      },

     itemStyle:{

       normal:{color:"#3FBB49"}

     }

   },

   {

     name: "常见问题",

     type: "bar",

     stack: "业务",

     data: ["87.54", "88.54", "90", "91", "92", '95', '100'],

     barWidth : 25,

     label: {   // 图形上的文本标签

        show: false,

        position: 'insideTop', // 相对位置

        rotate: 0,  // 旋转角度

        color: '#eee'

      },

     itemStyle:{

       normal:{color:"#56C4A5"}

     },

     barCateGoryGap: 15

   }

  ]

};
html调用代码
<!DOCTYPE html>

<html>

<head>

    <meta charset="utf-8">

    <title>ECharts</title>

    <!-- 引入 echarts.js -->

    <script src="./echarts4.x.js"></script>

    <script type="text/javascript" src="./histogram.js"></script>

</head>

<body>

    <!-- 为ECharts准备一个具备大小(宽高)的Dom -->

    <div id="main" style="width: 600px;height:400px;margin: 0 auto"></div>

    <script type="text/javascript">

        // 基于准备好的dom,初始化echarts实例

        var myChart = echarts.init(document.getElementById('main'));

        // 使用刚指定的配置项和数据显示图表。

        myChart.setOption(option);

        myChart.on('click', function (params) {

            // 控制台打印数据的名称

            console.log(params);

        });

    </script>

</body>

</html>
转发自
https://www.cnblogs.com/tugenhua0707/p/9380378.html
Echarts 柱状图配置详解的更多相关文章
- Echarts 柱状图属性详解
<script type="text/javascript"> // 基于准备好的dom,初始化echarts实例 var myChart = echarts.init ...
- Echars折线配置详解
Echars折线配置详解 比如做成如下效果图: 所有的配置如下: var option = { tooltip: { // 提示框 trigger: 'axis', // 触发类型(坐标轴触发) al ...
- Log4j配置详解(转)
一.Log4j简介 Log4j有三个主要的组件:Loggers(记录器),Appenders (输出源)和Layouts(布局).这里可简单理解为日志类别,日志要输出的地方和日志以何种形式输出.综合使 ...
- logback 常用配置详解<appender>
logback 常用配置详解 <appender> <appender>: <appender>是<configuration>的子节点,是负责写日志的 ...
- [转]阿里巴巴数据库连接池 druid配置详解
一.背景 java程序很大一部分要操作数据库,为了提高性能操作数据库的时候,又不得不使用数据库连接池.数据库连接池有很多选择,c3p.dhcp.proxool等,druid作为一名后起之秀,凭借其出色 ...
- libCURL开源库在VS2010环境下编译安装,配置详解
libCURL开源库在VS2010环境下编译安装,配置详解 转自:http://my.oschina.net/u/1420791/blog/198247 http://blog.csdn.net/su ...
- logback配置详解3<filter>
logback 常用配置详解(三) <filter> <filter>: 过滤器,执行一个过滤器会有返回个枚举值,即DENY,NEUTRAL,ACCEPT其中之一.返回DENY ...
- logback配置详解2<appender>
logback 常用配置详解(二) <appender> <appender>: <appender>是<configuration>的子节点,是负责写 ...
- log4j.properties配置详解
1.Loggers Loggers组件在此系统中被分为五个级别:DEBUG.INFO.WARN.ERROR和FATAL.这五个级别是有顺序的,DEBUG < INFO < WARN < ...
随机推荐
- laravel整合workerman做消息推送系统
官方建议分离 workerman和mvc框架的结合,我去,这不是有点脑缺氧吗? 大量的业务逻辑,去独立增加方法和类库在写一次,实际业务中是不现实和不实际的 gateway增加一些这方面的工作,但是我看 ...
- JAR包结构,META-INF/MANIFEST.MF文件详细说明[全部属性][打包][JDK]
转载请注:[https://www.cnblogs.com/applerosa/p/9736729.html] 常见的属性 jar文件的用途 压缩的和未压缩的 jar工具 可执行的JAR 1.创建可执 ...
- [strongswan][autoconf][automake][cento] 在CentOS上编译strongswan git源码时遇到的autoconf问题
编译strongswan的git源码问题 1. 概述 首先,我们想要通过源码编译strongswan.当满足以下条件时,通常你会遇见此问题: 源码时通过git clone的得来的,而不是官网下载的源码 ...
- Java学习-051-Detected both log4j-over-slf4j.jar AND bound slf4j-log4j12.jar on the class path, preempting StackOverflowError
错误信息:Detected both log4j-over-slf4j.jar AND bound slf4j-log4j12.jar on the class path, preempting St ...
- Java集合List、Set、Map
集合是 java 基础中非常重要的一部分,同样也是 Java 面试中很重要的一个知识点.所以,给王小整理了这篇关于集合的文章. 1.接口继承关系以及实现 集合类存放于 Java.util 包中,主要有 ...
- mysql-8.0.13在windows上的部署
1 .下载mysql-8.0.13-x64 官方网站:https://dev.mysql.com/downloads/mysql/ 2.解压到G盘 3.准备my.ini文件保存到解压目录 [mysql ...
- [py]pandas数据统计学习
pandas.core.base.DataError: No numeric types to aggregate错误规避 我没有去解决这个问题, 而用填充0规避了这个问题 统计 聚合 d = [ { ...
- head和tail命令
1.head head 文件名 :查看前10行 head -n 5 文件名 :查看文件的前5行 head -c 5 文件名 :查看文件的前5个字符 head -n -5 文件名 :查看文件的后5行 ...
- Java开发规范总结
Service / DAO 层方法命名规约: 1 ) 获取单个对象的方法用 get 做前缀.2 ) 获取多个对象的方法用 list 做前缀.3 ) 获取统计值的方法用 count 做前缀.4 ) 插 ...
- 【Idea】Intellij Idea debug 模式如果发现异常,即添加异常断点在发生异常处
前用eclipse的时候,可以根据所抛出的异常进行调试,比如:出现了空指针异常,我想知道是哪一行抛出的,在eclipse中我只需在debug模式下把空指针异常这个名字设置进去,当遇到空指针异常时,ec ...