kubernetes-平台日志收集(ELK)
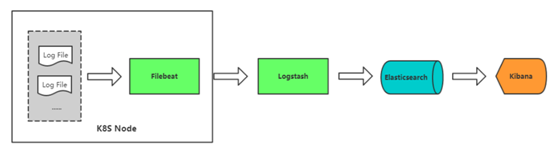
使用ELK Stack收集Kubernetes平台中日志与可视化
- K8S系统的组件日志
- K8S Cluster里面部署的应用程序日志
日志系统:
ELK安装
安装jdk

[root@localhost ~]# yum install java-1.8.-openjdk

[root@localhost ~]# java -version

openjdk version "1.8.0_212"

OpenJDK Runtime Environment (build 1.8.0_212-b04)

OpenJDK -Bit Server VM (build 25.212-b04, mixed mode)

安装elk组件

[root@localhost ~]# yum install elasticsearch logstash kibana

启动es

[root@localhost ~]# systemctl start elasticsearch

启动kibana

[root@localhost ~]# vim /etc/kibana/kibana.yml

server.host: "0.0.0.0"

elasticsearch.hosts: ["http://localhost:9200"]

[root@localhost ~]# systemctl start kibana

启动logstash

[root@localhost ~]# cat /etc/logstash/conf.d/logstash-to-es.conf

input {
  beats {
    port => 5044
  }
}

filter {
}

output {
    if [app] == "www" {
    if [type] == "nginx-access" {
         elasticsearch {
        hosts => ["http://127.0.0.1:9200"]
        index => "nginx-access-%{+YYYY.MM.dd}"
             }
    }
    else if [type] == "nginx-error" {
        elasticsearch {
                hosts => ["http://127.0.0.1:9200"]
                index => "nginx-error-%{+YYYY.MM.dd}"
             }
    }
        else if [type] == "tomcat-catalina" {
            elasticsearch {
                hosts => ["http://127.0.0.1:9200"]
                index => "tomcat-catalina-%{+YYYY.MM.dd}"
             }
        }
    }
        else if [app] == "k8s" {
        if [type] == "module" {
        elasticsearch {
            hosts => ["http://127.0.0.1:9200"]
            index => "k8s-log-%{+YYYY.MM.dd}"
        }
        }
        }
    stdout { codec => rubydebug }
}

[root@localhost ~]# /usr/share/logstash/bin/logstash -f /etc/logstash/conf.d/logstash-to-es.conf
启动收集日志的容器(filebeat)
[root@localhost elk]# cat k8s-logs.yaml

apiVersion: v1

kind: ConfigMap

metadata:

  name: k8s-logs-filebeat-config

  namespace: kube-system

data:

  filebeat.yml: |-

    filebeat.prospectors:

      - type: log

        paths:

          - /messages

        fields:

          app: k8s

          type: module

        fields_under_root: true

    output.logstash:

      hosts: ['192.168.0.225:5044']

---

apiVersion: apps/v1

kind: DaemonSet

metadata:

  name: k8s-logs

  namespace: kube-system

spec:

  selector:

    matchLabels:

      project: k8s

      app: filebeat

  template:

    metadata:

      labels:

        project: k8s

        app: filebeat

    spec:

      containers:

      - name: filebeat

        image: docker.elastic.co/beats/filebeat:6.4.

        args: [

          "-c", "/etc/filebeat.yml",

          "-e",

        ]

        resources:

          requests:

            cpu: 100m

            memory: 100Mi

          limits:

            cpu: 500m

            memory: 500Mi

        securityContext:

          runAsUser:

        volumeMounts:

        - name: filebeat-config

          mountPath: /etc/filebeat.yml

          subPath: filebeat.yml

        - name: k8s-logs

          mountPath: /messages

      volumes:

      - name: k8s-logs

        hostPath:

          path: /var/log/messages

          type: File

      - name: filebeat-config

        configMap:

          name: k8s-logs-filebeat-config

[root@localhost elk]# kubectl apply -f k8s-logs.yaml

configmap/k8s-logs-filebeat-config created

[root@localhost elk]# kubectl get pod -n kube-system

NAME                                    READY   STATUS    RESTARTS   AGE

alertmanager-6b5bbd5bd4-lgjn8           /     Running             7d4h

coredns-5b8c57999b-z9jh8                /     Running             28d

grafana-                               /     Running             10d

k8s-logs-b6f4v                          /     Running             6m30s

k8s-logs-lz5pn                          /     Running             6m30s

k8s-logs-pj8kj                          /     Running             6m30s

kube-state-metrics-f86fd9f4f-j4rdc      /     Running             7d7h

kubernetes-dashboard-644c96f9c6-bvw8w   /     Running             28d

prometheus-                            /     Running             7d3h
访问kibana,添加index

容器中的日志怎么收集

|
方式 |
优点 |
缺点 |
|
方案一:Node上部署一个日志收集程序 |
每个Node仅需部署一个日志收集程序,资源消耗少,对应用无侵入 |
应用程序日志需要写到标准输出和标准错误输出,不支持多行日志 |
|
方案二:Pod中附加专用日志收集的容器 |
低耦合 |
每个Pod启动一个日志收集代理,增加资源消耗,并增加运维维护成本 |
|
方案三:应用程序直接推送日志 |
无需额外收集工具 |
浸入应用,增加应用复杂度 |
方案二示例:Pod中附加专用日志收集的容器
nginx日志收集
[root@localhost elk]# cat filebeat-nginx-configmap.yaml

apiVersion: v1

kind: ConfigMap

metadata:

  name: filebeat-nginx-config

  namespace: test

data:

  filebeat.yml: |-

    filebeat.prospectors:

      - type: log

        paths:

          - /usr/local/nginx/logs/access.log

        # tags: ["access"]

        fields:

          app: www

          type: nginx-access

        fields_under_root: true

      - type: log

        paths:

          - /usr/local/nginx/logs/error.log

        # tags: ["error"]

        fields:

          app: www

          type: nginx-error

        fields_under_root: true

    output.logstash:

      hosts: ['192.168.0.225:5044']

[root@localhost elk]# kubectl apply -f filebeat-nginx-configmap.yaml

configmap/filebeat-nginx-config unchanged

[root@localhost elk]# cat nginx-deployment.yaml

apiVersion: apps/v1beta1

kind: Deployment

metadata:

  name: php-demo

  namespace: test

spec:

  replicas:

  selector:

    matchLabels:

      project: www

      app: php-demo

  template:

    metadata:

      labels:

        project: www

        app: php-demo

    spec:

      imagePullSecrets:

      - name: registry-pull-secret

      containers:

      - name: nginx

        image: 192.168.0.223/project/nginx:v1

        imagePullPolicy: Always

        ports:

        - containerPort:

          name: web

          protocol: TCP

        resources:

          requests:

            cpu: 0.5

            memory: 256Mi

          limits:

            cpu:

            memory: 1Gi

        resources:

          requests:

            cpu: 0.5

            memory: 256Mi

          limits:

            cpu:

            memory: 1Gi

        livenessProbe:

          httpGet:

            path: /status.php

            port:

          initialDelaySeconds:

          timeoutSeconds:

        volumeMounts:

        - name: nginx-logs

          mountPath: /usr/local/nginx/logs

      - name: filebeat

        image: docker.elastic.co/beats/filebeat:6.4.

        args: [

          "-c", "/etc/filebeat.yml",

          "-e",

        ]

        resources:

          limits:

            memory: 500Mi

          requests:

            cpu: 100m

            memory: 100Mi

        securityContext:

          runAsUser:

        volumeMounts:

        - name: filebeat-config

          mountPath: /etc/filebeat.yml

          subPath: filebeat.yml

        - name: nginx-logs

          mountPath: /usr/local/nginx/logs

      volumes:

      - name: nginx-logs

        emptyDir: {}

      - name: filebeat-config

        configMap:

          name: filebeat-nginx-config

[root@localhost elk]# kubectl apply -f nginx-deployment.yaml

deployment.apps/php-demo configured

tomcat日志收集
[root@localhost elk]# cat filebeat-tomcat-configmap.yaml

apiVersion: v1

kind: ConfigMap

metadata:

  name: filebeat-config

  namespace: test

data:

  filebeat.yml: |-

    filebeat.prospectors:

    - type: log

      paths:

        - /usr/local/tomcat/logs/catalina.*

      # tags: ["tomcat"]

      fields:

        app: www

        type: tomcat-catalina

      fields_under_root: true

      multiline:

        pattern: '^\['

        negate: true

        match: after

    output.logstash:

      hosts: ['192.168.0.225:5044']

[root@localhost elk]# kubectl apply -f filebeat-tomcat-configmap.yaml

configmap/filebeat-config created

[root@localhost elk]# cat tomcat-deployment.yaml

apiVersion: apps/v1beta1

kind: Deployment

metadata:

  name: tomcat-java-demo

  namespace: test

spec:

  replicas:

  selector:

    matchLabels:

      project: www

      app: java-demo

  template:

    metadata:

      labels:

        project: www

        app: java-demo

    spec:

      imagePullSecrets:

      - name: registry-pull-secret

      containers:

      - name: tomcat

        image: 192.168.0.223/project/tomcat-java-demo:latest

        imagePullPolicy: Always

        ports:

        - containerPort:

          name: web

          protocol: TCP

        resources:

          requests:

            cpu: 0.5

            memory: 1Gi

          limits:

            cpu:

            memory: 2Gi

        livenessProbe:

          httpGet:

            path: /

            port:

          initialDelaySeconds:

          timeoutSeconds:

        readinessProbe:

          httpGet:

            path: /

            port:

          initialDelaySeconds:

          timeoutSeconds:

        volumeMounts:

        - name: tomcat-logs

          mountPath: /usr/local/tomcat/logs

      - name: filebeat

        image: docker.elastic.co/beats/filebeat:6.4.

        args: [

          "-c", "/etc/filebeat.yml",

          "-e",

        ]

        resources:

          limits:

            memory: 500Mi

          requests:

            cpu: 100m

            memory: 100Mi

        securityContext:

          runAsUser:

        volumeMounts:

        - name: filebeat-config

          mountPath: /etc/filebeat.yml

          subPath: filebeat.yml

        - name: tomcat-logs

          mountPath: /usr/local/tomcat/logs

      volumes:

      - name: tomcat-logs

        emptyDir: {}

      - name: filebeat-config

        configMap:

          name: filebeat-config

[root@localhost elk]# kubectl apply -f tomcat-deployment.yaml

deployment.apps/tomcat-java-demo created
kubernetes-平台日志收集(ELK)的更多相关文章
- Kubernetes 常用日志收集方案
Kubernetes 常用日志收集方案 学习了 Kubernetes 集群中监控系统的搭建,除了对集群的监控报警之外,还有一项运维工作是非常重要的,那就是日志的收集. 介绍 应用程序和系统日志可以帮助 ...
- 日志收集ELK+kafka相关博客
SpringBoot+kafka+ELK分布式日志收集 使用 logstash + kafka + elasticsearch 实现日志监控 Kibana 安装 与 汉化 windows系统安装运行f ...
- Kubernetes容器日志收集
日志采集方式 日志从传统方式演进到容器方式的过程就不详细讲了,可以参考一下这篇文章Docker日志收集最佳实践,由于容器的漂移.自动伸缩等特性,日志收集也就必须使用新的方式来实现,Kubernetes ...
- ELK构建MySQL慢日志收集平台详解
上篇文章<中小团队快速构建SQL自动审核系统>我们完成了SQL的自动审核与执行,不仅提高了效率还受到了同事的肯定,心里美滋滋.但关于慢查询的收集及处理也耗费了我们太多的时间和精力,如何在这 ...
- ELK分布式日志收集搭建和使用
大型系统分布式日志采集系统ELK全框架 SpringBootSecurity1.传统系统日志收集的问题2.Logstash操作工作原理3.分布式日志收集ELK原理4.Elasticsearch+Log ...
- Kubernetes实战之部署ELK Stack收集平台日志
主要内容 1 ELK概念 2 K8S需要收集哪些日志 3 ELK Stack日志方案 4 容器中的日志怎么收集 5 K8S平台中应用日志收集 准备环境 一套正常运行的k8s集群,kubeadm安装部署 ...
- ELK+Kafka 企业日志收集平台(一)
背景: 最近线上上了ELK,但是只用了一台Redis在中间作为消息队列,以减轻前端es集群的压力,Redis的集群解决方案暂时没有接触过,并且Redis作为消息队列并不是它的强项:所以最近将Redis ...
- FILEBEAT+ELK日志收集平台搭建流程
filebeat+elk日志收集平台搭建流程 1. 整体简介: 模式:单机 平台:Linux - centos - 7 ELK:elasticsearch.logstash.kiban ...
- ELK Stack 企业级日志收集平台
ELK Stack介绍 大型项目,多产品线的日志收集 ,分析平台 为什么用ELK? 1.开发人员排查问题,服务器上查看权限 2.项目多,服务器多,日志类型多 ELK 架构介绍 数据源--->lo ...
- ELK:日志收集分析平台
简介 ELK是一个日志收集分析的平台,它能收集海量的日志,并将其根据字段切割.一来方便供开发查看日志,定位问题:二来可以根据日志进行统计分析,通过其强大的呈现能力,挖掘数据的潜在价值,分析重要指标的趋 ...
随机推荐
- 组合外键(FOREIGN KEY)
一张表,它的外键即是参考另一张表的主键,但这些关联键是组合键,由2列或多列组成. 你可以先看看这篇<多列组合为主键(PRIMARY KEY)>https://www.cnblogs.com ...
- 剑指Offer的学习笔记(C#篇)-- 序列化二叉树
题目描述 请实现两个函数,分别用来序列化和反序列化二叉树 一 . 理解题意 二叉树的序列化,是将一个结构化的东西变成扁平化的字符串,序列化二叉树或者是反序列化二叉树就是二叉树和扩展二叉树遍历序列之间的 ...
- append、replace、replaceAll、indexof、lastIndexOf、substring的用法
1.append StringBuffer buf = new StringBuffer("Hard "): String aString = "Waxworks& ...
- linux查看系统版本(适用于centos、ubutun,其他类型没有进行测试)
方法一:cat /etc/issue 或more /etc/issue root@salt-master:~# cat /etc/issueUbuntu 16.04.2 LTS \n \l 方法二:l ...
- HTML——制作一个图片列表
总结: 1)html有很多默认样式,然而实际应用中并不需要,因此要在制作样式之前清除掉默认样式. 2)注意清除margin-top塌陷 3)使用float:left后要使用clear:both清除其影 ...
- ADC中的滤波算法
STM32的AD最大输入时钟不超过14MHZ,最高采样速度1us,可以采用DMA或者内部的基本定时器/高级定时器来触发,利用模拟看门狗监控所选择的的所有通道,如果超过模拟的 阀[fá] 值,将产生中断 ...
- LCD1602显示中文汉字
小子在西藏 2011-11-25编写 特别说明笔者是上面的作者,感谢那些原意分享知识的人.时隔5年我又看到了笔者当年写的东西,我想这期间还有许许多多的人 今天写在博客上,愿更多后来者可以学习. LCD ...
- ASP.Net 页面和后台执行的先后顺序
后台的Page_Load事件——>前台页面加载
- nodejs 中的异步之殇
nodejs 中的异步之殇 终于再次回到 nodejs 异步中,以前我以为异步在我写的文章中,已经写完了,现在才发现,还是有很多的地方没有想清楚,下面来一一说明. 模块同步与连接异步 大家应该,经常使 ...
- JavaScript 函数(方法)
1 定义 1.1 函数是由事件驱动的或者当它被调用时执行的可重复使用的代码块. 语法: 函数就是包裹在大括号中的代码块,前面使用了关键词 function function 方法名(参数列表){ 代码 ...