python求极值点(波峰波谷)
python求极值点主要用到scipy库。
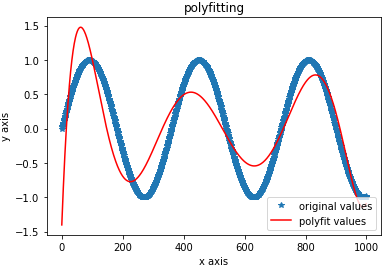
1. 首先可先选择一个函数或者拟合一个函数,这里选择拟合数据:np.polyfit
import pandas as pd

import matplotlib.pyplot as plt

import numpy as np

from scipy import signal   #滤波等

xxx = np.arange(0, 1000)

yyy = np.sin(xxx*np.pi/180)

z1 = np.polyfit(xxx, yyy, 7) # 用7次多项式拟合

p1 = np.poly1d(z1) #多项式系数

print(p1) # 在屏幕上打印拟合多项式

yvals=p1(xxx)

plt.plot(xxx, yyy, '*',label='original values')

plt.plot(xxx, yvals, 'r',label='polyfit values')

plt.xlabel('x axis')

plt.ylabel('y axis')

plt.legend(loc=4)

plt.title('polyfitting')

plt.show()
得到的图形是:
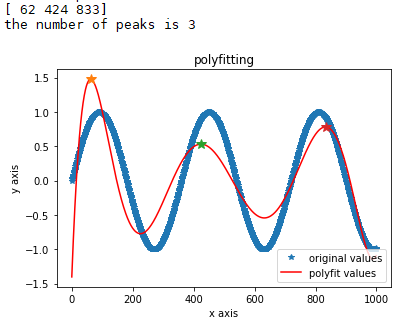
2. 求波峰值,也就是极大值,得到:signal.find_peaks,官方文档:https://docs.scipy.org/doc/scipy/reference/generated/scipy.signal.find_peaks.html#scipy-signal-find-peaks。
scipy.signal.find_peaks(x, height=None, threshold=None, distance=None, prominence=None, width=None, wlen=None, rel_height=0.5, plateau_size=None)

Parameters:

x : sequence. A signal with peaks.

height : number or ndarray or sequence, optional. Required height of peaks. Either a number, None, an array matching x or a 2-element sequence of the former. The first element is always interpreted as the minimal and the second, if supplied, as the maximal required height.

threshold : number or ndarray or sequence, optional. Required threshold of peaks, the vertical distance to its neighbouring samples. Either a number, None, an array matching x or a 2-element sequence of the former. The first element is always interpreted as the minimal and the second, if supplied, as the maximal required threshold.

distance : number, optional. Required minimal horizontal distance (>= 1) in samples between neighbouring peaks. Smaller peaks are removed first until the condition is fulfilled for all remaining peaks.

prominence : number or ndarray or sequence, optional. Required prominence of peaks. Either a number, None, an array matching x or a 2-element sequence of the former. The first element is always interpreted as the minimal and the second, if supplied, as the maximal required prominence.

width : number or ndarray or sequence, optional. Required width of peaks in samples. Either a number, None, an array matching x or a 2-element sequence of the former. The first element is always interpreted as the minimal and the second, if supplied, as the maximal required width.

wlen : int, optional. Used for calculation of the peaks prominences, thus it is only used if one of the arguments prominence or width is given. See argument wlen in peak_prominences for a full description of its effects.

rel_height : float, optional. Used for calculation of the peaks width, thus it is only used if width is given. See argument rel_height in peak_widths for a full description of its effects.

plateau_size : number or ndarray or sequence, optional. Required size of the flat top of peaks in samples. Either a number, None, an array matching x or a 2-element sequence of the former. The first element is always interpreted as the minimal and the second, if supplied as the maximal required plateau size.

New in version 1.2.0.
# 极值

num_peak_3 = signal.find_peaks(yvals, distance=10) #distance表极大值点的距离至少大于等于10个水平单位

print(num_peak_3[0])

print('the number of peaks is ' + str(len(num_peak_3[0])))

plt.plot(xxx, yyy, '*',label='original values')

plt.plot(xxx, yvals, 'r',label='polyfit values')

plt.xlabel('x axis')

plt.ylabel('y axis')

plt.legend(loc=4)

plt.title('polyfitting')

for ii in range(len(num_peak_3[0])):

    plt.plot(num_peak_3[0][ii], yvals[num_peak_3[0][ii]],'*',markersize=10)

plt.show()
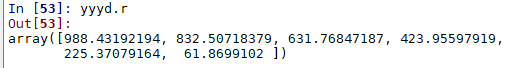
3. 在可导的情形下,可以求导来求极值点,同时得到极大值和极小值点:np.polyder
yyyd = np.polyder(p1,1) # 1表示一阶导

print(yyyd)
此时:yyyd.r 即可就得导数为0的点,可以与上述的极大值点对应比较
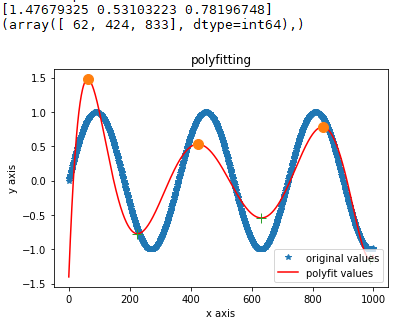
4. 直接函数分别求极大值和极小值:signal.argrelextrema 函数
print(yvals[signal.argrelextrema(yvals, np.greater)]) #极大值的y轴, yvals为要求极值的序列

print(signal.argrelextrema(yvals, np.greater))  #极大值的x轴

peak_ind = signal.argrelextrema(yvals,np.greater)[0] #极大值点,改为np.less即可得到极小值点

plt.plot(xxx, yyy, '*',label='original values')

plt.plot(xxx, yvals, 'r',label='polyfit values')

plt.xlabel('x axis')

plt.ylabel('y axis')

plt.legend(loc=4)

plt.title('polyfitting')

plt.plot(signal.argrelextrema(yvals,np.greater)[0],yvals[signal.argrelextrema(yvals, np.greater)],'o', markersize=10)  #极大值点

plt.plot(signal.argrelextrema(yvals,np.less)[0],yvals[signal.argrelextrema(yvals, np.less)],'+', markersize=10)  #极小值点

plt.show()
## ----- end ------
python求极值点(波峰波谷)的更多相关文章
- 使用python求字符串或文件的MD5
使用python求字符串或文件的MD5 五月 21st, 2008 #以下可在python3000运行. #字符串md5,用你的字符串代替'字符串'中的内容. import hashlib md5=h ...
- python求微分方程组的数值解曲线01
本人最近在写一篇关于神经网络同步的文章,其一部分模型为: x_i^{\Delta}(t)= -a_i*x_i(t)+ b_i* f(x_i(t))+ \sum\limits_{j \in\{i-1, ...
- Python 求点到直线的垂足
Python 求点到直线的垂足 在已知一个点,和一条已知两个点的直线的情况下 运算公式参考链接:https://www.cnblogs.com/mazhenyu/p/3508735.html def ...
- gc图波峰波谷一直上升问题
垃圾回收曲线,波峰和波谷一直上升.正常是波峰波谷在同一水平线上,可以想象如果程序继续运行下去,老年代内存回收后也不断上升,当达到老年代满了的时候,就会报内存溢出错误. 用jmap -histo pid ...
- python求100以内素数
python求100以内素数之和 from math import sqrt # 使用isPrime函数 def isPrime(n): if n <= 1: return False for ...
- Python 求两个文本文件以行为单位的交集 并集 差集
Python 求两个文本文件以行为单位的交集 并集 差集,来代码: s1 = set(open('a.txt','r').readlines()) s2 = set(open('b.txt','r') ...
- Faas 典型场景——应用负载有显著的波峰波谷,典型用例-基于事件的数据处理
Serverless适用的两大场景 场景一:应用负载有显著的波峰波谷 Serverless化与否的评判标准并不是公司规模的大小,而是其业务背后的具体技术问题,比如业务波峰波谷明显,如何实现削峰填谷.一 ...
- Python求一个数字列表的元素总和
Python求一个数字列表的元素总和.练手: 第一种方法,直接sum(list): 1 lst = list(range(1,11)) #创建一个1-10的数字列表 2 total = 0 #初始化总 ...
- python 求MD5值
(一)求字符串的MD5值 import hashlib #导入功能模块,此模块有MD5,SHA1,SHA256等方法 m = hashlib.md5() #声明一个对象 m.update(b'hell ...
随机推荐
- jmeter-json提取器提取的内容含”引号
这时如果直接赋值会报错 解决方法: 1.用vars.get("Object")提取变量的值 2.用代码提取,最后把提取到的Object或Array转为String
- 避免js重复加载的问题
避免js重复加载的问题 在日常开发中,一个页面加载另一个页面的时候,就会把另一个页面的js也会加载进来,那么如何才能避免被加载页面不再重复加载已经加载过的js呢? 先上代码 动态加载js // 加载j ...
- tensorflow安装问题
环境 windows7 开始的时候,打算在最新版本下安装tensorflow体验下,python是3.6 anaconda是最新的5.0.1 结果执行 pip3 install --upgrade ...
- Programming on C 学习笔记
目录 include不同的声明方式有什么不同? if defined 与 #ifdef 有什么区别? undef 是怎么工作的? 如何利用 typedef 来定义数组? 枚举中,如果有个元素被赋予值, ...
- (未完成)【Android】MVP模式初见(一)
最近在阅读郭霖大神的公众号时,分类中架构引起了我的注意. 虽然是个人开发(水平很菜的那种),但最终都要向企业正式项目开发靠近.因此接下来一段时间,主要学习一下MVP架构.Retrofit以及RxJav ...
- 解决jmeter5.1高版本linux CPU,IO,Memory监控性能测试 java.lang.NoSuchMethodError: org.apache.jmeter.samplers.SampleSaveConfiguration.setFormatter(Ljava/t
jmeter中也可以监控服务器的CPU和内存使用情况,但是需要安装一些插件还需要在被监测服务器上开启服务. 安装性能监控插件(jmeter-plugins)后报如下错误,是由于jmeter版本过高jm ...
- go语言开发工具sublime text3 + gosublime配置
开始go语言开发时,网上google了下go的开发工具,大都推荐 sublime text3+gosublime.但是实际操作中gosublime不能直接安装,需要自己手动安装.将自己的安装过程整理一 ...
- Node.js核心模块-http
通过node中的http模块可以创建编写服务器 引入 const http = require('http') http举例使用: const http = require('http') //引入 ...
- VUE项目编译和打包问题
今天VPN不好使,所以准备看一下VUE前端的代码.因为是乙方新发过来的,所以想着先把代码跑起来.结果发现发过来的代码里没有node_modules. 解决方式 npm install express ...
- plsql导出查询结果,导出csv文件。但是类似身份证等超出15位的数据后三位显示问题,和科学计数法的格式问题
问题描述: plsql导出查询结果时,如果使用导出查询结果,使用excelfile会特别慢. 所以我们一般使用csv文件,然后在excel中新建空白文档,在数据菜单中导入数据,但是导出 ...