
Logistic Regression and Newton's Method
Data
For this exercise, suppose that a high school has a dataset representing 40 students who were admitted to college and 40 students who were not admitted. Each training example contains a student's score on two standardized exams and a label of whether the student was admitted.
Your task is to build a binary classification model that estimates college admission chances based on a student's scores on two exams. In your training data,
a. The first column of your x array represents all Test 1 scores, and the second column represents all Test 2 scores.
b. The y vector uses '1' to label a student who was admitted and '0' to label a student who was not admitted.
Plot the data
Load the data for the training examples into your program and add the
intercept term into your x matrix.
Before beginning Newton's Method, we will first plot the data using different symbols to represent the two classes. In Matlab/Octave, you can separate the positive class and the negative class using the find command:
% find returns the indices of the

% rows meeting the specified condition

pos = find(y == 1); neg = find(y == 0);

% Assume the features are in the 2nd and 3rd

% columns of x

plot(x(pos, 2), x(pos,3), '+'); hold on

plot(x(neg, 2), x(neg, 3), 'o')
Your plot should look like the following:

Newton's Method
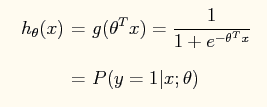
在logistic regression问题中,logistic函数表达式如下:
这样做的好处是可以把输出结果压缩到0~1之间。而在logistic回归问题中的损失函数与线性回归中的损失函数不同,这里定义的为:
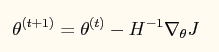
如果采用牛顿法来求解回归方程中的参数,则参数的迭代公式为:
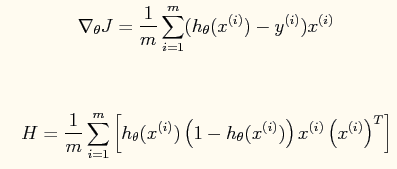
其中一阶导函数和hessian矩阵表达式如下:

code
% Exercise  -- Logistic Regression

clear all; close all; clc

x = load('ex4x.dat');

y = load('ex4y.dat');

[m, n] = size(x);

% Add intercept term to x

x = [ones(m, ), x];

% Plot the training data

% Use different markers for positives and negatives

figure

pos = find(y); neg = find(y == );%find是找到的一个向量,其结果是find函数括号值为真时的值的编号

plot(x(pos, ), x(pos,), '+')

hold on

plot(x(neg, ), x(neg, ), 'o')

hold on

xlabel('Exam 1 score')

ylabel('Exam 2 score')

% Initialize fitting parameters

theta = zeros(n+, );

% Define the sigmoid function 匿名函数

g = inline('1.0 ./ (1.0 + exp(-z))');

% Newton's method

MAX_ITR = ;

J = zeros(MAX_ITR, );

for i = :MAX_ITR

    % Calculate the hypothesis function

    z = x * theta;

    h = g(z);%转换成logistic函数

    % Calculate gradient and hessian.

    % The formulas below are equivalent to the summation formulas

    % given in the lecture videos.

    grad = (/m).*x' * (h-y);%梯度的矢量表示法

    H = (/m).*x' * diag(h) * diag(1-h) * x;%hessian矩阵的矢量表示法

    % Calculate J (for testing convergence)

    J(i) =(/m)*sum(-y.*log(h) - (-y).*log(-h));%损失函数的矢量表示法

    theta = theta - H\grad;%是这样子的吗?

end

% Display theta

theta

% Calculate the probability that a student with

% Score  on exam  and score  on exam

% will not be admitted

prob =  - g([, , ]*theta)

%画出分界面

% Plot Newton's method result

% Only need  points to define a line, so choose two endpoints

plot_x = [min(x(:,))-,  max(x(:,))+];

% Calculate the decision boundary line,plot_y的计算公式见博客下面的评论。

plot_y = (-./theta()).*(theta().*plot_x +theta());

plot(plot_x, plot_y)

legend('Admitted', 'Not admitted', 'Decision Boundary')

hold off

% Plot J

figure

plot(:MAX_ITR-, J, 'o--', 'MarkerFaceColor', 'r', 'MarkerSize', )

xlabel('Iteration'); ylabel('J')

% Display J

J
matlab
diag函数功能:矩阵对角元素的提取和创建对角阵
设以下X为方阵,v为向量
1、X = diag(v,k)当v是一个含有n个元素的向量时,返回一个n+abs(k)阶方阵X,向量v在矩阵X中的第k个对角线上,k=0表示主对角线,k>0表示在主对角线上方,k<0表示在主对角线下方。例1:
v=[1 2 3];
diag(v, 3)ans =
0 0 0 1 0 0
0 0 0 0 2 00 0 0 0 0 3
0 0 0 0 0 0
0 0 0 0 0 0
0 0 0 0 0 0
注:从主对角矩阵上方的第三个位置开始按对角线方向产生数据的
例2:
v=[1 2 3];
diag(v, -1)ans =
0 0 0 0
1 0 0 0
0 2 0 0
0 0 3 0
注:从主对角矩阵下方的第一个位置开始按对角线方向产生数据的
2、X = diag(v)
向量v在方阵X的主对角线上,类似于diag(v,k),k=0的情况。
例3:
v=[1 2 3];
diag(v)ans =
1 0 0
0 2 00 0 3
注:写成了对角矩阵的形式
3、v = diag(X,k)
返回列向量v,v由矩阵X的第k个对角线上的元素形成
例4:
v=[1 0 3;2 3 1;4 5 3];
diag(v,1)ans =
0
1注:把主对角线上方的第一个数据作为起始数据,按对角线顺序取出写成列向量形式
4、v = diag(X)返回矩阵X的主对角线上的元素,类似于diag(X,k),k=0的情况例5:
v=[1 0 0;0 3 0;0 0 3];
diag(v)ans =
1
33
或改为:
v=[1 0 3;2 3 1;4 5 3];
diag(v)ans =
1
33
注:把主对角线的数据取出写成列向量形式
5、diag(diag(X))
取出X矩阵的对角元,然后构建一个以X对角元为对角的对角矩阵。
例6:X=[1 2;3 4]
diag(diag(X))X =
1 2
3 4ans =
1 0
0 4
Logistic Regression and Newton's Method的更多相关文章
- 转载 Deep learning:四(logistic regression练习)
前言: 本节来练习下logistic regression相关内容,参考的资料为网页:http://openclassroom.stanford.edu/MainFolder/DocumentPage ...
- 斯坦福CS229机器学习课程笔记 part2:分类和逻辑回归 Classificatiion and logistic regression
Logistic Regression 逻辑回归 1.模型 逻辑回归解决的是分类问题,并且是二元分类问题(binary classification),y只有0,1两个取值.对于分类问题使用线性回归不 ...
- Regularized logistic regression
要解决的问题是,给出了具有2个特征的一堆训练数据集,从该数据的分布可以看出它们并不是非常线性可分的,因此很有必要用更高阶的特征来模拟.例如本程序中个就用到了特征值的6次方来求解. Data To be ...
- 逻辑回归模型(Logistic Regression)及Python实现
逻辑回归模型(Logistic Regression)及Python实现 http://www.cnblogs.com/sumai 1.模型 在分类问题中,比如判断邮件是否为垃圾邮件,判断肿瘤是否为阳 ...
- Logistic Regression Vs Decision Trees Vs SVM: Part I
Classification is one of the major problems that we solve while working on standard business problem ...
- Stanford机器学习---第三讲. 逻辑回归和过拟合问题的解决 logistic Regression & Regularization
原文:http://blog.csdn.net/abcjennifer/article/details/7716281 本栏目(Machine learning)包括单参数的线性回归.多参数的线性回归 ...
- logistic regression的一些问题,不平衡数据,时间序列,求解惑
Logistic Regression 1.在有时间序列的特征数据中,怎么运用LR? 不光是LR,其他的模型也是. 有很多基本的模型变形之后,变成带时序的模型.但,个人觉得,这类模型大多不靠谱. 我觉 ...
- Machine Learning - 第3周(Logistic Regression、Regularization)
Logistic regression is a method for classifying data into discrete outcomes. For example, we might u ...
- Python实践之(七)逻辑回归(Logistic Regression)
机器学习算法与Python实践之(七)逻辑回归(Logistic Regression) zouxy09@qq.com http://blog.csdn.net/zouxy09 机器学习算法与Pyth ...
随机推荐
- vue实现文字上下滚动
实现文字的上下滚动使用positon的relative的top属性,通过动态改变top来实现相关内容的更换,通过transion来实现相关的动画效果, 相关的dom内容 <template> ...
- es6 学习1 let表示变量 、const表示常量 与 var 变量的区别
一.let 1.看下代码,在函数中无论在哪里声明变量,都会自动提到函数顶部,这就是函数变量提升,它的作用于为当前函数中. function aa() { if(bool) { var test = ' ...
- 巧用MAC地址表
对于身处网络环境的人来说,不少朋友应该遇到过这种的情况:某一个终端找不到接在了哪一个交换机口上,也不知道数据包怎样走的. ok,那么这时候MAC地址表就作用了,拿下图的实验环境(H3C)来说好了 环境 ...
- Ubuntu 环境下的mysql 远程访问,redis 远程访问和设置密码 ,mongo 安装 ,设置用户密码,开启远程访问
MySQL远程访问 1.编辑mysql配置文件,把其中bind-address = 127.0.0.1注释了 vi /etc/mysql/mysql.conf.d/mysqld.cnf 2.使用roo ...
- Git学习笔记 1,GitHub常用命令1
廖雪峰Git教程 莫烦Git教程 莫烦Git视频教程 --------------- init > apt-get install git # 安装 > mkdir /home/yzn_g ...
- [TJOI2017]城市(树的直径)
[TJOI2017]城市 题目描述 从加里敦大学城市规划专业毕业的小明来到了一个地区城市规划局工作.这个地区一共有ri座城市,<-1条高速公路,保证了任意两运城市之间都可以通过高速公路相互可达, ...
- 题解 P2610 【[ZJOI2012]旅游】
今天模拟赛考了这道题,那就来水一篇题解吧...(话说提高组模拟赛考什么省选题啊??) 这道题要我们求一条线段最多能经过的三角形数量. 回想小学学过的奥数,老师告诉过我们这样一件事:`点无大小 线无粗细 ...
- 【Codeforces Round #422 (Div. 2) C】Hacker, pack your bags!(二分写法)
[题目链接]:http://codeforces.com/contest/822/problem/C [题意] 有n个旅行计划, 每个旅行计划以开始日期li,结束日期ri,以及花费金钱costi描述; ...
- 利用socket模拟http的混合表单上传(在一个请求中提交表单并上传多个文件)
在非常多企业级应用中,我们都没法直接通过开发语言sdk包封装的http工具来模拟http复合表单(multipart/form-data),特别是在跨语言跨平台的编程过程中.事实上实现方 ...
- UvaLive 6600 Spanning trees in a secure lock pattern 矩阵行列式
链接:https://icpcarchive.ecs.baylor.edu/index.php? option=com_onlinejudge&Itemid=8&page=show_p ...