Linux下使用iostat 监视I/O状态
我们可以使用 sar(1), pidstat(1), mpstat(1), vmstat(8) 来监控
一、安装
yum install sysstat
二、参数解释
FILES
/proc/stat contains system statistics.

/proc/uptime contains system uptime.

/proc/partitions contains disk statistics (for pre 2.5 kernels that have been patched).

/proc/diskstats contains disks statistics (for post 2.5 kernels).

/sys contains statistics for block devices (post 2.5 kernels).

/proc/self/mountstats contains statistics for network filesystems.

/dev/disk contains persistent device names.
CPU Utilization Report
%user    Show  the  percentage  of CPU utilization that occurred while executing at the user level (applica-tion).

%nice   Show the percentage of CPU utilization that occurred while executing at the user  level  with  nicepriority.

%system    Show  the percentage of CPU utilization that occurred while executing at the system level (kernel).

%iowait    Show the percentage of time that the CPU or CPUs were idle during which the system had an outstand-ing disk I/O request.

%steal    Show the percentage of time spent in involuntary wait by the virtual CPU or CPUs while the hypervi-sor was servicing another virtual processor.

%idle    Show the percentage of time that the CPU or CPUs were idle and the system did not have an outstand-ing disk I/O request.
Device Utilization Report
tps   Indicate  the  number  of transfers per second that were issued to the device. A transfer is an I/O

      request to the device. Multiple logical requests can be combined into a single I/O request  to  the

      device. A transfer is of indeterminate size.

Blk_read/s    Indicate the amount of data read from the device expressed in a number of blocks per second. Blocks

      are equivalent to sectors with kernels 2.4 and later and therefore have a size of 512  bytes.  With

      older kernels, a block is of indeterminate size.

Blk_wrtn/s    Indicate the amount of data written to the device expressed in a number of blocks per second.

Blk_read    The total number of blocks read.

Blk_wrtn    The total number of blocks written.

kB_read/s    Indicate the amount of data read from the device expressed in kilobytes per second.

kB_wrtn/s    Indicate the amount of data written to the device expressed in kilobytes per second.

kB_read    The total number of kilobytes read.

kB_wrtn    The total number of kilobytes written.

MB_read/s    Indicate the amount of data read from the device expressed in megabytes per second.

MB_wrtn/s    Indicate the amount of data written to the device expressed in megabytes per second.

MB_read    The total number of megabytes read.

MB_wrtn    The total number of megabytes written.

rrqm/s    The number of read requests merged per second that were queued to the device.

wrqm/s    The number of write requests merged per second that were queued to the device.

r/s    The number of read requests that were issued to the device per second.

w/s    The number of write requests that were issued to the device per second.

rsec/s    The number of sectors read from the device per second.

wsec/s    The number of sectors written to the device per second.

rkB/s    The number of kilobytes read from the device per second.

wkB/s    The number of kilobytes written to the device per second.

rMB/s    The number of megabytes read from the device per second.

wMB/s    The number of megabytes written to the device per second.

avgrq-sz    The average size (in sectors) of the requests that were issued to the device.

avgqu-sz    The average queue length of the requests that were issued to the device.

await    The  average  time  (in  milliseconds)  for  I/O  requests  issued to the device to be served. This includes the time spent by the requests in queue and the time spent servicing them.

svctm    The average service time (in milliseconds) for I/O requests that were issued to the  device.  Warning! Do not trust this field any more. This field will be removed in a future sysstat version.

%util    Percentage  of  CPU time during which I/O requests were issued to the device (bandwidth utilization for the device). Device saturation occurs when this value is close to 100%.
Network Filesystem report
rBlk_nor/s    Indicate the number of blocks read by applications via the read(2) system call interface.  A  block has a size of 512 bytes.

wBlk_nor/s    Indicate the number of blocks written by applications via the write(2) system call interface.

rBlk_dir/s    Indicate the number of blocks read from files opened with the O_DIRECT flag.

wBlk_dir/s    Indicate the number of blocks written to files opened with the O_DIRECT flag.

rBlk_svr/s    Indicate the number of blocks read from the server by the NFS client via an NFS READ request.

wBlk_svr/s    Indicate the number of blocks written to the server by the NFS client via an NFS WRITE request.

rkB_nor/s    Indicate the number of kilobytes read by applications via the read(2) system call interface.

wkB_nor/s    Indicate the number of kilobytes written by applications via the write(2) system call interface.

rkB_dir/s    Indicate the number of kilobytes read from files opened with the O_DIRECT flag.

wkB_dir/s    Indicate the number of kilobytes written to files opened with the O_DIRECT flag.

rkB_svr/s    Indicate the number of kilobytes read from the server by the NFS client via an NFS READ request.

wkB_svr/s    Indicate  the number of kilobytes written to the server by the NFS client via an NFS WRITE request.

rMB_nor/s    Indicate the number of megabytes read by applications via the read(2) system call interface.

wMB_nor/s    Indicate the number of megabytes written by applications via the write(2) system call interface.

rMB_dir/s    Indicate the number of megabytes read from files opened with the O_DIRECT flag.

wMB_dir/s    Indicate the number of megabytes written to files opened with the O_DIRECT flag.

rMB_svr/s    Indicate the number of megabytes read from the server by the NFS client via an NFS READ request.

wMB_svr/s    Indicate the number of megabytes written to the server by the NFS client via an NFS WRITE  request.

ops/s    Indicate the number of operations that were issued to the filesystem per second.

rops/s    Indicate the number of ’read’ operations that were issued to the filesystem per second.

wops/s    Indicate the number of ’write’ operations that were issued to the filesystem per second.
命令参数
-C 显示CPU使用情况

-d 显示磁盘使用情况

-k 以 KB 为单位显示

-m 以 M 为单位显示

-N 显示磁盘阵列(LVM) 信息

-n 显示NFS 使用情况

-p[磁盘] 显示磁盘和分区的情况

-t 显示终端和CPU的信息

-x 显示详细信息

-V 显示版本信息
三、使用方式
Device Utilization Report
[root@localhost ~]# iostat -d -k 2 4

Linux 2.6.32-431.11.2.el6.x86_64 (localhost)        01/08/2016      _x86_64_        (4 CPU)

Device:            tps    kB_read/s    kB_wrtn/s    kB_read    kB_wrtn

xvda            114.22        13.80       713.21  372234513 19241775188

xvdb             19.26        21.24       144.25  573067009 3891812336

Device:            tps    kB_read/s    kB_wrtn/s    kB_read    kB_wrtn

xvda              0.00         0.00         0.00          0          0

xvdb              4.50         0.00        18.00          0         36

Device:            tps    kB_read/s    kB_wrtn/s    kB_read    kB_wrtn

xvda              0.00         0.00         0.00          0          0

xvdb             10.50         0.00        42.00          0         84

Device:            tps    kB_read/s    kB_wrtn/s    kB_read    kB_wrtn

xvda              0.00         0.00         0.00          0          0

xvdb             20.50         0.00        86.00          0        172
参数说明
tps:该设备每秒的传输次数,多个逻辑请求可以组合成一个单一的 I/O 请求的设备。传输具有不确定的大小。
kB_read/s:每秒从设备读取的数据量
kB_wrtn/s:每秒向设备写入的数据量
kB_read:读取的总数据量
kB_wrtn:写入的总数量数据量
[root@localhost ~]# iostat -d -x -k 1 10

Linux 2.6.32-431.11.2.el6.x86_64 (localhost)        01/08/2016      _x86_64_        (4 CPU)

Device:         rrqm/s   wrqm/s     r/s     w/s    rkB/s    wkB/s avgrq-sz avgqu-sz   await  svctm  %util

xvda              0.02     0.69    0.56  113.65    13.80   713.21    12.73     0.00    0.03   0.48   5.53

xvdb              0.02    17.88    1.07   18.19    21.24   144.27    17.19     0.13    6.71   1.69   3.25

Device:         rrqm/s   wrqm/s     r/s     w/s    rkB/s    wkB/s avgrq-sz avgqu-sz   await  svctm  %util

xvda              0.00     0.00    0.00    0.00     0.00     0.00     0.00     0.00    0.00   0.00   0.00

xvdb              0.00     0.00    0.00    5.00     0.00    20.00     8.00     0.11   22.00   4.40   2.20

Device:         rrqm/s   wrqm/s     r/s     w/s    rkB/s    wkB/s avgrq-sz avgqu-sz   await  svctm  %util

xvda              0.00     0.00    0.00    0.00     0.00     0.00     0.00     0.00    0.00   0.00   0.00

xvdb              0.00     0.00    0.00   16.00     0.00    64.00     8.00     0.80   50.19   6.81  10.90
总IO(io)/s = r/s(读) +w/s(写)
平均等待时间 = 单个 I/O 服务时间 * ( 1 + 2 + … + 请求总数-1) / 请求总数
参数说明
rrqm/s:每秒进行 merge 的读操作数目.即 delta(rmerge)/s
wrqm/s:每秒进行 merge 的写操作数目.即 delta(wmerge)/s
r/s:每秒完成的读 I/O 设备次数.即 delta(rio)/s
w/s:每秒完成的写 I/O 设备次数.即 delta(wio)/s
rsec/s:每秒读扇区数.即 delta(rsect)/s
wsec/s:每秒写扇区数.即 delta(wsect)/s
rkB/s:每秒读K字节数.是 rsect/s 的一半,因为每扇区大小为512字节.(需要计算)
wkB/s:每秒写K字节数.是 wsect/s 的一半.(需要计算)
avgrq-sz: 平均每次设备I/O操作的数据大小 (扇区).delta(rsect+wsect)/delta(rio+wio)
avgqu-sz: 平均I/O队列长度.即 delta(aveq)/s/1000 (因为aveq的单位为毫秒).
await:平均每次设备I/O操作的等待时间 (毫秒).即 delta(ruse+wuse)/delta(rio+wio)
svctm:平均每次设备I/O操作的服务时间 (毫秒).即 delta(use)/delta(rio+wio)
%util:一秒中有百分之多少的时间用于 I/O 操作,或者说一秒中有多少时间 I/O 队列是非空的.即 delta(use)/s/1000 (因为use的单位为毫秒)
如果%util 接近 100%,说明产生的I/O请求太多,I/O系统已经满负荷,该磁盘可能存在瓶颈.
如果idle小于70% IO压力就较大了,一般读取速度有较多的wait
avgqu-sz 是需要注意的地方,这个就是直接每次操作的数据的大小,如果次数多,但数据小的话,其实 IO 也会很小.如果数据大,才IO 的数据会高,通过 avgqu-sz × ( r/s or w/s ) = rsec/s or wsec/s
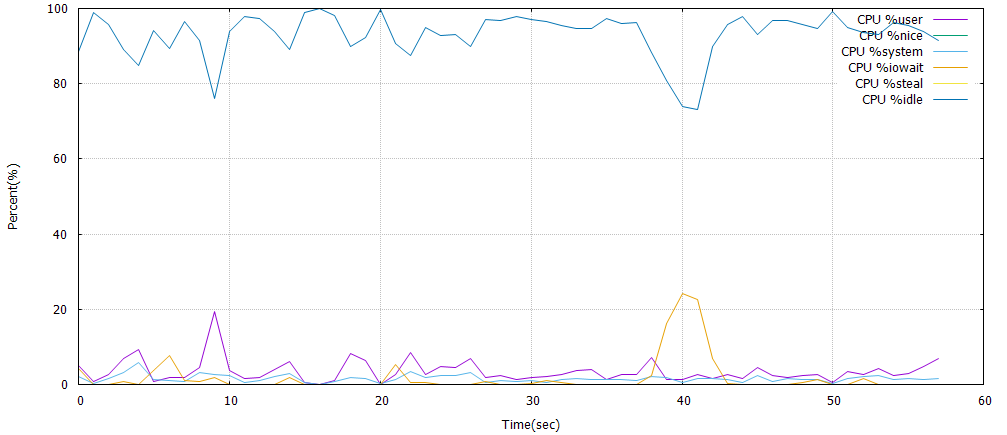
CPU Utilization Report
[root@localhost ~]# iostat -c 1 10

Linux 2.6.32-431.11.2.el6.x86_64 (localhost)        01/08/2016      _x86_64_        (4 CPU)

avg-cpu:  %user   %nice %system %iowait  %steal   %idle

           5.09    0.00    2.08    4.28    0.00   88.55

avg-cpu:  %user   %nice %system %iowait  %steal   %idle

           1.75    0.00    0.50    0.00    0.00   97.75

avg-cpu:  %user   %nice %system %iowait  %steal   %idle

           1.50    0.00    0.50    0.00    0.00   98.00

avg-cpu:  %user   %nice %system %iowait  %steal   %idle

           0.25    0.00    0.25    0.00    0.00   99.50
参数说明
%user:CPU处在用户模式下的时间百分比
%nice:CPU处在带NICE值的用户模式下的时间百分比
%system:CPU处在系统模式下的时间百分比
%iowait:CPU等待输入输出完成时间的百分比
%steal:管理程序维护另一个虚拟处理器时,虚拟CPU的无意识等待时间百分比
%idle:CPU空闲时间百分比
如果%iowait的值过高,表示硬盘存在I/O瓶颈,%idle值高,表示CPU较空闲
如果%idle值高但系统响应慢时,有可能是CPU等待分配内存,此时应加大内存容量,%idle值如果持续低于10,那么系统的CPU处理能力相对较低,表明系统中最需要解决的资源是CPU
常见用法
iostat -d -k 1 10        #查看TPS和吞吐量信息

iostat -d -x -k 1 10      #查看设备使用率(%util)、响应时间(await)

iostat -c 1 10            #查看cpu状态
参考文章
http://www.cnblogs.com/peida/archive/2012/12/28/2837345.html
http://www.mjmwired.net/kernel/Documentation/iostats.txt
http://www.orczhou.com/index.php/2010/03/iostat-detail/
http://www.php-oa.com/2009/02/03/iostat.html
Linux下使用iostat 监视I/O状态的更多相关文章
- (笔记)Linux下检测网卡与网线连接状态
http://blog.chinaunix.net/space.php?uid=20357359&do=blog&cuid=1798479 Linux下检测网卡与网线连接状态,使用io ...
- 性能监控(3)–linux下的iostat命令
iostat可以显示cpu与磁盘信息,添加-d参数可以只显示磁盘信息
- linux下利用curl监控web应用状态
监控机器列表文件: server.list 建立监控脚本: webstatus.sh #!/bin/sh monitor_dir=/home/admin/monitor/ #Log记 ...
- Linux下文件的三种时间标记(atime ctime mtime)
在windows下,一个文件有:创建时间.修改时间.访问时间. 在Linux下,一个文件有:状态改动时间.修改时间.访问时间. 1)查看文件(或文件夹)的三种时间标记 (stat 命令) Access ...
- Windows下父进程监视子进程状态
最近研究自动化测试,需要获取程序的运行状态及结果,下面是些参考资料. 原文地址:http://blog.csdn.net/ariesjzj/article/details/7226443 Linux下 ...
- 监控io性能、free、ps命令、查看网络状态、Linux下抓包 使用介绍
第7周第2次课(5月8日) 课程内容: 10.6 监控io性能 10.7 free命令10.8 ps命令10.9 查看网络状态10.10 linux下抓包扩展tcp三次握手四次挥手 http://ww ...
- Linux下周期性查看GPU状态
Linux下周期性查看GPU状态 NVIDIA自带了nvidia-smi命令来查看GPU的使用情况 了解一下watch命令 $ whatis watch watch (1) - execute a p ...
- Linux centos7日常运维——监控io性能、free内存命令、ps进程命令、查看网络状态、linux下抓包
一.监控io性能 Linux系统出现了性能问题,一般我们可以通过top.iostat.free.vmstat等命令来查看初步定位问题.其中iostat可以给我们提供丰富的IO状态数据. iostat ...
- 20个linux命令行工具监视性能(下)
昨天晚上第一次翻译了<20 Command Line Tools to Monitor Linux Performance>中的前十个命令,翻译得不是很好,今天晚上继续把后面的十个也翻译给 ...
随机推荐
- 阅读Nosql代码有感
这一年总得来说,读书的时间不多.一是因为时间啥关系,这一年一直在跟着项目走,或者被项目牵着走,几乎所有的时间和精力全部被拴在几个项目上:不过所幸今年创业失败,又回去上班了,时间相对空余了一些. 双十一 ...
- UWP开发入门(十五)——在FlipView中通过手势操作图片
本篇的最终目的,是模拟系统的照片APP可以左右滑动,缩放图片的操作.在实现的过程中,我们会逐步分析UWP编写UI的一些思路和技巧. 首先我们先实现一个横向的可以浏览图片的功能,也是大部分APP中的实现 ...
- [Bootstrap]7天深入Bootstrap(2)整体架构
大多数Bootstrap的使用者都认为Bootstrap只提供了CSS组件 和JavaScript插件,其实CSS组件和JavaScript插件只是Bootstrap框架的表现形式而已,它们都是构建在 ...
- [SQL] SQL SERVER基础语法
Struct Query Language 1.3NF a.原子性 b.不能数据冗余 c.引用其他表的主键 2.约束 a.非空约束 b.主键约束 c.唯一约束 d.默认约束 e.检查约束 f.外键约束 ...
- 2015 Multi-University Training Contest 1 - 1001 OO’s Sequence
OO’s Sequence Problem's Link: http://acm.hdu.edu.cn/showproblem.php?pid=5288 Mean: 给定一个数列,让你求所有区间上满足 ...
- 发布在IIS的网站,可以用本机IP登录访问,用localhost不可登录访问
之前在IIS发布一个测试的网址,但是用本机IP可以访问,用localhost不可访问
- SqlServer定时备份数据库和定时杀死数据库死锁解决
上周五组长对我说了一句要杀死数据库的死锁进程,有时候同一时刻不停写入数据库会造成这种情况的发生,因为自己对数据库不是很熟悉,突然组长说了我也就决定一定要倒腾一下,不然自己怎么提高呢?现在不研究,说不定 ...
- csharp: json to csharp
http://json2csharp.com/ http://jsonclassgenerator.codeplex.com/ http://jsonutils.com/ JSON生成类文件 http ...
- 优秀程序设计的Kiss原则(keep it simple,stupid)
优秀程序设计的Kiss原则(keep it simple,stupid) 良好的编程原则与良好的设计工程原则密切相关.本文总结的这些设计原则,帮助开发者更有效率的编写代码,并帮助成为一名优秀的程序员. ...
- IOS网络编请求响应之URL结构
资料均来自互联网,转载时请务必以超链接形式标明文章 原始出处 .作者信息和本声明.否则将追究法律责任. 人魔七七:http://www.cnblogs.com/qiqibo/ 对于我们IOS开发者来说 ...