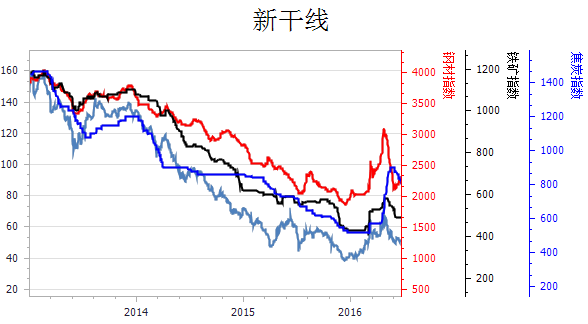
Dev之ChartControl控件(二)— 绘制多重坐标图形
有时针对一个ChartControl控件可能要设置多个Y轴,进行显示:
以下举个例子:如在一个Chart中显示多个指标项如图:
首先,读取数据,并对左边的Y轴最大和最小值进行设定
IndexSeriesControler indexControl = new IndexSeriesControler();

            IEnumerable<IndexModel> ieModel= indexControl.GetDate(dateB,dateE,indexName);//读取的数据集

            decimal max=  ieModel.Max(x => x.IndexValue);

            decimal min = ieModel.Min(x => x.IndexValue);
其次,生成Series,并添加到charControl控件;
 Series series = new Series(indexName, ViewType.Spline);

            if (num != )

            {

                lstSeries.Add(series);

            }

             foreach (IndexModel model in ieModel)

             {

                 series.Points.Add(new SeriesPoint(model.PublishDate, new double[] { (double)model.IndexValue }));

             }

             series.View = splineSeriesView1;

            this.chartControl.Series.Add(series);

            this.chartControl.Legend.Visible = false;
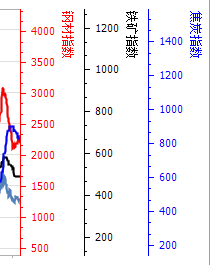
再次,创建图标的第二坐标;
效果如图:
 public void GetAxisY()

        {

            for (int i = ; i < lstSeries.Count; i++)

            {

                lstSeries[i].View.Color = lstColor[i];

                CreateAxisY(lstSeries[i]);

            }

        }

        /// <summary>

        /// 创建图表的第二坐标系

        /// </summary>

        /// <param name="series">Series对象</param>

        /// <returns></returns>

        private SecondaryAxisY CreateAxisY(Series series)

        {

            SecondaryAxisY myAxis = new SecondaryAxisY(series.Name);

            ((XYDiagram)chartControl.Diagram).SecondaryAxesY.Add(myAxis);

            ((LineSeriesView)series.View).AxisY = myAxis;

            myAxis.Title.Text = series.Name;

            myAxis.Title.Alignment = StringAlignment.Far; //顶部对齐

            myAxis.Title.Visible = true; //显示标题

            myAxis.Title.Font = new Font("宋体", 9.0f);

            Color color = series.View.Color;//设置坐标的颜色和图表线条颜色一致

            myAxis.Title.TextColor = color;

            myAxis.Label.TextColor = color;

            myAxis.Color = color;

            return myAxis;

        }
完整代码如下:
 public partial class ChartControlExtension : UserControl

    {

        public ChartControlExtension()

        {

            InitializeComponent();

            ChartTitle chartTitle=new ChartTitle();

            chartTitle.Text="新干线";

            chartTitle.TextColor=System.Drawing.Color.Black;

            this.chartControl.Titles.Add(chartTitle);

            lstColor.Add(Color.Red);

            lstColor.Add(Color.Black);

            lstColor.Add(Color.Blue);

            lstColor.Add(Color.Brown);

        }

        public bool IsRange { set; get; }

        public List<Series> lstSeries = new List<Series>();

        public List<Color> lstColor = new List<Color>();

        int num = ;

        public void GetDate(DateTime dateB, DateTime dateE, string indexName)

        {

            IndexSeriesControler indexControl = new IndexSeriesControler();

            IEnumerable<IndexModel> ieModel= indexControl.GetDate(dateB,dateE,indexName);

            decimal max=  ieModel.Max(x => x.IndexValue);

            decimal min = ieModel.Min(x => x.IndexValue);

           // this.chartControl.Series.Clear();

            Series series = new Series(indexName, ViewType.Spline);

            if (num != )

            {

                lstSeries.Add(series);

            }

             foreach (IndexModel model in ieModel)

             {

                 series.Points.Add(new SeriesPoint(model.PublishDate, new double[] { (double)model.IndexValue }));

             }           this.chartControl.Series.Add(series);

            this.chartControl.Legend.Visible = false;

            //this.chartControl.cut

            if (num == )

            {

                XYDiagram diag = (XYDiagram)this.chartControl.Diagram;

                diag.AxisY.VisualRange.MaxValue = max;

                diag.AxisY.VisualRange.MinValue = min-;

            }

            //this.IsRange = true;

            num++;

        }

        public void GetAxisY()

        {

            for (int i = ; i < lstSeries.Count; i++)

            {

                lstSeries[i].View.Color = lstColor[i];

                CreateAxisY(lstSeries[i]);

            }

        }

        /// <summary>

        /// 创建图表的第二坐标系

        /// </summary>

        /// <param name="series">Series对象</param>

        /// <returns></returns>

        private SecondaryAxisY CreateAxisY(Series series)

        {

            SecondaryAxisY myAxis = new SecondaryAxisY(series.Name);

            ((XYDiagram)chartControl.Diagram).SecondaryAxesY.Add(myAxis);

            ((LineSeriesView)series.View).AxisY = myAxis;

            myAxis.Title.Text = series.Name;

            myAxis.Title.Alignment = StringAlignment.Far; //顶部对齐

            myAxis.Title.Visible = true; //显示标题

            myAxis.Title.Font = new Font("宋体", 9.0f);

            Color color = series.View.Color;//设置坐标的颜色和图表线条颜色一致

            myAxis.Title.TextColor = color;

            myAxis.Label.TextColor = color;

            myAxis.Color = color;

            return myAxis;

        }

}
调用方法:
 private void tolBtnSearch_Click(object sender, EventArgs e)

        {

            chartControlExtension1.GetDate(datPBegin.Value,datPEnd.Value,"铁矿石指数");

            chartControlExtension1.GetDate(datPBegin.Value, datPEnd.Value, "钢材指数");

            chartControlExtension1.GetDate(datPBegin.Value, datPEnd.Value, "铁矿指数");

            chartControlExtension1.GetDate(datPBegin.Value, datPEnd.Value, "焦炭指数");

            chartControlExtension1.GetAxisY();

        }
其打印方法可用:
this.chartControl.ShowPrintPreview(DevExpress.XtraCharts.Printing.PrintSizeMode.Zoom);
Dev之ChartControl控件(二)— 绘制多重坐标图形的更多相关文章
- DevExpress控件使用之多重坐标图形的绘制 z
有时候,基于对一些年份.月份的统计,需要集成多个数值指标进行分析,因此就需要把多种数据放到一个图形里面展现,也成为多重坐标轴,多重坐标轴可以是多个X轴,也可以是Y轴,它们的处理方式类似.本文通过一个例 ...
- Dev之ChartControl控件(一)
ChartControl控件主要包括Chart Title,Legend,Annotations,Diagram,Series五部分:如图: 1. 用RangeControl控件控制ChartCon ...
- DevExpress使用之ChartControl控件绘制图表(多坐标折线图、柱状图、饼状图)
最近因为公司项目需要用到WinForm的DecExpress控件,在这里把一些使用方法总结一下. DevExpress中有一个专门用来绘制图表的插件ChartControl,可以绘制折线图.饼状图.柱 ...
- WinForm DevExpress使用之ChartControl控件绘制图表一——基础
最近因为公司项目需要用到WinForm的DecExpress控件,在这里把一些使用方法总结一下. DevExpress中有一个专门用来绘制图表的插件ChartControl,可以绘制折线图.饼状图.柱 ...
- QRowTable表格控件(二)-红涨绿跌
目录 一.开心一刻 二.概述 三.效果展示 四.任务需求 五.指定列排序 六.排序 七.列对其方式 八.相关文章 原文链接:QRowTable表格控件(二)-红涨绿跌 一.开心一刻 一天,五娃和六娃去 ...
- 玩转控件:对Dev中GridControl控件的封装和扩展
又是一年清明节至,细雨绵绵犹如泪光,树叶随风摆动.... 转眼间,一年又过去了三分之一,疫情的严峻让不少企业就跟清明时节的树叶一样,摇摇欲坠.裁员的裁员,降薪的降薪,996的996~~说起来都是泪,以 ...
- Windows高DPI系列控件(二) - 柱状图
目录 一.QCP 二.效果展示 三.高DPI适配 1.自定义柱状图 2.新的柱状图 3.测试代码 四.相关文章 原文链接:Windows高DPI系列控件(二) - 柱状图 一.QCP QCP全称QCu ...
- WPF 截图控件之绘制箭头(五)「仿微信」
前言 接着上周写的截图控件继续更新 绘制箭头. 1.WPF实现截屏「仿微信」 2.WPF 实现截屏控件之移动(二)「仿微信」 3.WPF 截图控件之伸缩(三) 「仿微信」 4.WPF 截图控件之绘制方 ...
- 在Image控件中绘制文字
//Canvas 在Image控件中绘制文字 procedure TForm1.Button1Click(Sender: TObject);begin image1.Canvas.Font.Size ...
随机推荐
- Openjudge-计算概论(A)-简单算术表达式求值
描述: 两位正整数的简单算术运算(只考虑整数运算),算术运算为: +,加法运算:-,减法运算:*,乘法运算:/,整除运算:%,取余运算. 算术表达式的格式为(运算符前后可能有空格):运算数 运算符 运 ...
- spring之json数据的接受和发送
配置spring对json的注解方式. <!-- 启动Spring MVC的注解功能,完成请求和注解POJO的映射 --> <bean class="org.springf ...
- javascript 值传递
在js中 简单类型是值传递 复杂类型是引用传递 简单类型:String Number Boolean undefined Null 复杂类型:Object 下面的代码演示这个 var simpleNa ...
- 《实战Java高并发程序设计》pdf
花了我五元大洋,需要的拿去吧.百度云盘:https://pan.baidu.com/s/1o8bESY2
- wireshark 包过滤
tcp.port == 443 or udp.port==443 or tcp.port==53 or udp.port==53
- java类的初始化
转载:http://blog.csdn.net/moreevan/article/details/6968718 我们知道一个类(class)要被使用必须经过装载,连接,初始化这样的过程.下面先对这三 ...
- hdu_5707_Combine String("巴卡斯杯" 中国大学生程序设计竞赛 - 女生专场)
题目连接:http://acm.hdu.edu.cn/showproblem.php?pid=5707 题意:给你三个字符串 a,b,c,问你 c能否拆成a,b,a,b串的每一个字符在c中不能变 题解 ...
- hdu_4507_吉哥系列故事——恨7不成妻(鬼畜数位DP)
题目连接:http://acm.hdu.edu.cn/showproblem.php?pid=4507 题意:中文,不解释,注意的是求的是合法数字的平方和,即(a+b+c+……)^2 题解:数位DP, ...
- 读入一行字符给string类型
小技巧 string ss: getline(cin,ss):
- .NET面试题目一
简单介绍下ADO.NET和ADO主要有什么改进? 答:ADO以Recordset存储,而ADO.NET则以DataSet表示,ADO.NET提供了数据集和数据适配器,有利于实现分布式处理,降低了对数据 ...