
[转帖]Always-on Profiling for Production Systems
https://0x.tools/
0x.tools (GitHub) is a set of open-source utilities for analyzing application performance on Linux. It has a goal of deployment simplicity and minimal dependencies, to reduce friction of systematic troubleshooting. There’s no need to upgrade the OS, install kernel modules, heavy monitoring frameworks, Java agents or databases. These tools also work on over-decade-old Linux kernels, like version 2.6.18 from 14 years ago.
0x.tools allow you to measure individual thread level activity, like thread sleep states, currently executing system calls and kernel wait locations. Additionally, you can drill down into CPU usage of any thread or the system as a whole. You can be systematic in your troubleshooting - no need for guessing or clever metric-voodoo tricks with traditional system-level statistics.
Table of Contents
Included Tools
You get two classes of utilities:
- Real-time interactive tools for analyzing current system behavior as it is happening.
- Low-overhead thread activity samplers for always-on low-frequency profiling of production systems. The continuously captured data allows you to “go back in time” and systematically troubleshoot even intermittent problems right after (or during) their first occurrence.
| Command | Description |
|---|---|
| psn | Show current top thread activity by sampling /proc files |
| xcapture | Low-overhead thread state sampler reading /proc files |
| schedlat | Show single process’es CPU scheduling latency as a % of its runtime |
| run_xcapture.sh | A simple “daemon” script for keeping xcapture running |
| run_xcpu.sh | Low-frequency continuous stack sampling for threads on CPU (using perf) |
xcapture is written in C for efficiency reasons and it consists of just a single C source file and a single header file for system call name translation. All other tools are Python or shell scripts.
Usage & Example Output
Sample Linux thread activity and show fixed-width output on screen:
$ xcapture

0xTools xcapture v1.0 by Tanel Poder [https://0x.tools]

Sampling /proc...

DATE       TIME             PID     TID USERNAME        ST COMMAND                   SYSCALL                   WCHAN

2020-10-17 12:01:50.583    6404    7524 mysql           R  (mysqld)                  fsync                     wait_on_page_bit

2020-10-17 12:01:50.583    6404    8944 mysql           D  (mysqld)                  fsync                     wait_on_page_bit

2020-10-17 12:01:50.583    6404    8946 mysql           D  (mysqld)                  fsync                     wait_on_page_bit

2020-10-17 12:01:50.583    6404   76046 mysql           D  (mysqld)                  fsync                     wait_on_page_bit

2020-10-17 12:01:50.583    6404   76811 mysql           D  (mysqld)                  fdatasync                 xfs_log_force_lsn

2020-10-17 12:01:50.583    6404   76815 mysql           D  (mysqld)                  fsync                     blkdev_issue_flush

2020-10-17 12:01:50.583    8803    8803 root            R  (md10_resync)             [running]                 0

DATE       TIME             PID     TID USERNAME        ST COMMAND                   SYSCALL                   WCHAN

2020-10-17 12:01:51.623    6404    7521 mysql           D  (mysqld)                  pwrite64                  xfs_file_buffered_aio_write

2020-10-17 12:01:51.623    6404    7524 mysql           D  (mysqld)                  fsync                     xfs_log_force_lsn

2020-10-17 12:01:51.623    6404    7767 mysql           D  (mysqld)                  fsync                     xfs_log_force_lsn

2020-10-17 12:01:51.623    6404    8398 mysql           D  (mysqld)                  fsync                     call_rwsem_down_read_failed

2020-10-17 12:01:51.623    6404    5446 mysql           D  (mysqld)                  fsync                     xfs_log_force_lsn

2020-10-17 12:01:51.623    6404    8941 mysql           D  (mysqld)                  pwrite64                  xfs_file_buffered_aio_write

2020-10-17 12:01:51.623    6404    8944 mysql           D  (mysqld)                  pwrite64                  xfs_file_buffered_aio_write

2020-10-17 12:01:51.623    6404    8945 mysql           D  (mysqld)                  pwrite64                  xfs_file_buffered_aio_write

2020-10-17 12:01:51.623    6404   76045 mysql           D  (mysqld)                  fsync                     call_rwsem_down_read_failed

2020-10-17 12:01:51.623    6404   76046 mysql           D  (mysqld)                  pwrite64                  xfs_file_buffered_aio_write

2020-10-17 12:01:51.623    6404   76810 mysql           D  (mysqld)                  pwrite64                  xfs_file_buffered_aio_write

2020-10-17 12:01:51.623    6404   76811 mysql           D  (mysqld)                  fdatasync                 xfs_log_force_lsn

2020-10-17 12:01:51.623    6404   76812 mysql           D  (mysqld)                  fsync                     wait_on_page_bit

2020-10-17 12:01:51.623    8803    8803 root            D  (md10_resync)             [no_syscall]              msleep
Watch a SVG video of xcapture in action!
Sample threads in all states (including Sleeping) and write output into hourly CSV files:
$ xcapture -a -o /data/xcap &

$ head 2020-10-16.21.csv

TS,PID,TID,USERNAME,ST,COMMAND,SYSCALL,WCHAN,EXE,CMDLINE,KSTACK

2020-10-16 21:00:00.001,5335,5335,root,R,(collectl),[running],0,perl,/usr/bin/perl,

2020-10-16 21:00:00.001,8803,8803,root,D,(md10_resync),[no_syscall],msleep,-,-,->ret_from_fork_nospec_begin()->kthread()->md_thread()->md_do_sync()->msleep()

2020-10-16 21:00:01.038,8803,8803,root,R,(md10_resync),[no_syscall],md_do_sync,-,-,->ret_from_fork_nospec_begin()->kthread()->md_thread()->md_do_sync()

2020-10-16 21:00:02.075,8803,8803,root,D,(md10_resync),[no_syscall],md_do_sync,-,-,->ret_from_fork_nospec_begin()->kthread()->md_thread()->md_do_sync()

2020-10-16 21:00:02.075,16762,16762,oracle,R,(ora_m000_lin19c),[running],0,oracle,ora_m000_LIN19C,->do_blockdev_direct_IO()->dio_complete()

2020-10-16 21:00:03.112,8803,8803,root,R,(md10_resync),[no_syscall],md_do_sync,-,-,->ret_from_fork_nospec_begin()->kthread()->md_thread()->md_do_sync()

2020-10-16 21:00:04.149,8803,8803,root,D,(md10_resync),[no_syscall],msleep,-,-,->ret_from_fork_nospec_begin()->kthread()->md_thread()->md_do_sync()->msleep()

2020-10-16 21:00:05.186,8803,8803,root,D,(md10_resync),[no_syscall],md_do_sync,-,-,->ret_from_fork_nospec_begin()->kthread()->md_thread()->md_do_sync()

2020-10-16 21:00:05.186,65913,65913,oracle,D,(ora_ckpt_lin122),pwrite64,blkdev_issue_flush,oracle,ora_ckpt_LIN122,->system_call_fastpath()->SyS_pwrite64()->vfs_write()->do_sync_write()->xfs_file_aio_write()->generic_write_sync()->xfs_file_fsync()->xfs_blkdev_issue_flush()->blkdev_issue_flush()
You can “Query” the thread activity history for performance analysis on the command line (or just load the CSV into any database):
Query CSV files with standard Linux text processing tools. It’s like SQL but with different keywords: grep for filtering, cut, awk for column projection, uniq for group by and sort for ordering. Filename patterns like cat 2020-10-??.0[89].csv could be used for scanning through only the files of interest (partition pruning):
$ cat 2020-10-13.01.csv | awk -F, '{ printf("%2s %-20s %-20s %s\n",$5,$4,$7,$10) }' | sort | uniq -c | sort -nbr | head -20

   2303  D root                 read                 -

   1761  R tanel                [running]            stress

   1384  D postgres             pread64              postgres: tanel pgbench [local] UPDATE

    894  R root                 [running]            -

    229  R root                 read                 -

    229  D mysql                fsync                /usr/sbin/mysqld

    144  R tanel                [running]            -

    115  - -                    -                    -

    110  D oracle               io_submit            ora_ckpt_LINPRD

    101  D root                 [running]            -

     73  D root                 read                 dd

     58  R root                 [running]            /opt/oracle.ahf/jre/bin/java

     55  R mysql                [running]            /usr/sbin/mysqld

     52  D tanel                [no_syscall]         stress

     51  R oracle               [running]            oracleLIN19C

     50  R root                 [running]            dd

     35  R oracle               [running]            xe_mz01_XE

     32  R tanel                [running]            /usr/lib/jvm/java-1.8.0-openjdk-1.8.0.262.b10-0.el7_8.x86_64/jre/bin/java

     29  R oracle               [running]            pidstat

     27  D oracle               pread64              oracleLIN19C
Or you can query CSV files with q-text-as-data:
$ q -d, -bTH '

select count(*) avgthr, username,st,syscall,wchan

from 2020-10-13.01.csv

group by username,st,syscall,wchan

order by 1 desc' | head -20

1955	tanel   	R	[running]   	0

1384	postgres	D	pread64     	generic_file_read_iter

1084	root    	D	read        	raise_barrier

1041	root    	R	[running]   	0

712 	root    	D	read        	msleep

341 	oracle  	R	[running]   	0

317 	root    	D	read        	md_super_wait

123 	mysql   	D	fsync       	__xfs_log_force_lsn

115 	-       	-	-           	-

92  	oracle  	D	io_submit   	md_write_start

92  	root    	R	read        	raise_barrier

79  	root    	D	read        	wait_barrier

66  	oracle  	R	nanosleep   	hrtimer_nanosleep

66  	root    	D	[running]   	0

52  	mysql   	R	[running]   	0

51  	root    	R	read        	worker_thread

48  	mysql   	D	fsync       	submit_bio_wait

48  	root    	D	read        	0

41  	tanel   	D	[no_syscall]	rq_qos_wait

39  	root    	D	read        	md_bitmap_cond_end_sync
Or you can do tabular data analysis in your terminal with the awesome VisiData tool. Note that the video below does not have sound (it’s not your computer :-)
This brings me back memories of Lotus 1-2-3 on a crappy 286 with floppy drives and MS-DOS!
Installation & Usage
xcapture, schedlat and psn sample the Linux /proc filesystem just like standard tools like ps, top and lsof do. The /proc filesystem is essentially Linux kernel presenting useful metrics into userspace as user-readable files. So, you do not need any additional Linux configuration or anything fancy to be installed on your hosts. 0x.tools require Linux kernel version 2.6 or later, so they will work even on your legacy installations (like RHEL 5, CentOS 5) from 15 years ago.
Note that for running psn on CentOS 5 (RHEL 5 clones), you need to have Python 2.6+ on it (it can be installed from EPEL repo).
$ git clone https://github.com/tanelpoder/0xtools

$ make

$ sudo make install
Running 0xTools utilities:
xCapture
$ xcapture

0x.Tools xcapture v1.0 by Tanel Poder [https://0x.tools]

Usage:

  xcapture [options]

  By default, sample all /proc tasks in states R, D every second and print to stdout

  Options:

    -a             capture tasks in additional states, even the ones Sleeping (S)

    -A             capture tasks in All states, including Zombie (Z), Exiting (X), Idle (I)

    -c <c1,c2>     print additional columns (for example: -c exe,cmdline,kstack)

    -d <N>         seconds to sleep between samples (default: 1)

    -E <string>    custom task state Exclusion filter (default: XZIS)

    -h             display this help message

    -o <dirname>   write wide output into hourly CSV files in this directory instead of stdout

$ xcapture -c exe,kstack

$ xcapture -o .

$ xcapture -o /data/perf_archive/xcap
Linux Process Snapper
Linux Process Snapper is a Python script meant for troubleshooting currently on-going issues (no historical capture). It currently reports more fields directly from /proc than xcapture captures (like filenames accessed by IO system calls). I plan to improve this tool so that it could use xcapture CSV files as an input, in addition to current real-time monitoring.
IO bottleneck example: My “pipeline” is bottlenecked by writes to the output file, not input reads:
$ psn -p 18286 -G syscall,filename

Linux Process Snapper v0.14 by Tanel Poder [https://0x.tools]

Sampling /proc/stat, syscall for 5 seconds... finished.

=== Active Threads ==================================================================================

 samples | avg_threads | comm | state                  | syscall   | filename

-----------------------------------------------------------------------------------------------------

      79 |        0.79 | (dd) | Disk (Uninterruptible) | write     | /backup/tanel/test (stdout)

       7 |        0.07 | (dd) | Disk (Uninterruptible) | [running] |

       5 |        0.05 | (dd) | Running (ON CPU)       | write     | /backup/tanel/test (stdout)

       4 |        0.04 | (dd) | Disk (Uninterruptible) | read      | /reco/fio/mmapfile.0.0 (stdin)

       3 |        0.03 | (dd) | Running (ON CPU)       | [running] |

       2 |        0.02 | (dd) | Running (ON CPU)       | read      | /reco/fio/mmapfile.0.0 (stdin)  ```
MySQL I/O bottleneck example: there’s some OS kernel inode level semaphore contention due to frequent use of fsync():
$ sudo psn -p "mysqld|kwork" -G syscall,wchan

Linux Process Snapper v0.14 by Tanel Poder [https://0x.tools]

Sampling /proc/syscall, stat, wchan for 5 seconds... finished.

=== Active Threads ========================================================================================

 samples | avg_threads | comm          | state                  | syscall   | wchan

-----------------------------------------------------------------------------------------------------------

      25 |        3.12 | (mysqld)      | Disk (Uninterruptible) | fsync     | _xfs_log_force_lsn

      16 |        2.00 | (mysqld)      | Running (ON CPU)       | [running] | 0

      14 |        1.75 | (mysqld)      | Disk (Uninterruptible) | pwrite64  | call_rwsem_down_write_failed

       8 |        1.00 | (mysqld)      | Disk (Uninterruptible) | fsync     | submit_bio_wait

       4 |        0.50 | (mysqld)      | Disk (Uninterruptible) | pread64   | io_schedule

       4 |        0.50 | (mysqld)      | Disk (Uninterruptible) | pwrite64  | io_schedule

       3 |        0.38 | (mysqld)      | Disk (Uninterruptible) | pread64   | 0

       3 |        0.38 | (mysqld)      | Running (ON CPU)       | [running] | io_schedule

       3 |        0.38 | (mysqld)      | Running (ON CPU)       | pread64   | 0

       2 |        0.25 | (mysqld)      | Disk (Uninterruptible) | [running] | 0

       1 |        0.12 | (kworker/*:*) | Running (ON CPU)       | read      | worker_thread

       1 |        0.12 | (mysqld)      | Disk (Uninterruptible) | fsync     | io_schedule

       1 |        0.12 | (mysqld)      | Disk (Uninterruptible) | futex     | call_rwsem_down_write_failed

       1 |        0.12 | (mysqld)      | Disk (Uninterruptible) | poll      | 0

       1 |        0.12 | (mysqld)      | Disk (Uninterruptible) | pwrite64  | _xfs_log_force_lsn

       1 |        0.12 | (mysqld)      | Running (ON CPU)       | fsync     | submit_bio_wait

       1 |        0.12 | (mysqld)      | Running (ON CPU)       | futex     | futex_wait_queue_me
More info and examples are available at Tanel Poder’s Linux Performance Troubleshooting Page
SchedLat
$ ./schedlat.py 29801

SchedLat by Tanel Poder [https://0x.tools]

PID=29801 COMM=oracle_29801_li

TIMESTAMP              %CPU   %LAT   %SLP

2020-02-26 23:17:35   100.0    0.0    0.0   <<-- no CPU shortage, process 100% on CPU

2020-02-26 23:17:36   100.0    0.0    0.0

2020-02-26 23:17:37   100.0    0.0    0.0

2020-02-26 23:17:38   100.0    0.0    0.0   <<-- %SLP = 100-(%CPU+%LAT), when Linux reports slightly

2020-02-26 23:17:39    98.0    0.0    2.0        more than "100%" of CPU+LAT, then the derived

2020-02-26 23:17:40     0.0    0.0  100.0        "remaining time" SLP% may show a negative value

2020-02-26 23:17:41     0.0    0.0  100.0

2020-02-26 23:17:42     0.0    0.0  100.0   <<-- no CPU shortage, process sleeping

2020-02-26 23:17:43     0.4    0.0   99.6

2020-02-26 23:17:44    33.5    0.2   66.3   <<-- no CPU shortage, process doing synchronous I/Os

2020-02-26 23:17:45    55.5    0.2   44.2        in a loop (thus taken off CPU frequently by scheduler)

2020-02-26 23:17:46    53.9    0.2   45.9

2020-02-26 23:17:47    54.5    0.2   45.3

2020-02-26 23:17:48    59.1    0.2   40.7

2020-02-26 23:17:49     4.4    0.0   95.6

2020-02-26 23:17:50    58.5    0.1   41.4

2020-02-26 23:17:51    95.7    0.0    4.3

2020-02-26 23:17:52     0.3    0.0   99.7

2020-02-26 23:17:53     0.1    0.0   99.9

2020-02-26 23:17:54     0.1    0.0   99.9

2020-02-26 23:17:55     0.3    1.1   98.6

2020-02-26 23:17:56     0.1    6.0   93.9

2020-02-26 23:17:57     0.1   15.0   84.9

2020-02-26 23:17:58     0.1   13.8   86.1

2020-02-26 23:17:59     9.6   61.4   29.0   <<-- CPU shortage + process doing synchronous I/Os in a loop

2020-02-26 23:18:00    14.6   83.9    1.5   <<-- and spending more time in CPU runqueue after every I/O

2020-02-26 23:18:01    31.4   59.7    8.9

2020-02-26 23:18:02    13.0   13.9   73.1

2020-02-26 23:18:03     0.3    5.3   94.4
There are more details in my Measuring Linux CPU Scheduling Latency blog entry.
CPU profiling
When you look into the run_xcpu.sh, you’ll see that I’m currently using just perf under the hood with 1 Hz frequency. You can have it always-on no noticeable performance overhead!
$ cat bin/run_xcpu.sh

...

perf record -g -F 1 -a \

            --switch-output=1m \

            --timestamp-filename \

            --timestamp \

            -o $1/xcpu

...
With the above arguments, perf writes the sampled on-CPU stack traces into 1-minute granularity files.
Then all you need to do is run perf on the file with the right timestamp, to zoom in to the time of your performance problem:
$ perf report -s sym,dso -i xcpu.2020101619323791
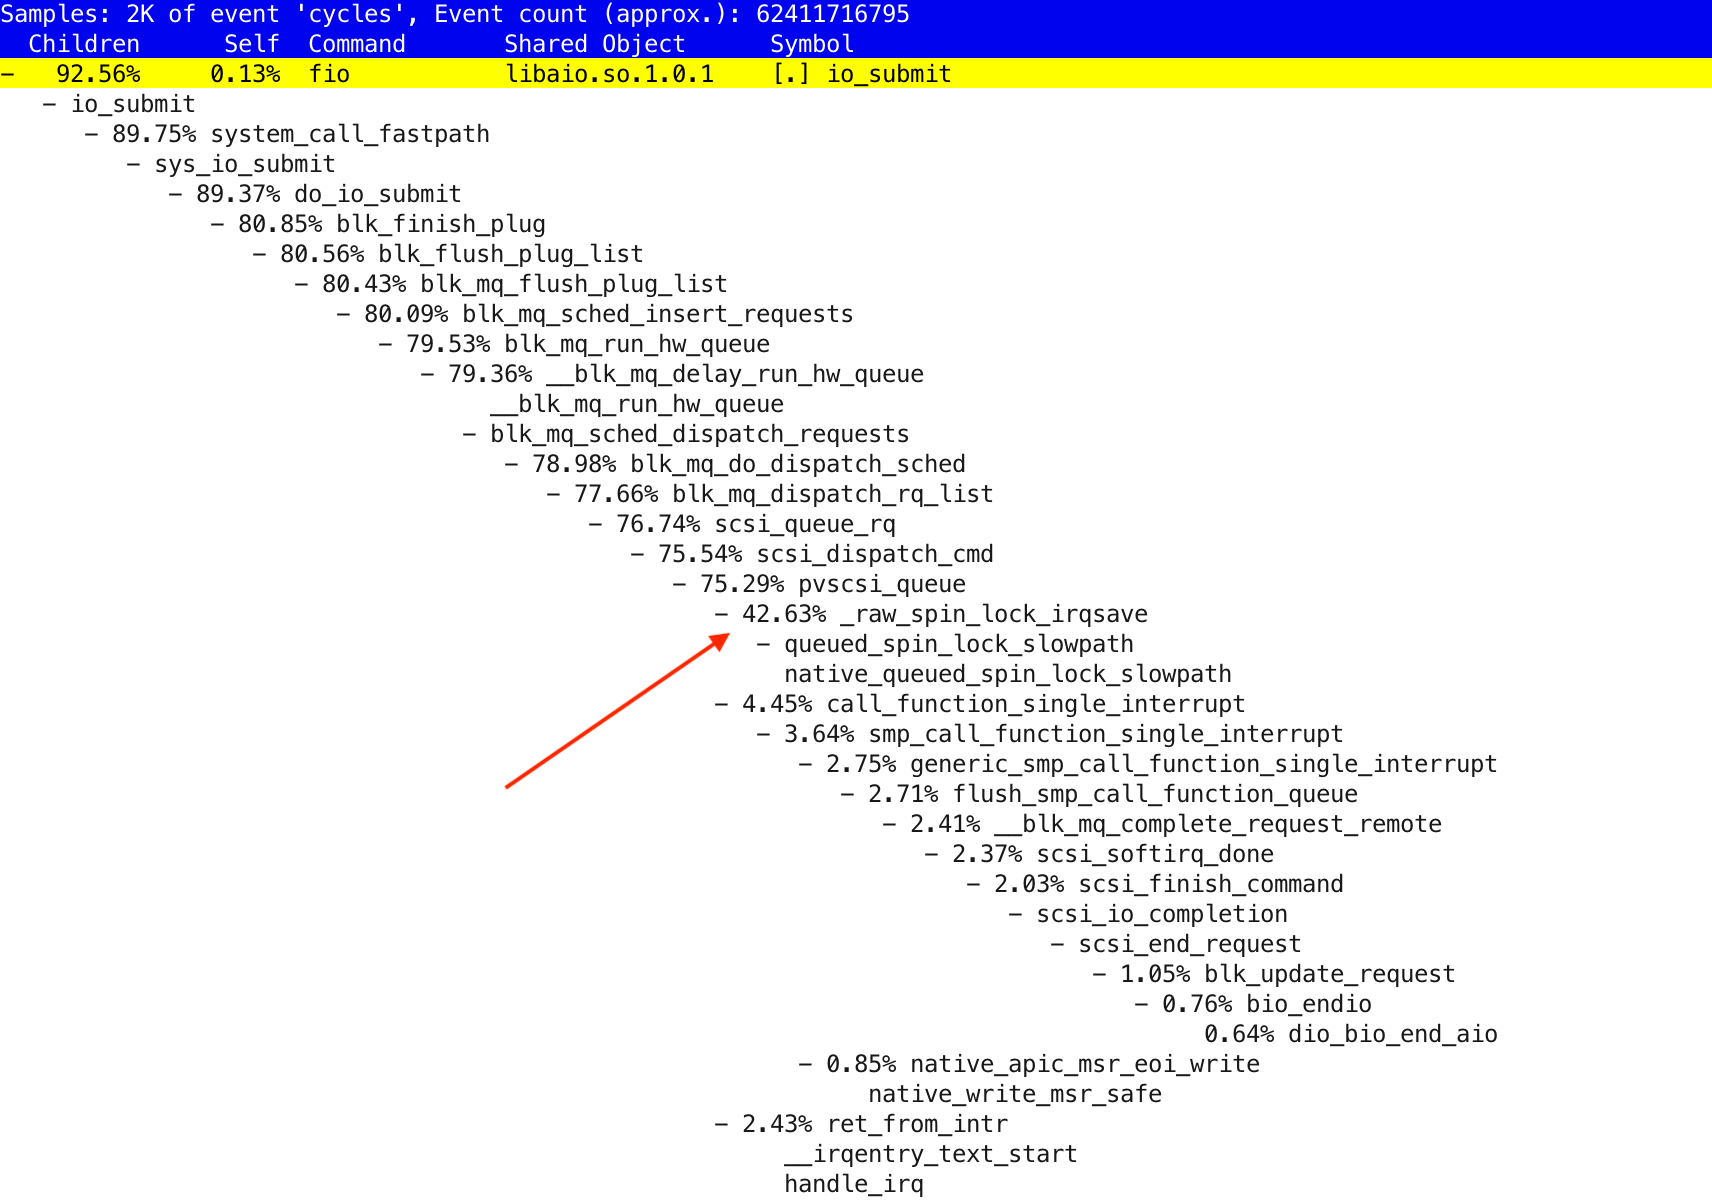 Perf CPU usage profile, including kernel-mode and interrupts CPU usage
FAQ
How is the 0x.tools toolset licensed?
0x.tools is an open source, GPL v3-licensed product, so you can use it like most other standard command line tools in your Linux distribution.
What is the measurement overhead?
0x.tools xcapture is designed to have very low overhead, well under 1% of your server’s CPU capacity, even when sampling every second. Note that xcapture does not invoke any tracing, but samples already built-in kernel instrumentation from /proc file system asynchronously and independently. Therefore it won’t slow any of your existing applications down, but uses a small percentage of one CPU in the system for its sampling. In extreme cases (with tens of thousands of active threads), you can reduce sampling frequency to reduce xcapture CPU usage.
The run_xcpu.sh CPU sampling script uses standard Linux perf utility under the hood, with just 1 Hz sampling rate by default. Thanks to the low-frequency sampling, perf will not cause noticeable overhead for your applications.
Is it safe to use in production?
0x.tools are designed to be safely used in production, including traditional enterprise environments where you can’t just upgrade to latest OS version at will or load custom kernel modules. All the code is open source, without any dependencies outside the standard Linux utilities and libraries, skimming through a few hundred lines of 0x.tools C and Python code should be doable in matter of minutes.
As with all software and tools, I recommend to try them first on a test system (ideally similar to production) and see how it works, before deploying to production.
Why not just use perf for everything (including xcapture)?
Perf sampling captures only on-CPU activity by default. If you have 32 CPUs, it will check what code is running on them at every sample, but does not aim to walk through the hundreds (or thousands) of OS threads that happen to be sleeping. While it is possible to enable tracing for off-cpu events in Perf, it comes with a high tracing overhead (and later, overhead of post-processing these high-frequency events).
Why not just use BPF instead of /proc sampling?
In short, eBPF is not available for wide-scale production use in traditional enterprises (think banks, telcos and other Fortune 500s with decades of IT history). This may come as a surprise if you’ve worked only for startups running latest ephemeral Ubuntu containers in the cloud :-) For example RedHat started actually supporting eBPF in RHEL 8.1 (Released Nov 2019). The enterprises I work with, still have RHEL6 (kernel 2.6.32) as their mostly widely used OS version, with RHEL7 (and CentOS 7) gaining traction. So “let’s just do a major OS upgrade” for troubleshooting this performance spike is out of the question.
Nevertheless, I have written an eBPF sampler prototype already, it combines both thread state and CPU usage profiling into one tool. But I wanted to productionize the simpler, widely available /proc file-based profiler first, for practical reasons.
Why not just use distributed tracing like OpenTracing, Zipkin, Jaeger?
These powerful, but complex frameworks are high level end-to-end tracers of request flow through application layers and components. They are designed to point out in which component of your distributed multi-tier system most of the user response was spent, but they do not drill down into the reason why. 0x.tools are designed to fill that gap.
Why not just use something like Prometheus?
Prometheus is designed for shipping, storing and serving system & appliction time-series metrics captured from a large fleet of servers & applications. You can plot nice dashboards with charts showing various latency, request count and system utilization metrics over time. Such time-series metrics are useful background info, but do not allow you to drill down into the low level reasons of increased system activity, application resource usage or misbehavior of the OS kernel itself.
What’s next?
There are a lot of new features and utilities that can be added to 0xTools suite. Before I go there, I will work on some packaging & productionization things first (scripts for automatic compression & archiving of the captured files, installation via a RPM/DEB package, built-in data visualization). Feel free to submit ideas and issues in the 0x.Tools GitHub repo.
I also deliver consulting and training around systematic Linux troubleshooting & tuning, including helping you to come up with a strategy for rolling out always-on profiling for production systems in your company.
Get 0x.Tools updates via Twitter @0xtools.
Articles
Linux performance & troubleshooting articles by Tanel Poder
Profiling Linux Activity for Performance And Troubleshooting video by Tanel Poder
Using 0xtools with MySQL series by Valerii Kravchuk
[转帖]Always-on Profiling for Production Systems的更多相关文章
- [转帖]SAP一句话入门:Production Planning
SAP一句话入门:Production Planning http://blog.vsharing.com/MilesForce/A617692.html SAP是庞大的,模块是多多的,功能是强大的, ...
- Uniform synchronization between multiple kernels running on single computer systems
The present invention allocates resources in a multi-operating system computing system, thereby avoi ...
- Oracle之多行记录变一行记录,行变列,并排序(wmsys.wm_concat)
原帖:http://www.cnblogs.com/nayitian/p/3231734.html wmsys.wm_concat Definition: The Oracle PL/SQL WM_C ...
- DTrace to Troubleshoot Java Native Memory Problems
How to Use DTrace to Troubleshoot Java Native Memory Problems on Oracle Solaris 11 Hands-On Labs of ...
- mono环境变量
mono环境变量 2013-05-11 01:14:33| 分类: mono|举报|字号 订阅 下载LOFTER我的照片书 | Name mono - Mono's ECMA-CL ...
- 05 Diagnostics 诊断
Diagnostics 诊断 Introduction 介绍 Profiling 分析 Tracing 跟踪 Debugging 调试 Runtime statistics and events 运行 ...
- java命令行
Launches a Java application. Synopsis java [options] classname [args] java [options] -jar filename [ ...
- oracle中的用户详解 【转】
oracle中的用户很多,也很令初学者费解.oracle中的帐户分为两类:一类是必需的帐户,一类是存储各种应用的帐户 用户名 密码 描述 ANONYMOUS ANONYMOUS 访问http的匿名 ...
- Apache Sqoop - Overview——Sqoop 概述
Apache Sqoop - Overview Apache Sqoop 概述 使用Hadoop来分析和处理数据需要将数据加载到集群中并且将它和企业生产数据库中的其他数据进行结合处理.从生产系统加载大 ...
- Install Docker on Ubuntu
Install Docker on Ubuntu Estimated reading time: 17 minutes Docker is supported on these Ubuntu oper ...
随机推荐
- 0X01 位运算笔记
位运算,经常可以用来处理一些数学或动归方面的问题,通常会在数据范围较小的情况下使用. 为方便起见,一个 \(\mathrm{n}\) 位二进制数从右到左分别为第 \(\mathrm{0 \sim n ...
- Java中ArrayList的遍历与删除元素方式总结
在Java编程中,我们经常需要对数据结构进行遍历操作,并根据业务需求删除部分元素.而数组列表(ArrayList)是集合类中的一种,它可以动态地添加和删除元素,非常适合在程序中使用.本篇博客将总结Ar ...
- QNX 性能分析工具
QNX 性能分析工具 小结 hogs:列出最占用 CPU/RAM 的进程,可以统计内存占用详细情况[可单个进程] pidin:显示进程信息.系统信息.库信息...[可单个进程] ps:显示进程信息[可 ...
- 文心一言 VS 讯飞星火 VS chatgpt (53)-- 算法导论6.2 5题
五.MAX-HEAPIFY的代码效率较高,但第 10 行中的递归调用可能例外,它可能使某些编译器产生低效的代码.请用循环控制结构取代递归,重写 MAX-HEAPIFY代码. 文心一言: 以下是使用循环 ...
- Python中的@abstractmethod
@abstractmethod 是 Python 中 abc 模块(Abstract Base Classes)提供的一个装饰器,用于声明抽象方法.抽象方法是指在抽象类中声明但没有提供具体实现的方 ...
- Spring Boot 整合 Log4j2 日志并压测性能
1/ Log4j2的性能测试 从图中不难看出,在线程数为 2~16 之间,混合使用同步和异步的logger来打印日志,性能是最好的. 2/ 目标 混合 sync/async 彩色日志 分类输出到不同文 ...
- 干货分享丨轻松玩转 Huawei LiteOS 传感框架
摘要:LiteOS传感框架将物联网终端设备上不同类型的传感器统一管理,通过抽象不同类型传感器接口,屏蔽其硬件细节,做到"硬件"无关性,非常方便于物联网设备的开发.维护和功能扩展. ...
- OpenCV萌新福音:易上手的数字识别实践案例
摘要:信用卡识别的案例用到了图像处理的一些基本操作,对刚上手CV的人来说还是比较友好的. 本文分享自华为云社区<Python openCV案例:信用卡数字识别>,原文作者:深蓝的回音 . ...
- 云图说|一张图看懂一站式DevOps利器——华为云DevCloud
阅识风云是华为云信息大咖,擅长将复杂信息多元化呈现,其出品的一张图(云图说).深入浅出的博文(云小课)或短视频(云视厅)总有一款能让您快速上手华为云.更多精彩内容请单击此处. 摘要: 华为云DevCl ...
- 华为云GaussDB深耕数字化下半场,持续打造数据库根技术
摘要:华为云数据库CTO庄乾锋携华为云数据库多位技术专家和优秀合作伙伴共同参与DTCC2021大会并发表了重要主题演讲. 10月18日,以"数造未来"为主题的第12届中国数据库技术 ...