matplotlib热图
1.基础知识点回顾
- 1.plot(x, y, marker='D')表示绘制折线图,marker设置样式菱形。
- 2.scatter(x, y, marker='s', color='r')绘制散点图,红色正方形。
- 3.bar(x, y, 0.5, color='c')绘制柱状图,间距为0.5,原色。
- 4.hist(data,40,normed=1,histtype='bar',facecolor='yellowgreen',alpha=0.75)直方图。
- 5.设置x轴和y轴的坐标值:
- xlim(-2.5, 2.5) #设置x轴范围
- ylim(-1, 1) #设置y轴范围
- 6.显示中文和负号代码如下:
- plt.rcParams['font.sas-serig']=['SimHei'] #用来正常显示中文标签
- plt.rcParams['axes.unicode_minus']=False #用来正常显示负号
2.Heatmap热图基础知识
详情请参阅:http://matplotlib.org/users/image_tutorial.html
In [1]: import matplot.pyplot as plt

In [2]: help(plt.imshow)

Help on function imshow in module matplotlib.pyplot:

imshow(X, cmap=None, norm=None, aspect=None, interpolation=None, alpha=None, vmin=None, vmax=None, origin=None, extent=None, shape=None, filternorm=1, filterrad=4.0, imlim=None, resample=None, url=None, hold=None, data=None, **kwargs)

    Display an image on the axes.

    Parameters

    ----------

    X : array_like, shape (n, m) or (n, m, 3) or (n, m, 4)

        Display the image in `X` to current axes.  `X` may be an

        array or a PIL image. If `X` is an array, it

        can have the following shapes and types:

        - MxN -- values to be mapped (float or int)

        - MxNx3 -- RGB (float or uint8)

        - MxNx4 -- RGBA (float or uint8)

        The value for each component of MxNx3 and MxNx4 float arrays

        should be in the range 0.0 to 1.0. MxN arrays are mapped

        to colors based on the `norm` (mapping scalar to scalar)

        and the `cmap` (mapping the normed scalar to a color).

    cmap : `~matplotlib.colors.Colormap`, optional, default: None

        If None, default to rc `image.cmap` value. `cmap` is ignored

        if `X` is 3-D, directly specifying RGB(A) values.
参数X可以是图片也可以数组,若是数组,必须以下三种形式
- MxN:values to be mapped (float or int)
- MxNx3 -- RGB (float or uint8)
- MxNx4 -- RGBA (float or uint8))
- 3维数组或4维数组范围必须是(0,1)
- 参考:http://blog.csdn.net/Eastmount/article/details/73392106?fps=1&locationNum=5
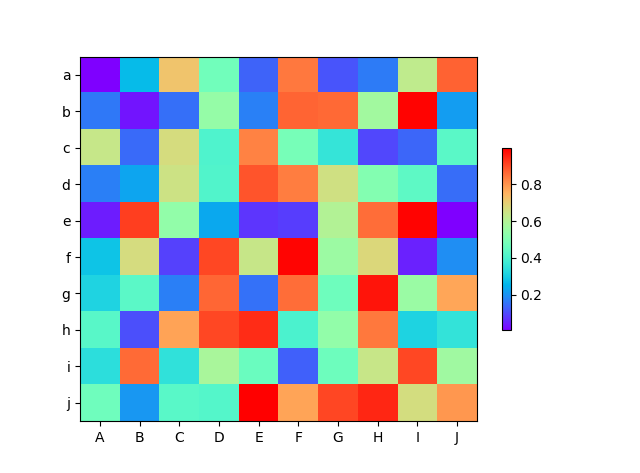
3.Heatmap热图绘制
import numpy as np

from matplotlib import pyplot as plt

from matplotlib import cm

from matplotlib import axes

def draw_heatmap(data,xlabels,ylabels):

    #cmap=cm.Blues

    cmap=cm.get_cmap('rainbow',1000)

    figure=plt.figure(facecolor='w')

    ax=figure.add_subplot(1,1,1,position=[0.1,0.15,0.8,0.8])

    ax.set_yticks(range(len(ylabels)))

    ax.set_yticklabels(ylabels)

    ax.set_xticks(range(len(xlabels)))

    ax.set_xticklabels(xlabels)

    map=ax.imshow(data,interpolation='nearest',cmap=cmap,aspect='auto',vmin=a.min(),vmax=a.max())

    cb=plt.colorbar(mappable=map,cax=None,ax=None,shrink=0.5)

    plt.show()

a=np.random.rand(10,10)

print(a)

xlabels=['A','B','C','D','E','F','G','H','I','J']

ylabels=['a','b','c','d','e','f','g','h','i','j']

draw_heatmap(a,xlabels,ylabels)
这里想把某块显示成一种颜色,则需要调用interpolation='nearest'参数即可
matplotlib热图的更多相关文章
- 基于matplotlib的数据可视化 - 热图imshow
热图: Display an image on the axes. 可以用来比较两个矩阵的相似程度 mp.imshow(z, cmap=颜色映射,origin=垂直轴向) imshow( X, cma ...
- Matplotlib学习---用matplotlib画热图(heatmap)
这里利用Nathan Yau所著的<鲜活的数据:数据可视化指南>一书中的数据,学习画图. 数据地址:http://datasets.flowingdata.com/ppg2008.csv ...
- python matplotlib imshow热图坐标替换/映射
今天遇到了这样一个问题,使用matplotlib绘制热图数组中横纵坐标自然是图片的像素排列顺序, 但是这样带来的问题就是画出来的x,y轴中坐标点的数据任然是x,y在数组中的下标, 实际中我们可能期望坐 ...
- Python图表数据可视化Seaborn:3. 线性关系数据| 时间线图表| 热图
1. 线性关系数据可视化 lmplot( ) import numpy as np import pandas as pd import matplotlib.pyplot as plt import ...
- 基于HTML5实现3D热图Heatmap应用
Heatmap热图通过众多数据点信息,汇聚成直观可视化颜色效果,热图已广泛被应用于气象预报.医疗成像.机房温度监控等行业,甚至应用于竞技体育领域的数据分析. http://www.hightopo.c ...
- 用Excel制作热图(heatmap)的方法
http://jingyan.baidu.com/article/64d05a0240ec75de55f73bd8.html 利用Excel 2010及以上版本的"条件格式"--& ...
- Heatmap.js v2.0 – 最强大的 Web 动态热图
Heatmap 是用来呈现一定区域内的统计度量,最常见的网站访问热力图就是以特殊高亮的形式显示访客热衷的页面区域和访客所在的地理区域的图示.Heatmap.js 这个 JavaScript 库可以实现 ...
- 基于HTML5实现的Heatmap热图3D应用
Heatmap热图通过众多数据点信息,汇聚成直观可视化颜色效果,热图已广泛被应用于气象预报.医疗成像.机房温度监控等行业,甚至应用于竞技体育领域的数据分析. 已有众多文章分享了生成Heatmap热图原 ...
- matplotlib 出图示例
如果你想要在Linxu中获得一个高效.自动化.高质量的科学画图的解决方案,应该考虑尝试下matplotlib库.Matplotlib是基于python的开源科学测绘包,基于python软件基金会许可证 ...
随机推荐
- std::vector 两种操作的比较
swap assign 这里只想说明这三种操作的用处和效率.swap和assign都可以用在将一个vector的内容全部复制给另外一个vector,区别是swap会改变源vector,而assign会 ...
- asm rebalance 原理
详见原文博客链接地址: asm rebalance 原理
- natapp搭建外网服务器
首先在natapp官网注册一个账号:https://natapp.cn/ 注册好后登陆网站,点击左侧菜单中的购买隧道: 点击免费隧道后进入隧道配置页面,我这里已经配置好了直接展示如下: 点击保存后点击 ...
- Android -- Camera源码简析,启动流程
com.android.camera.Camera.java,主要的实现Activity,继承于ActivityBase. ActivityBase 在ActivityBase中执行流程: onCre ...
- Android中操作SQLite数据库
我又回到了安卓的学习当中,忙来忙去终于忙的差不多有时间做自己的事情了,这感觉实在是太棒了!!本来想写android的控件以及他们的监视器的,但是我查了查android的手册,基本上都能查到,但是查有些 ...
- linux系统下调度数据库类型资源库中的kettle job
已经存在kettle的一个资源库enfo,在目录/works/wxj下面有一个job (testmailsuccess.kjb)如何实现手工在kettle外部执行此job和让系统每天定时的调用此job ...
- [Node.js] Level 3 new. Steam
File Read Stream Lets use the fs module to read a file and log its contents to the console. Use the ...
- 如何使用Ultraiso制作U盘启动盘
准备好可启动的ISO文件和足够容量的U盘.点击工具-写入硬盘镜像. 各种U盘启动模式简介 1.USB-HDD:硬盘仿真模式,DOS启动后显示C:盘,HP U盘格式化工具制作的U盘即采用此启动模式.此模 ...
- Objective-C中NSString与int和float的相互转换
NSString *tempA = @"123"; NSString *tempB = @"456"; 1,字符串拼接 NSString *newString ...
- WPF 同一个程序 只允许 同时运行一个
方法2 当程序已经运行了 再运行这个程序时,则显示当前这个窗体 http://code.3rbang.com/cshape-run-one/ VS2013附件:http://fil ...