fit in gnuplot
Table of Contents
1 fit-gnuplot
syntax
>> fit [xrange][yrange] function 'datafile' using modifier via paprameterfile
example:
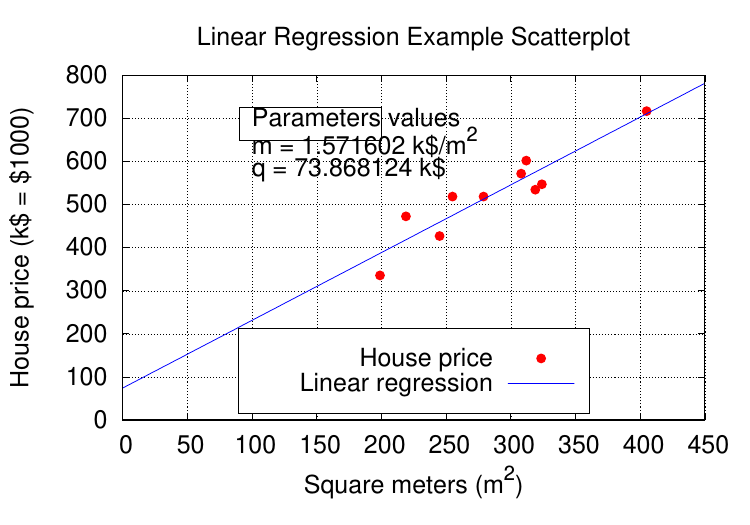
input: house_price.dat
###	'house_price.dat'

##	X-Axis:	House	price	(in	$1000)	-	Y-Axis:	Square	meters	(m^2)

245	426.72

312	601.68

279	518.16

308	571.5

199	335.28

219	472.44

405	716.28

324	546.76

319	534.34

255	518.16
gnuplot> # m, q will be our fitting parameters

gnuplot> f(x) = m*x + q

gnuplot> fit f(x) 'house_price.dat' using 1:2 via m, q

iter      chisq       delta/lim  lambda   m             q

   0 5.8376960560e+05   0.00e+00  2.07e+02    1.000000e+00   1.000000e+00

   1 1.6488461223e+04  -3.44e+06  2.07e+01    1.777346e+00   1.003262e+00

   2 1.5195558950e+04  -8.51e+03  2.07e+00    1.815976e+00   1.068562e+00

   3 1.4876544660e+04  -2.14e+03  2.07e-01    1.795915e+00   7.050054e+00

   4 1.3188280257e+04  -1.28e+04  2.07e-02    1.594141e+00   6.715403e+01

   5 1.3171060201e+04  -1.31e+02  2.07e-03    1.571627e+00   7.386063e+01

   6 1.3171060179e+04  -1.63e-04  2.07e-04    1.571602e+00   7.386812e+01

iter      chisq       delta/lim  lambda   m             q

After 6 iterations the fit converged.

final sum of squares of residuals : 13171.1

rel. change during last iteration : -1.62785e-09

degrees of freedom    (FIT_NDF)                        : 8

rms of residuals      (FIT_STDFIT) = sqrt(WSSR/ndf)    : 40.5756

variance of residuals (reduced chisquare) = WSSR/ndf   : 1646.38

Final set of parameters            Asymptotic Standard Error

=======================            ==========================

m               = 1.5716           +/- 0.2247       (14.3%)

q               = 73.8681          +/- 65.65        (88.87%)

correlation matrix of the fit parameters:

                m      q

m               1.000

q              -0.981  1.000
To save m, and q values in a string and plotting
set terminal postscript eps font 24

set out 'house_price_fit.eps'

mq_value = sprintf("Parameters values\nm = %f k$/m^2\nq = %f k$", m, q)

# \n -->> next line

set  title 'Linear Regression Example Scatterplot'

set  ylabel 'House price (k$ = $1000)'

set  xlabel 'Square meters (m^2)'

set  style line 1 ps 1.5 pt 7 lc 'red'

set  style line 2 lw 1.5 lc 'blue'

set grid

set key bottom center box height 1.4

set xrange [0:450]

set yrange [0:]

set object 1 rect from 90,725 to 200, 650 fc rgb "white"

set label 1 at 100,700 mq_value

print 'house_price.dat' ls 1 title 'House price', f(x) ls 2 title 'Linear regression'

set out
figures/gnuplot/fit/house_price_fit.pdf
fit in gnuplot的更多相关文章
- k fit in Park Model
software: Gnuplot input: area_averaged_axial_mean_velocity_TI_1.txt # One Rotor, front, eldad blade ...
- gnuplot: 一种更为简洁的曲线,柱状图绘图软件
gnuplot: 一种更为简洁的曲线,柱状图绘图软件 gnuplot: 一种更为简洁的曲线,柱状图绘图软件 Zhong Xiewei Wed Jun 25 gnuplot简单介绍 关于gnuplot的 ...
- u-boot FIT image介绍_转自“蜗窝科技”
转自:http://www.wowotech.net/u-boot/fit_image_overview.html 1. 前言 Linux kernel在ARM架构中引入设备树device tree( ...
- gnuplot使用,操作,保存等教程
gnuplot绘制图像并保存 对于在Linux下工作的人,如果你经常要画一些二维图和简单的三维图的话,那么,gnuplot无疑是一个非常好的选择,不仅图形漂亮,而且操作简单.当然如果需要质量更高的三维 ...
- gnuplot安装的小问题
今天在学习NS2的过程中接触到了awk和gnuplot来分析延迟,丢包等情况. gnuplot是一款非常精巧的绘图工具,使用方法也很简单,功能却很强大. 安装还是通过终端: sudo apt-get ...
- Modified Least Square Method and Ransan Method to Fit Circle from Data
In OpenCv, it only provide the function fitEllipse to fit Ellipse, but doesn't provide function to f ...
- gnuplot 的安装
需要同时安装gnuplot和gnuplot-x11才能画出图 sudo apt-get install gnuplot gnuplot-x11 gnuplot not showing the grap ...
- gnuplot conditional plotting: plot col A:col B if col C == x
http://stackoverflow.com/questions/6564561/gnuplot-conditional-plotting-plot-col-acol-b-if-col-c-x H ...
- gnuplot配置HOME目录
http://blog.csdn.net/jspenliany/article/details/39828261 本人使用gnuplot绘图,使用console version的来进行处理的时候,经常 ...
随机推荐
- ssh公私密钥的生成
ssh密钥的生成 root账号密钥的生成: 这里我们切换到root账号下,执行ssh-keygen命令: ssh-keygen -t dsa 然后一路回车即可 """ [ ...
- 1051:A × B problem 大数相乘
给你两个整数,请你计算A × B. 输入 数据的第一行是整数T(1 ≤ T ≤ 20),代表测试数据的组数.接着有T组数据,每组数据只有一行,包括两个非负整数A和B.但A和B非常大,Redraimen ...
- Helvetic Coding Contest 2017 online mirror (teams allowed, unrated) M
Description The marmots have prepared a very easy problem for this year's HC2 – this one. It involve ...
- JavaScript中简单排序总结
JavaScript中简单排序总结 冒泡排序 经典排序算法, 双重for循环 在第二个for循环的时候, j < arr.len -1 -i , 这一步的优化很重要 function bullS ...
- Spark MLlib编程API入门系列之特征选择之向量选择(VectorSlicer)
不多说,直接上干货! 特征选择里,常见的有:VectorSlicer(向量选择) RFormula(R模型公式) ChiSqSelector(卡方特征选择). VectorSlicer用于从原来的特征 ...
- Bootstrap中的datetimepicker浅谈
从古至今,人们都习惯用某个时间来标记某个事件的发生.我们在写管理后台的时候,重中之中也是这个时间的设置.在问题出现的时候,我们是查看日志的时候,就可以根据这个时间段来查找这个问题出现点. 在使用时间控 ...
- ImageView控件
ImageView 显示图片 常用属性: src 要显示的图片 foreground 前景图 backgrund 背景图 alpha 透明度 clickable 是否可以点击 onClick ...
- 2018微软实习笔试一道dp题目总结
题意大概是说在一维数轴上起点和终点的距离是d,现在我们要从起点走到终点.每走一个单位长度消耗一个单位能量,初始时有K单位能量.同时在起点和终点之间分布一些加油站a1,a2,...an,给你加油站数量. ...
- #pragma使用分析
#pragma简介 #pragma用于指示编译器完成一些特定的动作 #pragma所定义的很多指示字是编译器特有的 #pragma在不同的编译器间是不可移植的 预处理器将忽略它不认识的#pragma指 ...
- 教你如何配置WampServer
httpdconfig 搜索deny 268行 Deny 换成Allow 在本机cmd 搜索 ipconfig 找到 本机的ip 地址 239 行 DocumentRoot "e:/mywe ...