
Signalr Vue Echarts绘制实时CPU使用率
后端基于Asp.net webapi,前端Vue,前后端分离,该demo仅做演示,实现的细节可以自己优化
Echarts:4.2.1 可参考 官网
Jquery:3.4.1
Signalr:2.4.1 可参考 官网
Vue:2.5.2
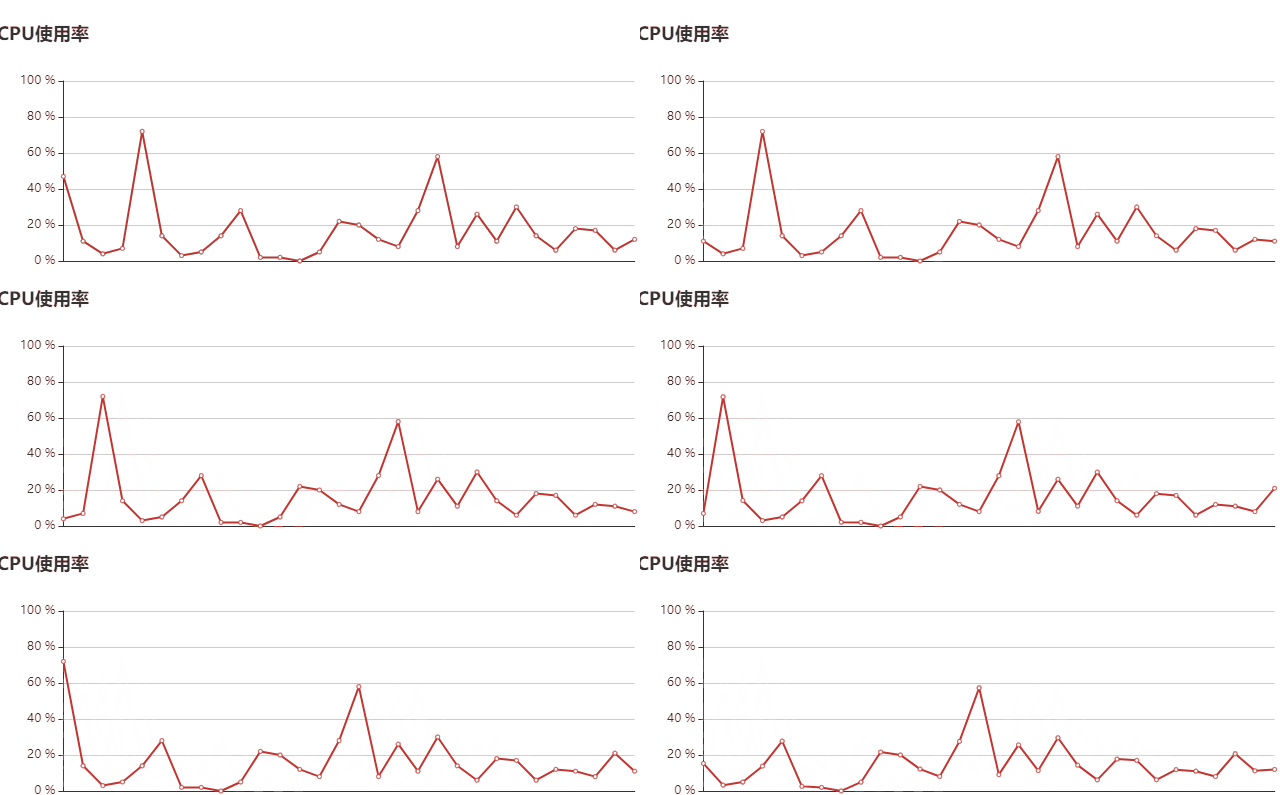
效果:
1.创建Web API项目
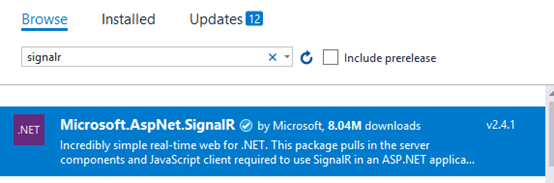
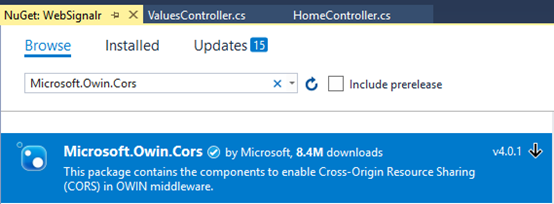
使用nuget导入signalr和Microsoft.Owin.Cors
2.在Hubs下创建Signalr hub class
    public class CPUHelper

    {

        public static string GetPercentProcessor()

        {

            ManagementObjectSearcher searcher = new ManagementObjectSearcher("select * from Win32_PerfFormattedData_PerfOS_Processor");

            var cpuTimes = searcher.Get()

                .Cast<ManagementObject>()

                .Select(mo => new

                {

                    Name = mo["Name"],

                    Usage = mo["PercentProcessorTime"]

                }

                )

                .ToList();

            var query = cpuTimes.Where(x => x.Name.ToString() == "_Total").Select(x => x.Usage);

            return query.SingleOrDefault().ToString();

        }

    }

    public class CpuHub : Hub

    {

        public void Notify()

        {

            var res = CPUHelper.GetPercentProcessor();

            Clients.All.getPercentProcessor(res);

        }

    }
3.在App_Start下创建Startup类
[assembly: OwinStartup(typeof(WebSignalr.App_Start.Startup))]

namespace WebSignalr.App_Start

{

    public class Startup

    {

        public void Configuration(IAppBuilder app)

        {

            // 允许跨域

            app.UseCors(CorsOptions.AllowAll);

            app.MapSignalR();

        }

    }

}
4.运行站点访问http://localhost:57577/signalr/hubs 可以看到自动生成的客户端代理js代码(端口号可能不一致)
5.创建vue项目,打开vscode,打开新建的项目文件夹,打开终端
运行 npm install -g vue-cli 初始化vue
运行 vue init webpack projectName 创建vue项目,完成后
运行 cd projectName 转到项目目录,执行 npm run dev 成功后访问 localhost:8080 预览
运行 npm install echarts -S 引入echats包
运行 npm i signalr jquery -S 引入Jquery 和 signalr
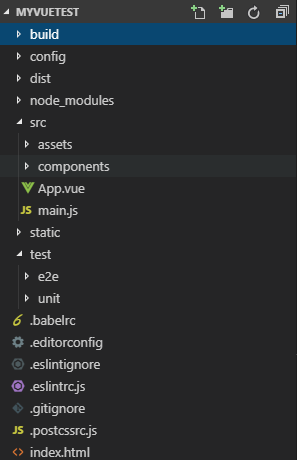
完成后结果如下
6.修改main.js如下
import Vue from 'vue'

import App from './App'

import echarts from 'echarts'

/* eslint-disable */

import $ from 'jquery'

import 'signalr'

Vue.config.productionTip = false

Vue.prototype.$echarts = echarts

/* eslint-disable no-new */

new Vue({

  el: '#app',

  components: { App },

  template: '<App/>'

})
7.在components文件夹下创建charts文件夹,并创建文件DynamicCharts.vue
<template>

  <div :id='id' :style='style'></div>

</template>

<script>

export default {

  name: 'Chart',

  data () {

    return {

      chart: ''

    };

  },

  props: {

    id: {

      type: String

    },

    width: {

      type: String,

      default: '100%'

    },

    height: {

      type: String,

      default: '300px'

    },

    option: {

      type: Object,

      default () {

        return {

          title: {

            text: 'test'

          },

          legend: {

            data: 'tag'

          },

          xAxis: {

            data: []

          },

          yAxis: [

            {

              type: 'value'

            }

          ],

          series: [

            {

              name: 'tag',

              type: 'line',

              data: []

            }

          ]

        };

      }

    }

  },

  computed: {

    style () {

      return {

        height: this.height,

        width: this.width

      };

    }

  },

  mounted () {

    this.init();

  },

  methods: {

    init () {

      window.addEventListener('resize', this.chart.resize);

      this.chart = this.$echarts.init(document.getElementById(this.id));

      this.chart.setOption(this.option);

    }

  },

  watch: {

    option: {

      handler: function (val, oldval) {

        if (this.chart) {

          if (val) {

            this.chart.setOption(val);

          } else {

            this.chart.setOption(oldval);

          }

        } else {

          this.init();

        }

      },

      deep: true

    }

  }

};

</script>
8.修改App.vue,引入Chart组件
<template>

  <div id='app'>

    <Chart id='test' :option='option'></Chart>

  </div>

</template>

<script>

import Chart from './components/charts/DynamicCharts';

export default {

  name: 'App',

  components: {

    Chart

  },

  data () {

    return {

      option: {

        title: {

          text: 'CPU使用率'

        },

        xAxis: [

          {

            type: 'category',

            boundaryGap: false,

            data: []

          }

        ],

        yAxis: [

          {

            type: 'value',

            max: 100,

            axisLabel: {

              formatter: '{value} %'

            }

          }

        ],

        series: [

          {

            type: 'line',

            data: []

          }

        ]

      }

    };

  },

  mounted () {

    console.log('init');

    this.init();

    this.connect();

  },

  methods: {

    init () {

      var signalR = $.signalR;

      var $this = this;

      $.hubConnection.prototype.createHubProxies = function () {

        var proxies = {};

        this.starting(function () {

          $this.registerHubProxies(proxies, true);

          this._registerSubscribedHubs();

        }).disconnected(function () {

          $this.registerHubProxies(proxies, false);

        });

        proxies['cpuHub'] = this.createHubProxy('cpuHub');

        proxies['cpuHub'].client = {};

        proxies['cpuHub'].server = {

          notify: function () {

            return proxies['cpuHub'].invoke.apply(

              proxies['cpuHub'],

              $.merge(['Notify'], $.makeArray(arguments))

            );

          }

        };

        return proxies;

      };

      signalR.hub = $.hubConnection('http://localhost: 57577/signalr', {

        useDefaultPath: false

      });

      $.extend(signalR, signalR.hub.createHubProxies());

    },

    initdata () {

      for (let i = 0; i < 60; i++) {

        this.option.series[0].data.push(this.rnd(30, 80));

      }

    },

    connect () {

      var cpu = $.connection.cpuHub;

      var that = this.option.series[0].data;

      cpu.client.getCPUPercent = (pers) => {

        if (that.length >= 30) {

          that.shift();

        }

        that.push(pers);

      };

      $.connection.hub.start().done(function () {

        window.setInterval(function () {

          cpu.server.send(20);

        }, 2000);

      });

    },

    rnd (n, m) {

      var random = Math.floor(Math.random() * (m - n + 1) + n);

      return random;

    },

    makeProxyCallback (hub, callback) {

      return function () {

        callback.apply(hub, $.makeArray(arguments));

      };

    },

    registerHubProxies (instance, shouldSubscribe) {

      var key, hub, memberKey, memberValue, subscriptionMethod;

      for (key in instance) {

        if (instance.hasOwnProperty(key)) {

          hub = instance[key];

          if (!hub.hubName) {

            // Not a client hub

            continue;

          }

          if (shouldSubscribe) {

            // We want to subscribe to the hub events

            subscriptionMethod = hub.on;

          } else {

            // We want to unsubscribe from the hub events

            subscriptionMethod = hub.off;

          }

          // Loop through all members on the hub and find client hub functions to subscribe/unsubscribe

          for (memberKey in hub.client) {

            if (hub.client.hasOwnProperty(memberKey)) {

              memberValue = hub.client[memberKey];

              if (!$.isFunction(memberValue)) {

                // Not a client hub function

                continue;

              }

              // Use the actual user-provided callback as the 'identity' value for the registration.

              subscriptionMethod.call(

                hub,

                memberKey,

                this.makeProxyCallback(hub, memberValue),

                memberValue

              );

            }

          }

        }

      }

    }

  }

};

</script>

<style>

#app {

  font-family: 'Avenir', Helvetica, Arial, sans-serif;

  -webkit-font-smoothing: antialiased;

  -moz-osx-font-smoothing: grayscale;

  text-align: center;

  color: #2c3e50;

  margin-top: 60px;

}

</style>
注:其中关于访问服务端signalr代码完全拷贝于第4步生成的js代码,仅仅需要修改hubConnection地址
最后在终端运行 npm run dev
本文地址:https://www.cnblogs.com/liuxiaobo93/p/11244762.html
如果遇到任何问题,欢迎留言讨论
Signalr Vue Echarts绘制实时CPU使用率的更多相关文章
- Linux性能优化从入门到实战:04 CPU篇:CPU使用率
CPU使用率是单位时间内CPU使用情况的统计,以百分比方式展示. $ top top - 11:46:45 up 7 days, 11:52, 1 user, load average: 0.00 ...
- 用ECharts绘制Prometheus图表,实现类似Grafana的自定义Dashboard
大家一般都是用Grafana自定义Dashboard来监控Prometheus数据的,作者这次尝试用ECharts来绘制Prometheus数据图表,一方面可以减少依赖,另一方面可以将监控界面灵活 ...
- 使用WPF动态显示CPU使用率
基于WPF的开源图表控件有很多,大多数都是静态图表,如果需要绘制CPU使用率这样的动态数据就显得力不从心,微软开源的DynamicDataDisplay控件弥补了这个不足,为了做个备忘,我用它来实时绘 ...
- WPF 动态模拟CPU 使用率曲线图
原文:WPF 动态模拟CPU 使用率曲线图 在工作中经常会遇到需要将一组数据绘制成曲线图的情况,最简单的方法是将数据导入Excel,然后使用绘图功能手动生成曲线图.但是如果基础数据频繁更改, ...
- CPU使用率终于正常了——记一次订餐系统事故处理
引子 经过漫长的等待,儿子终于出生了.欣喜之余,就是各种手足无措,顾此失彼了.因为不懂,心里总是慌慌的,有点小毛病,恨不得一步就到医院. 婆媳育儿观念的差异,让心乱如麻的我,又成了风箱里的老鼠,两个不 ...
- Linux平台Cpu使用率的计算
proc文件系统 /proc文件系统是一个伪文件系统,它只存在内存当中,而不占用外存空间.它以文件系统的方式为内核与进程提供通信的接口.用户和应用程序可以通过/proc得到系统的信息,并可以改变内核的 ...
- CPU使用率
CPU使用率 事故回放 当时的情况是那个样子的: 1,正值饭点,客户电话说系统慢,几乎无法完成订单调度,有时还显示内存不足.当时心里的第一个声音就是,服务器配置太低了,远程一看,2核4G内存,cpu平 ...
- 查看uCOS-II的CPU使用率
代码模板: void main(void) { OSInit(); /* 安装uCOS-II的任务切换向量 */ /* 创建用户起始任务TaskStart */ OSStart(); } void T ...
- 查看线程linux cpu使用率
Linux下如何查看高CPU占用率线程 LINUX CPU利用率计算 转 http://www.cnblogs.com/lidabo/p/4738113.html目录(?)[-] proc文件系统 p ...
随机推荐
- vue实现购物清单列表添加删除
vue实现购物清单列表添加删除 一.总结 一句话总结: 基础的v-model操作,以及数组的添加(push)删除(splice)操作 1.checkbox可以绑定数组,也可以直接绑定值? 绑定数组就是 ...
- Hearthstone AI
search keyword `machine learning hearthstone` with google I am a legend: Hacking Hearthstone with ma ...
- vue问题五:element ui组件的开始时间-结束时间验证
<el-date-picker v-model="seach.before" type="date" placeholder="开始时间&quo ...
- JDBC的工具类
A: 抽取两个方法,一个获取Connection对象,一个是释放资源 import java.io.FileReader; import java.sql.Connection; import jav ...
- pandas总结
### 一.创建对象 # 1.可以通过传递一个list对象来创建一个Series,pandas会默认创建整型索引: # s=pd.Series([1,3,5,np.nan,6,8]) # print ...
- 修改ssh端口
centos7.5修改默认SSH端口 linux SSH默认端口是22,不修改的话存在一定的风险,要么是被人恶意扫描,要么会被人破解或者攻击,所以我们需要修改默认的SSH端口 1.修改22端口为620 ...
- 在linux下php挂接mysql.so扩展的方法
第一步:进入php源码中的"ext/mysql"目录下命令:cd 第二步:在当前目录下运行phpize 命令:/usr/local/php524/bin/phpize phpize ...
- PHP中include、require、include_once、require_once的区别
include:使用include引用外部文件时,只有代码执行到include代码段时,调用的外部文件才会被引用并读取,当引用的文件发生错误时,系统只会给出个警告错误,而整个php文件会继续执行.re ...
- django 之(四) --- 级联|截流
登陆注册 登陆注册实现 settings.py # redis配置 CACHES = { "default": { "BACKEND": "djang ...
- JAVA数据结构和算法 3-简单排序
排序中的两种基本操作是比较和交换.在插入排序中还有移动. 冒泡排序:两两比较相邻元素,如果较大数位于较小数前面,则交换: 每一趟遍历将一个最大的数移到序列末尾,共遍历N-1趟. 如果执行完一趟之后没有 ...