WPF 动态模拟CPU 使用率曲线图
在工作中经常会遇到需要将一组数据绘制成曲线图的情况,最简单的方法是将数据导入Excel,然后使用绘图功能手动生成曲线图。但是如果基础数据频繁更改,则手动创建图形可能会变得枯燥乏味。本篇将利用DynamicDataDisplay 在WPF 中动态模拟CPU 使用率图表,实现动态生成曲线图。
新建项目将DynamicDataDisplay.dll 加载到References 中,打开MainWindow.xaml 添加命名空间xmlns:d3="http://research.microsoft.com/DynamicDataDisplay/1.0"。通过<d3:ChartPlotter> 创建一个图表框架,在其中添加两条整型坐标轴,X轴:<d3:HorizontalIntegerAxis>,Y轴:<d3:VerticalIntegerAxis>。<d3:Header> 用来设置图表名称,<d3:VerticalAxisTitle> 用来设置Y轴名称。
<Window x:Class="WpfPerformance.MainWindow"

        xmlns="http://schemas.microsoft.com/winfx/2006/xaml/presentation"

        xmlns:x="http://schemas.microsoft.com/winfx/2006/xaml"

        xmlns:d3="http://research.microsoft.com/DynamicDataDisplay/1.0"

        Title="CPU Performance" Loaded="Window_Loaded" Height="350" Width="525">

    <Grid>

        <Grid.RowDefinitions>

            <RowDefinition Height="Auto"/>

            <RowDefinition Height="*"/>

        </Grid.RowDefinitions>

        <StackPanel Orientation="Horizontal">

            <TextBlock Text="CPU Usage" Margin="20,10,0,0"

                       FontSize="15" FontWeight="Bold"/>

            <TextBlock x:Name="cpuUsageText" Margin="10,10,0,0"

                       FontSize="15"/>

        </StackPanel>

        <d3:ChartPlotter x:Name="plotter" Margin="10,10,20,10" Grid.Row="1">

            <d3:ChartPlotter.VerticalAxis>

                <d3:VerticalIntegerAxis />

            </d3:ChartPlotter.VerticalAxis>

            <d3:ChartPlotter.HorizontalAxis>

                <d3:HorizontalIntegerAxis />

            </d3:ChartPlotter.HorizontalAxis>

            <d3:Header Content="CPU Performance History"/>

            <d3:VerticalAxisTitle Content="Percentage"/>

        </d3:ChartPlotter>

    </Grid>

</Window>

接下来工作需要通过C#每秒获取一次CPU使用率,并将这些数据生成坐标点(Point)绘制在图表中。 以下是MainWindow.xaml.cs 部分的代码内容。
using System;

using System.Diagnostics;

using System.Windows;

using System.Windows.Media;

using System.Windows.Threading;

using Microsoft.Research.DynamicDataDisplay;

using Microsoft.Research.DynamicDataDisplay.DataSources;

namespace WpfPerformance

{

    public partial class MainWindow : Window

    {

        private ObservableDataSource<Point> dataSource = new ObservableDataSource<Point>();

        private PerformanceCounter cpuPerformance = new PerformanceCounter();

        private DispatcherTimer timer = new DispatcherTimer();

        private int i = 0;

        public MainWindow()

        {

            InitializeComponent();

        }

        private void AnimatedPlot(object sender, EventArgs e)

        {

            cpuPerformance.CategoryName = "Processor";

            cpuPerformance.CounterName = "% Processor Time";

            cpuPerformance.InstanceName = "_Total";

            double x = i;

            double y = cpuPerformance.NextValue();

            Point point = new Point(x, y);

            dataSource.AppendAsync(base.Dispatcher, point);

            cpuUsageText.Text = String.Format("{0:0}%", y);

            i++;

        }

        private void Window_Loaded(object sender, RoutedEventArgs e)

        {

            plotter.AddLineGraph(dataSource, Colors.Green, 2, "Percentage");

            timer.Interval = TimeSpan.FromSeconds(1);

            timer.Tick += new EventHandler(AnimatedPlot);

            timer.IsEnabled = true;

            plotter.Viewport.FitToView();

        }

    }

}
通过ObservableDataSource<Point> 动态存储图表坐标点,PerformanceCounter 获取CPU使用率数值,DispatcherTimer 计时器在规定间隔进行取数操作,整型i 作为CPU使用率坐标点的X轴数值。
private ObservableDataSource<Point> dataSource = new ObservableDataSource<Point>();

private PerformanceCounter cpuPerformance = new PerformanceCounter();

private DispatcherTimer timer = new DispatcherTimer();

private int i = 0;
AnimatedPlot 事件用于构造坐标点,通过设置cpuPerformance 相关参数,并使用NextValue() 方法获取当前CPU使用率数据作为Y值,整型i 作为X值。将X、Y值构造为坐标点(Point),并通过异步方式存储在dataSource 中。
private void AnimatedPlot(object sender, EventArgs e)

{

    cpuPerformance.CategoryName = "Processor";

    cpuPerformance.CounterName = "% Processor Time";

    cpuPerformance.InstanceName = "_Total";

    double x = i;

    double y = cpuPerformance.NextValue();

    Point point = new Point(x, y);

    dataSource.AppendAsync(base.Dispatcher, point);

    cpuUsageText.Text = String.Format("{0:0}%", y);

    i++;

}
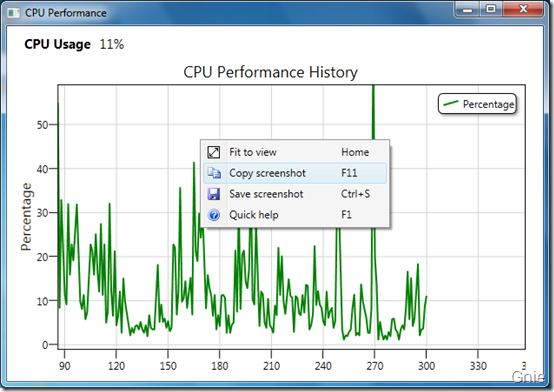
最后通过Window_Loaded 将事件加载到<Window> 中,AddLineGraph 方法将dataSource 中的坐标点绘制到图表中,曲线颜色定义为绿色,粗细设置为2,曲线名称为"Percentage"。设置计时器间隔为1秒,连续执行AnimatedPlot 事件实时绘制新坐标点。
private void Window_Loaded(object sender, RoutedEventArgs e)

{

    plotter.AddLineGraph(dataSource, Colors.Green, 2, "Percentage");

    timer.Interval = TimeSpan.FromSeconds(1);

    timer.Tick += new EventHandler(AnimatedPlot);

    timer.IsEnabled = true;

    plotter.Viewport.FitToView();

}

鼠标右键可将图表拷贝到其他文档:
动态演示
鼠标左键拖动图表浏览任意位置曲线数据,鼠标中键可以缩放显示曲线图。
源代码下载
WPF 动态模拟CPU 使用率曲线图的更多相关文章
- 模拟Windows任务管理器CPU使用率的动态折线图-农夫山泉
Delphi的TCanvas类可以实现各种复杂的图形输出功能,基于近期项目的需求,利用它实现了一个很炫的动态折线图(模拟了资源管理器中CPU使用率的折线图),可以直观地展现出数值的实时变化情况. 这段 ...
- 使用WPF动态显示CPU使用率
基于WPF的开源图表控件有很多,大多数都是静态图表,如果需要绘制CPU使用率这样的动态数据就显得力不从心,微软开源的DynamicDataDisplay控件弥补了这个不足,为了做个备忘,我用它来实时绘 ...
- 关于linux系统CPU篇--->CPU使用率升高
1.CPU使用率为单位时间内CPU使用情况的统计,以百分比的方式展示. LINUX作为一个多任务操作系统,将每个CPU的时间划分为很短的时间片,再通过调度器轮流分配给各个任务使用,因此造成多任务同时运 ...
- 05 | 基础篇:某个应用的CPU使用率居然达到100%,我该怎么办?
通过前两节对平均负载和 CPU 上下文切换的学习,我相信你对 CPU 的性能已经有了初步了解.不过我还是想问一下,在学这个专栏前,你最常用什么指标来描述系统的 CPU 性能呢?我想你的答案,可能不是平 ...
- 某个应用的CPU使用率居然达到100%,我该怎么做?(三)
某个应用的CPU使用率居然达到100%,我该怎么做?(三) 1. 引 你们好,可爱的小伙伴们^_^! 咱们最常用什么指标来描述系统的CPU性能呢?我想你的答案,可能不是平均负载,也不是CPU上下文切换 ...
- 性能分析(3)- 短时进程导致用户 CPU 使用率过高案例
性能分析小案例系列,可以通过下面链接查看哦 https://www.cnblogs.com/poloyy/category/1814570.html 系统架构背景 VM1:用作 Web 服务器,来模拟 ...
- 性能分析(5)- 软中断导致 CPU 使用率过高的案例
性能分析小案例系列,可以通过下面链接查看哦 https://www.cnblogs.com/poloyy/category/1814570.html 前言 软中断基本原理,可参考这篇博客:https: ...
- 使用mysqlslap对mysql进行压测,观察Azure虚拟机cpu使用率
一直想做这个测试,原因很简单,很多人一直比较怀疑Azure的虚拟机性能,说相同的配置凭啥比阿里的虚拟机贵那么多,其实,我自己以前也怀疑过,但是接触Azure的几个月,确实发现Azure的虚拟机性能真的 ...
- 转载 - LINUX下查看CPU使用率的命令
几个常用的命令,一些不错的解释 http://blog.csdn.net/wengpingbo/article/details/6302058 1.top 使用权限:所有使用者 使用方式:top [- ...
随机推荐
- How to use ftp in a shell script
转载How to use ftp in a shell script How to use ftp in a shell script Bruce EdigerBruce Ediger's home ...
- [Docker] Prune Old Unused Docker Containers and Images
In this lesson, we will look at docker container prune to remove old docker containers. We can also ...
- hdu5389 Zero Escape
Problem Description Zero Escape, is a visual novel adventure video game directed by Kotaro Uchikoshi ...
- 解决“不是有效的win32应用程序”问题
http://blog.csdn.net/shuaihj/article/details/17096903
- 微信公众号开发之怎样将本机IP映射成外网域名
近期一个项目须要用到微信公众号的网页授权登录,在研究这个公众号的时候遇到各种困难,现将自己的一些心得总结一下. 我想进行微信公众号开发遇到的第一个困难就是微信公众号必须输入一个外网能够訪问的域名,在网 ...
- C++生成GIF小结
声明:所有权利保留. 转载必须说明出处:http://blog.csdn.net/cartzhang/article/details/44020175 近来需要把BMP或Kinect的内存图片多张合成 ...
- Oracle中的sid与servicename
在平时自己创建库的时候,习惯的将sid与servicename取同名,但是在实际生产中这两个名字很有可能不一致,再使用jdbc连接数据库的url时就需要注意区分了,否则创建不了数据库连接 //serv ...
- Role-based access control modeling and auditing system
A role-based access control (RBAC) modeling and auditing system is described that enables a user to ...
- 过滤Filter推断用户是否登录
WEB.XML <!-- 用户session的 键 sessionKEY --> <context-param> <param-name>userSessionKe ...
- hexo主题选择和配置
之前用next主题,发现文章标题都是h2,不利于seo,想着通过改模板改成h1的,发现很繁琐.今天发现,通过下载指定版本的next后,标题自动是h1的. 参考网页https://notes.iissn ...