VS2017 编译 Visual Leak Detector + VLD 使用示例
起因
一个Qt5+VS2017的工程,需要进行串口操作,在自动时发现一段时间软件崩溃了,没有保存log,在 debug 的时候发现每运行一次应用占据的内存就多一点,后来意识到是内存泄漏了。这个真是头疼,变量太多,不知道从哪里查找内存泄漏好。于是迫切的需要找到一种追查内存泄漏的工具。
一开始很自然的是vs2017 debug查看内存占用情况,采用的就是这个博文 https://blog.csdn.net/luoyu510183/article/details/84728664的思路,然而太麻烦了,放弃。后来无意中发现 Visual Leak Detector 这个工具,简直完美了。
VLD 简介
官网介绍说 VLD 时一个免费的、健壮的、开源的针对 Visual C++ 的内存泄漏检测系统。
使用方式非常简单,在安装之后,只需要告诉 Visual C++ 头文件路径和库文件。只需要在源文件中添加一行代码即可使用 #include <vld.h>.
在 Visual Studio debugger 运行的时候, VLD 会在 debug 会话结束之后把检测报告打印到输出窗口。内存泄漏报告包括完整的调用堆栈显示内存库是如何分配的。双击调用堆栈上的行号即可以跳转到编辑器对应的文件行。
Visual Leak Detector 官网地址 https://archive.codeplex.com/?p=vld,它已经迁移到了 github 。
VS2017编译VLD
不凑巧的是官网更新到2015年,支持vs2015,所以只能从源码开始编译 vld 了。可以从官网或者 github 下载源码。
解决编译问题
前面说了源码只支持 vs2015,用 vs2017 一打开就出现了问题,源码最高支持 vs2015 编译器,如下图所示:
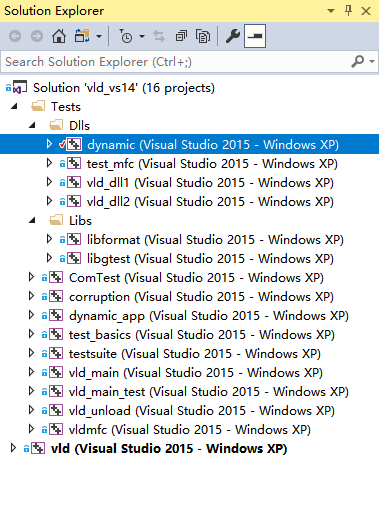
支持vs2017编译器
上面的这个问题,一般只需要重新定位编译器即可,鼠标右键 "dynamic" 目标在弹出的选项中选择 "Retarget Projects",虽然 输出窗口显示操作成功了,但是实际并没有。

这是因为平台工具集不对,需要手动修改每一编译目标的平台工具集,这里以 dynamic 编译目标为例,修改它的属性,如下图所示:
在 General-->Platform Toolset 中重新选择,如果有多个选择,请选择一个合适的工具集,这里选择 Visual Studio 2017 (v141)。(其他的编译目标执行一样的操作。)

变更为 x64 工程
在编译之前需要把 "win32" 改成 "x64",因为我的电脑是64位的,应用环境也是64位的。然后 Build Solution。然后就出现了 “Windows SDK 8.1” error。
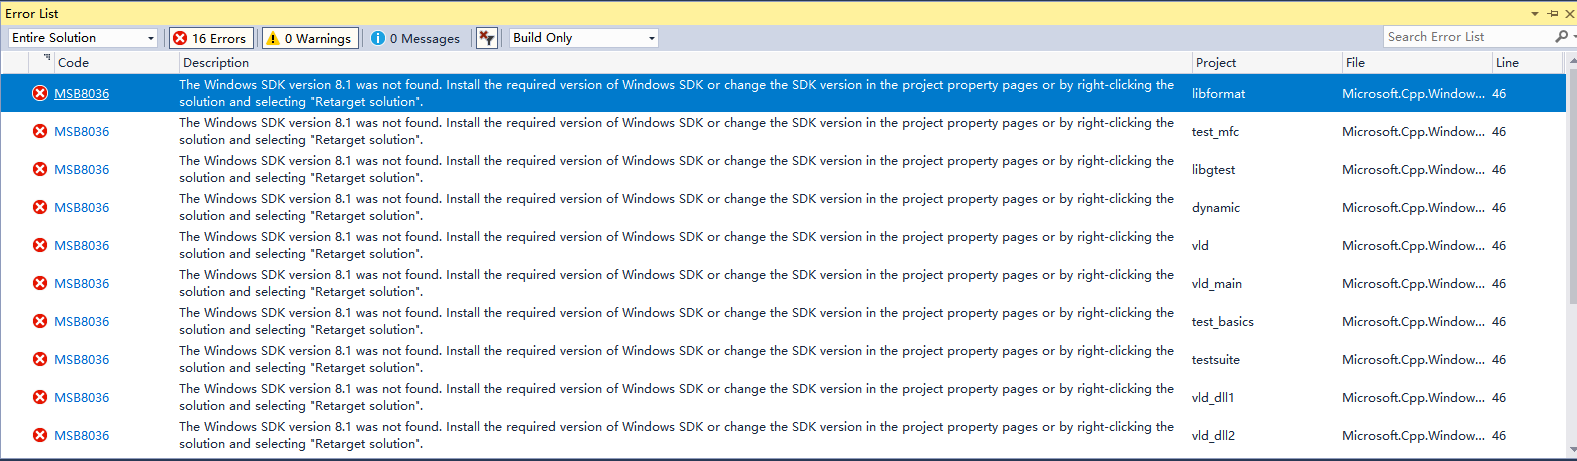
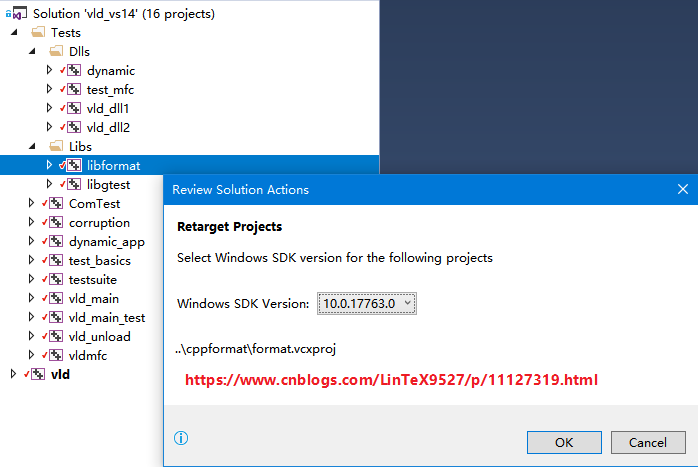
按照提示,选择 Retarget Projects 然后选择最先的SDK版本,然后对其他的编译目标执行相同的操作。
定义宏 _SILENCE_TR1_NAMESPACE_DEPRECATION_WARNING
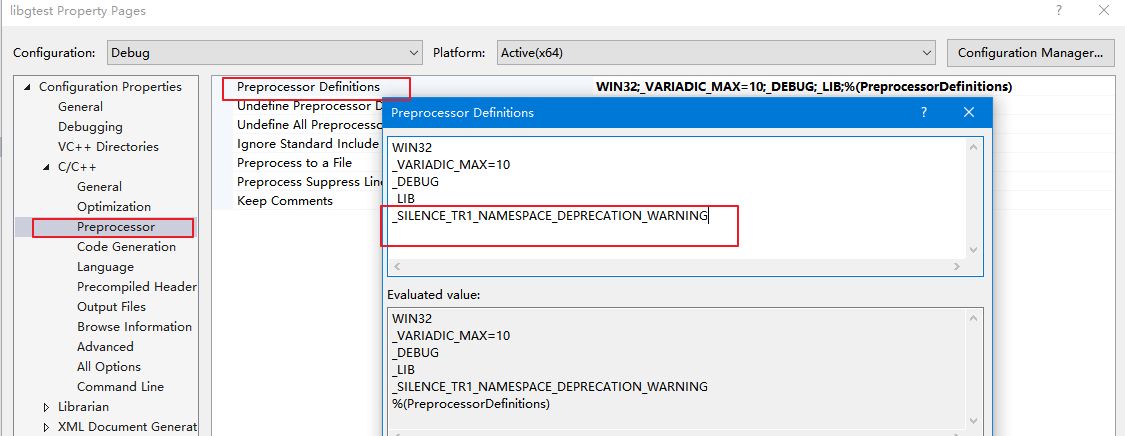
编译,又出幺蛾子了,提示 _SILENCE_TR1_NAMESPACE_DEPRECATION_WARNING 定义这个宏可以避免错误,所以需要执行如下的操作:
打开工程 libgtest 的属性设置界面,C++-->Precoessor-->Processor Definitions 中添加一个宏定义: _SILENCE_TR1_NAMESPACE_DEPRECATION_WARNING
对其他的编译目标执行相同的操作,然后编译。
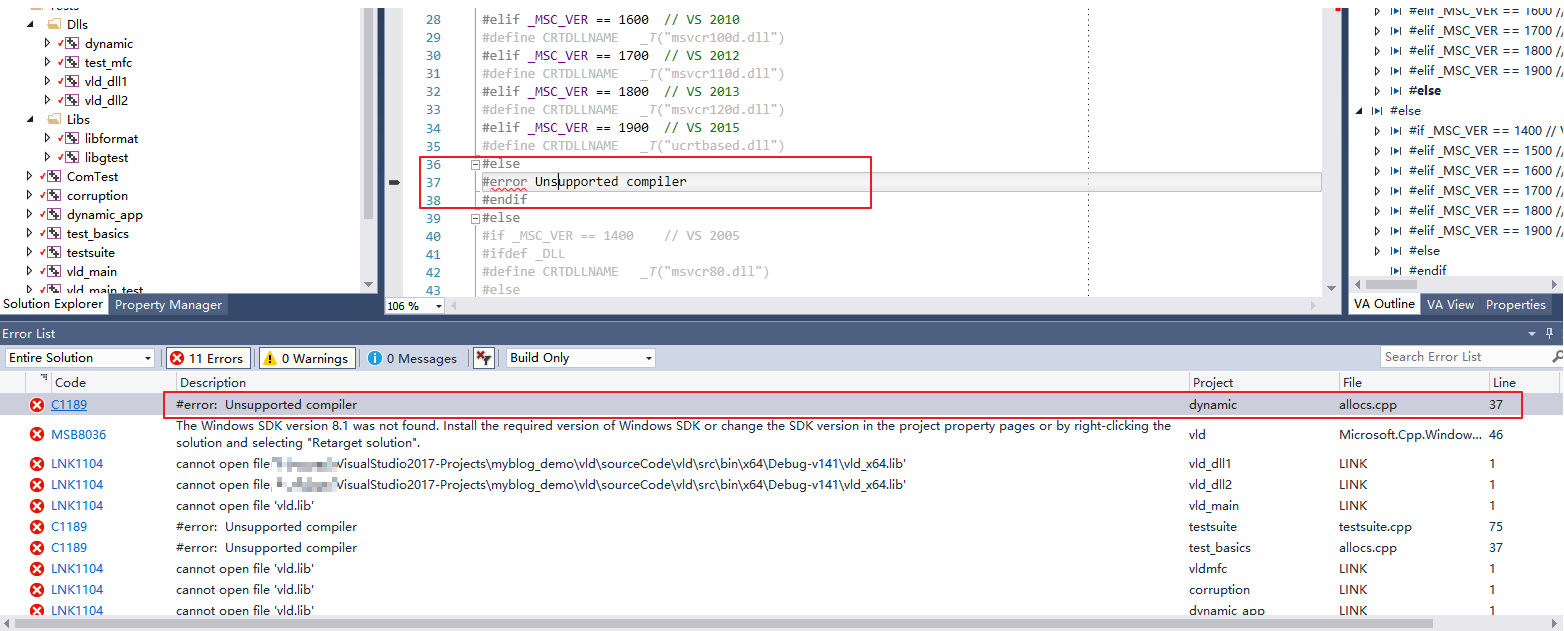
Unsupported compiler
执行上面的操作之后编译提示 Unsupported compiler,双击这个提示跳转到源码 allocs.cpp 第37行,跳到 _MSC_VER 定义的地方一看,原来 vs 2017 的版本是 1916,同时搜索一下本地电脑上 Microsoft SDK 是否包含 ucrtbased.dll 或者 msvcr120d.dll,经过查找 VS2017 确实包含的是 ucrtbased.dll,新的定义如下:
#elif _MSC_VER == 1800	// VS 2013

#define CRTDLLNAME   _T("msvcr120d.dll")

#elif _MSC_VER == 1900	// VS 2015

#define CRTDLLNAME   _T("ucrtbased.dll")

#elif _MSC_VER == 1916	// VS 2017

#define CRTDLLNAME   _T("ucrtbased.dll")

#else

#error Unsupported compiler

#endif
其他的编译目标出现相同的问题,采用相同的解决方法。
Not supported VS
上一步编译之后提示如下,跳转到对应的源文件 vld.cpp 第 976 行:
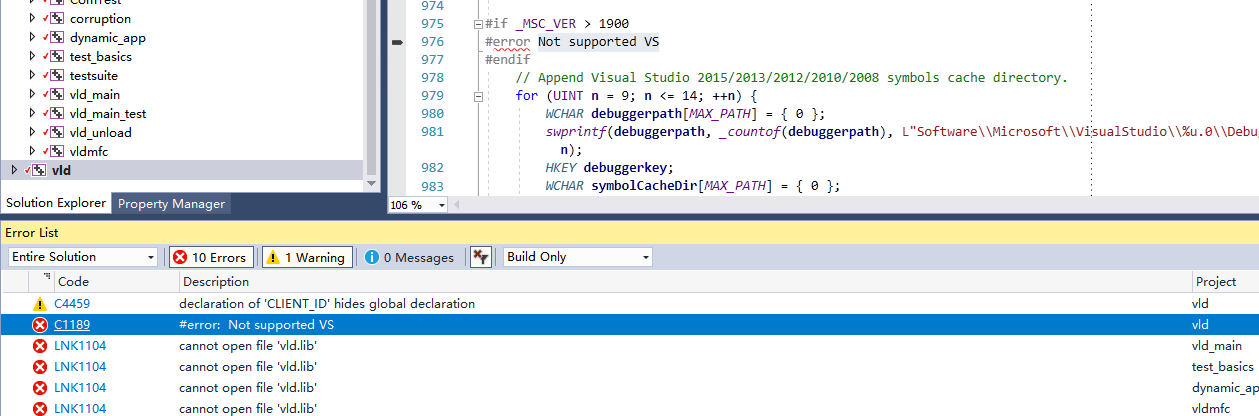
很明显这是因为 vs2017 对应的版本号是 1916,所以修改为 _MSC_VER > 1916 即可。
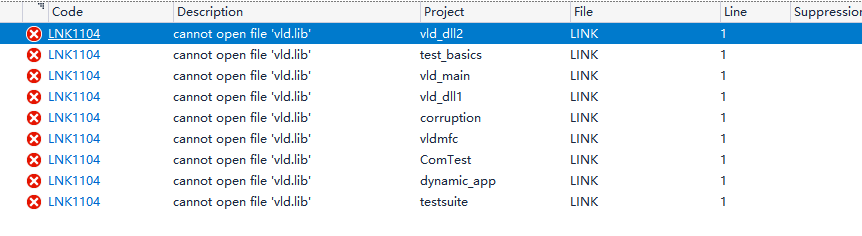
cannot open file vld.lib
上一步编译之后提示找不到库文件 vld.lib
例如这个工程编译产生 lib 文件夹内容如下:
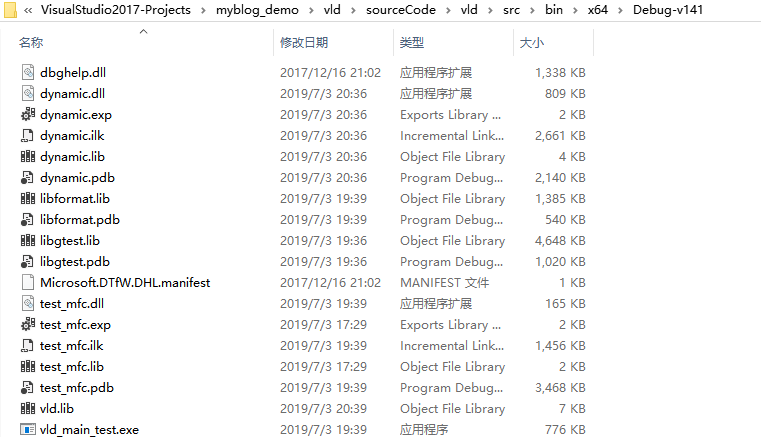
需要向报错的工程中添加库文件路径和库文件,但是这么多编译目标,一个一个设置库文件路径和库文件名,烦都烦死了,所以新建一个 property sheet,然后每一个工程添加这个属性就可以了。
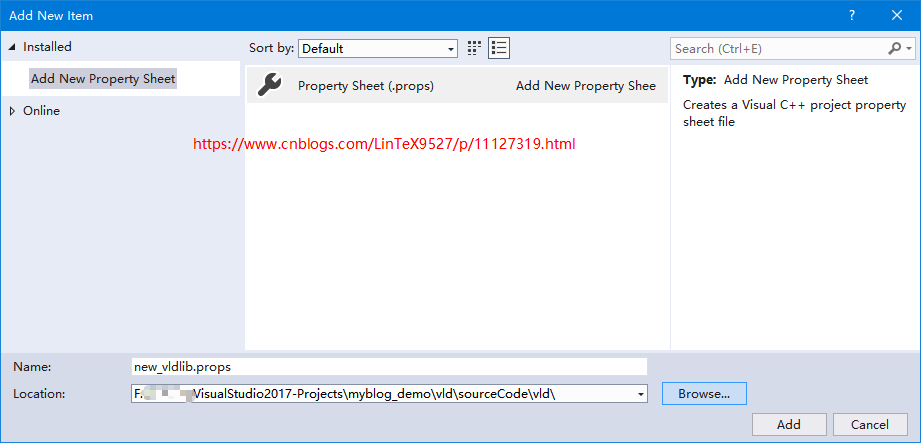
新建的 property sheet 内容如下
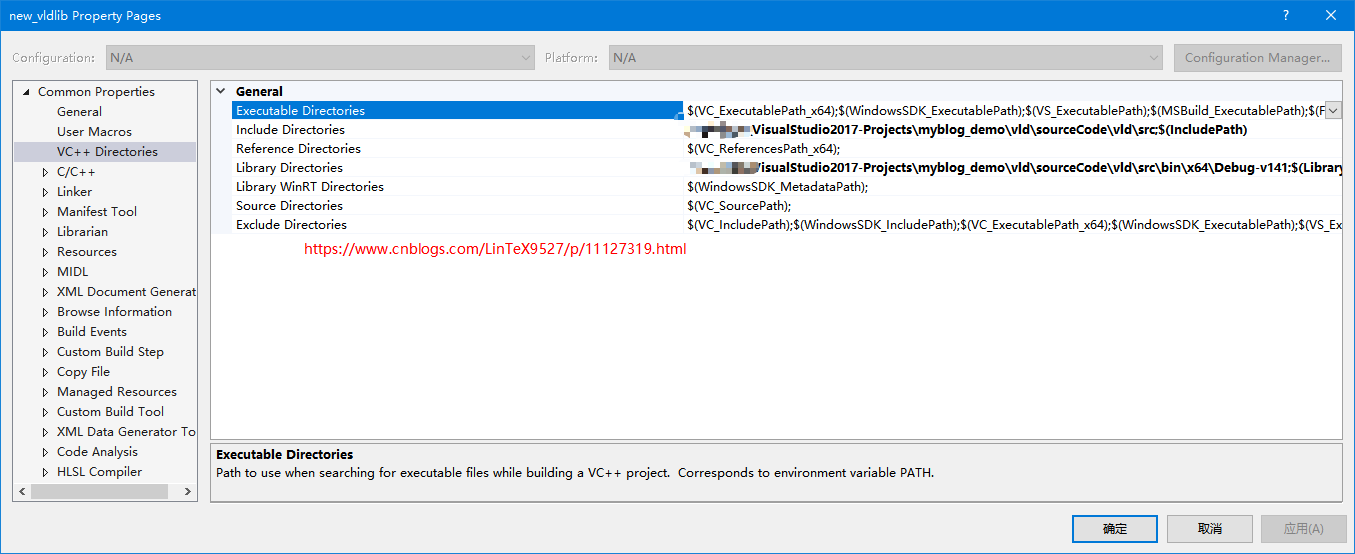
每一个找不到 vld.lib 的编译项目都添加这个属性就可以了。
编译通过
========== Rebuild All: 16 succeeded, 0 failed, 0 skipped ==========
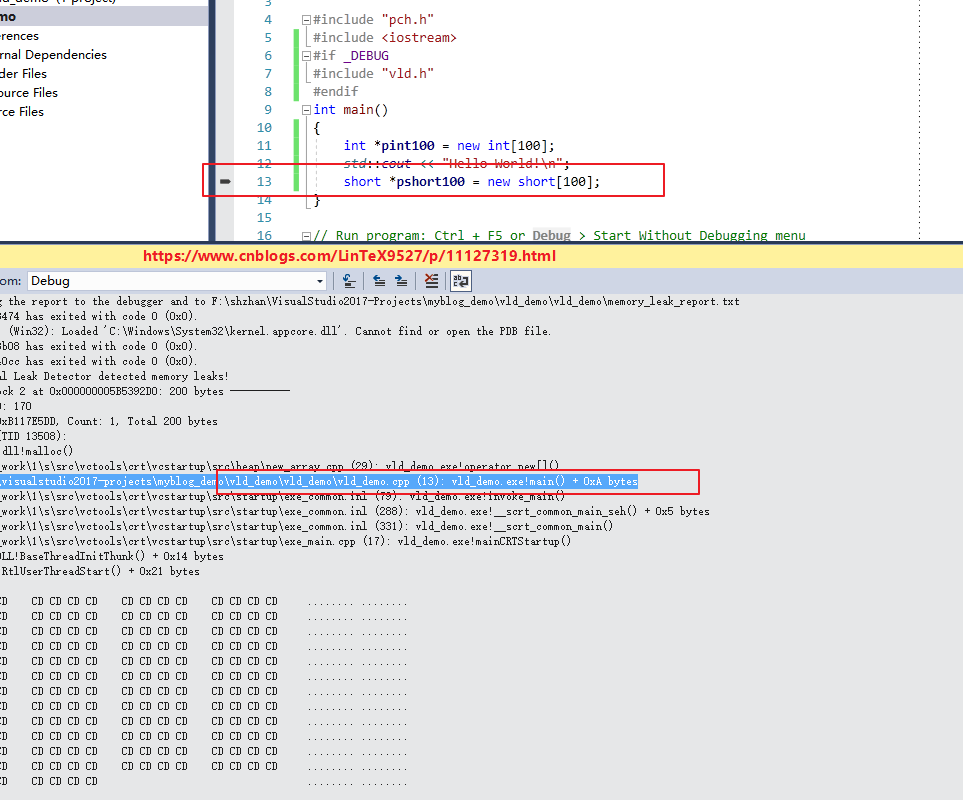
VLD 最简单示例
一个最简单的示例,代码如下:
#include "pch.h"

#include <iostream>

#if _DEBUG

#include "vld.h"

#endif

int main()

{

    int *pint100 = new int[100];

    std::cout << "Hello World!\n";

    short *pshort100 = new short[100];

}
在编译之前需要确保是 Debug, x64,并且把上面的 property sheet 拷贝到当前目录,并且添加到这个工程中,编译运行,弹出了“无法找到 vld_x64.dll ”的错误,简单,拷贝上面的工程产生的 vld_x64.dll到这个工程的 Debug 目录,重新启动调试,又出幺蛾子了。

无法启动, 0xc0150002
解决方法参见这篇博文 https://blog.csdn.net/u012248603/article/details/52639578,
只需要把 vld 工程生成目录中的两个文件 dbghelp.dll 和 Microsoft.DTfW.DHL.manifest 拷贝到这个工程的 debug 目录即可。当然还需要把配置文件 vld.ini 拷贝到这个目录,并做修改,最后附上这个配置文件内容。
VLD不显示行号
参见这个博文 https://blog.csdn.net/fwb330198372/article/details/84253292
需要修改设置选项, Linker-->debugging-->"Generate Debug Info" 设置为 /Debug:FULL 即可。
以下就是这个工程的VLD追踪内存泄漏的截图:
vld.ini 配置文件
;;;;;;;;;;;;;;;;;;;;;;;;;;;;;;;;;;;;;;;;;;;;;;;;;;;;;;;;;;;;;;;;;;;;;;;;;;;;;;;;

;;

;;  Visual Leak Detector - Initialization/Configuration File

;;  Copyright (c) 2005-2017 VLD Team

;;

;;  This library is free software; you can redistribute it and/or

;;  modify it under the terms of the GNU Lesser General Public

;;  License as published by the Free Software Foundation; either

;;  version 2.1 of the License, or (at your option) any later version.

;;

;;  This library is distributed in the hope that it will be useful,

;;  but WITHOUT ANY WARRANTY; without even the implied warranty of

;;  MERCHANTABILITY or FITNESS FOR A PARTICULAR PURPOSE.  See the GNU

;;  Lesser General Public License for more details.

;;

;;  You should have received a copy of the GNU Lesser General Public

;;  License along with this library; if not, write to the Free Software

;;  Foundation, Inc., 51 Franklin St, Fifth Floor, Boston, MA  02110-1301  USA

;;

;;  See COPYING.txt for the full terms of the GNU Lesser General Public License.

;;

;;;;;;;;;;;;;;;;;;;;;;;;;;;;;;;;;;;;;;;;;;;;;;;;;;;;;;;;;;;;;;;;;;;;;;;;;;;;;;;;

; Any options left blank or not present will revert to their default values.

[Options]

; The main on/off switch. If off, Visual Leak Detector will be completely

; disabled. It will do nothing but print a message to the debugger indicating

; that it has been turned off.

;

;  Valid Values: on, off

;  Default: on

;

VLD = on

; If yes, duplicate leaks (those that are identical) are not shown individually.

; Only the first such leak is shown, along with a number indicating the total

; number of duplicate leaks.

;

;   Valid Values: yes, no

;   Default: no

;

AggregateDuplicates = yes

; Lists any additional modules to be included in memory leak detection. This can

; be useful for checking for memory leaks in debug builds of 3rd party modules

; which can not be easily rebuilt with '#include "vld.h"'. This option should be

; used only if absolutely necessary and only if you really know what you are

; doing.

;

;   CAUTION: Avoid listing any modules that link with the release CRT libraries.

;     Only modules that link with the debug CRT libraries should be listed here.

;     Doing otherwise might result in false memory leak reports or even crashes.

;

;   Valid Values: Any list containing module names (i.e. names of EXEs or DLLs)

;   Default: None.

;

ForceIncludeModules =

; Maximum number of data bytes to display for each leaked block. If zero, then

; the data dump is completely suppressed and only call stacks are shown.

; Limiting this to a low number can be useful if any of the leaked blocks are

; very large and cause unnecessary clutter in the memory leak report.

;

;   Value Values: 0 - 4294967295

;   Default: 256

;

MaxDataDump =

; Maximum number of call stack frames to trace back during leak detection.

; Limiting this to a low number can reduce the CPU utilization overhead imposed

; by memory leak detection, especially when using the slower "safe" stack

; walking method (see StackWalkMethod below).

;

;   Valid Values: 1 - 4294967295

;   Default: 64

;

MaxTraceFrames =

; Sets the type of encoding to use for the generated memory leak report. This

; option is really only useful in conjuction with sending the report to a file.

; Sending a Unicode encoded report to the debugger is not useful because the

; debugger cannot display Unicode characters. Using Unicode encoding might be

; useful if the data contained in leaked blocks is likely to consist of Unicode

; text.

;

;   Valid Values: ascii, unicode

;   Default: ascii

;

ReportEncoding = ascii

; Sets the report file destination, if reporting to file is enabled. A relative

; path may be specified and is considered relative to the process' working

; directory.

;

;   Valid Values: Any valid path and filename.

;   Default: .\memory_leak_report.txt

;

ReportFile =

; Sets the report destination to either a file, the debugger, or both. If

; reporting to file is enabled, the report is sent to the file specified by the

; ReportFile option.

;

;   Valid Values: debugger, file, both

;   Default: debugger

;

ReportTo = both

; Turns on or off a self-test mode which is used to verify that VLD is able to

; detect memory leaks in itself. Intended to be used for debugging VLD itself,

; not for debugging other programs.

;

;   Valid Values: on, off

;   Default: off

;

SelfTest = off

; Selects the method to be used for walking the stack to obtain stack traces for

; allocated memory blocks. The "fast" method may not always be able to

; successfully trace completely through all call stacks. In such cases, the

; "safe" method may prove to more reliably obtain the full stack trace. The

; disadvantage is that the "safe" method is significantly slower than the "fast"

; method and will probably result in very noticeable performance degradation of

; the program being debugged.

;

;   Valid Values: fast, safe

;   Default: fast

;

StackWalkMethod = fast

; Determines whether memory leak detection should be initially enabled for all

; threads, or whether it should be initially disabled for all threads. If set

; to "yes", then any threads requiring memory leak detection to be enabled will

; need to call VLDEnable at some point to enable leak detection for those

; threads.

;

;   Valid Values: yes, no

;   Default: no

;

StartDisabled = no

; Determines whether or not all frames, including frames internal to the heap,

; are traced. There will always be a number of frames internal to Visual Leak

; Detector and C/C++ or Win32 heap APIs that aren't generally useful for

; determining the cause of a leak. Normally these frames are skipped during the

; stack trace, which somewhat reduces the time spent tracing and amount of data

; collected and stored in memory. Including all frames in the stack trace, all

; the way down into VLD's own code can, however, be useful for debugging VLD

; itself.

;

;   Valid Values: yes, no

;   Default: no

;

TraceInternalFrames = no

; Determines whether or not report memory leaks when missing HeapFree calls.

;

;   Valid Values: yes, no

;   Default: no

;

SkipHeapFreeLeaks = no

; Determines whether or not report memory leaks generated from crt startup code.

; These are not actual memory leaks as they are freed by crt after the VLD object

; has been destroyed.

;

;   Valid Values: yes, no

;   Default: yes

;

SkipCrtStartupLeaks = yes
声明
欢迎转载,请注明出处和作者,同时保留声明。
作者:LinTeX9527
出处:https://www.cnblogs.com/LinTeX9527/p/11127319.html
本博客的文章如无特殊说明,均为原创,转载请注明出处。如未经作者同意必须保留此段声明,且在文章页面明显位置给出原文连接,否则保留追究法律责任的权利。
VS2017 编译 Visual Leak Detector + VLD 使用示例的更多相关文章
- Visual Leak Detector(vld)无法显示内存泄露文件名称与行号
使用VLD測有没内存泄露的时候,出现(File and line number not available): (Function name unavailable) 查看VS控制台,发现 已载入&q ...
- vld(Visual Leak Detector) 内存泄露检测工具
初识Visual Leak Detector 灵活自由是C/C++语言的一大特色,而这也为C/C++程序员出了一个难题.当程序越来越复 杂时,内存的管理也会变得越加复杂,稍有不慎就会出现内存问题.内存 ...
- 使用Visual Leak Detector检测内存泄漏[转]
1.初识Visual Leak Detector 灵活自由是C/C++语言的一大特色,而这也为C/C++程序员出了一个难题.当程序越来越复杂时,内存的管理也会变得越加复杂,稍有不慎就会出现内存问题 ...
- Cocos开发中性能优化工具介绍之Visual Studio内存泄漏检测工具——Visual Leak Detector
那么在Windows下有什么好的内存泄漏检测工具呢?微软提供Visual Studio开发工具本身没有什么太好的内存泄漏检测功能,我们可以使用第三方工具Visual Leak Detector(以下简 ...
- Cocos性能优化工具的开发介绍Visual Studio内存泄漏检测工具——Visual Leak Detector
然后,Windows下有什么好的内存泄漏检測工具呢?微软提供Visual Studio开发工具本身没有什么太好的内存泄漏检測功能.我们能够使用第三方工具Visual Leak Detector(下面简 ...
- VisualStudio 怎么使用Visual Leak Detector
VisualStudio 怎么使用Visual Leak Detector 那么在Windows下有什么好的内存泄漏检测工具呢?微软提供Visual Studio开发工具本身没有什么太好的内存泄漏检测 ...
- Visual Leak Detector原理剖析
认识VLD VLD(Visual Leak Detector)是一款用于Visual C++的开源内存泄漏检测工具,我们只需要在被检测内存泄漏的工程代码里#include “vld.h”就可以开启内存 ...
- 使用Visual Leak Detector for Visual C++ 捕捉内存泄露
什么是内存泄漏? 内存泄漏(memory leak),指由于疏忽或错误造成程序未能释放已经不再使用的内存的情况.内存泄漏并非指内存在物理上的消失,而是应用程序分配某段内存后,由于设计错误,失去了对该段 ...
- Visual Leak Detector 2.2.3 Visual C++内存检测工具
Visual Leak Detector是一款免费的.健全的.开源的Visual C++内存泄露检测系统.相比Visual C++自带的内存检测机制,Visual Leak Detector可以显 ...
随机推荐
- [LeetCode] Subsets [31]
题目 Given a set of distinct integers, S, return all possible subsets. Note: Elements in a subset must ...
- 3 学习UML图 学习DDD的基本概念
今天在学习DDD的过程中看到了大神 圣杰的博文 个人觉得非常经典 强烈推荐 在此提供url链接: UML类图10分钟快速入门 关于聚合 的理解 :一类没有紧密相关的东西聚在一起 ,分开了也可以独立存 ...
- matlab 排列组合
0. gamma 函数与阶乘 gamma(n+1) == n! == prod(1:n); gammaln():gamma 函数的返回值,gammaln(A) = log(gamma(A)), 之所以 ...
- matlab 矢量化编程(一)—— 计算 AUC
AUC = sum( (Y(2:end)+Y(1:end-1))/2 .* (X(2:end) - X(1:end-1)) X 和 Y 均是向量: Y(2:end) - Y(1:end-1),是 Y( ...
- SICP 锻炼 (1.40)解决摘要
SICP 锻炼1.40 是一个休闲的工作非常easy,但它看起来很复杂,单的一道题. 题目原题例如以下: 请定义一个过程cubic, 它和newtons-method过程一起使用在以下形式的表达式里: ...
- 一张图弄明白开源协议-GPL、BSD、MIT、Mozilla、Apache和LGPL 之间的区别
导读 在开源软件中经常看到各种协议说明,GPL.BSD.MIT.Mozilla.Apache和LGPL. - 这些协议之间的有什么区别 - 如何选择合适的开源协议 请看下文,特作记录一篇,以供后续查看 ...
- matlab 各种文件的读取(及读写问题的解决)
0. 文本文件 load('**.mat') load('**.mat', '-ascii') load('-mat', filename) load('-ascii', filename) 1. 音 ...
- 本文摘录 - FlumeJava
本文节选不保证论文的完整性和理解的准确性 原始的MapReduce.分Map,Shuffle,Reduce. Map里包含shards. Shuffle理解为groupByKey的事情.Reduce ...
- mysql常见操作汇总 专题
mysql中in多个字段 1. 基本用法 SELECT * FROM USER WHERE , , ); 2. 多个字段同时使用 SELECT * FROM USER WHERE (, ),(, ), ...
- Adapter的泛型
宗旨:GetView方法放在具体的Activity/Fragment里面实现,其他的均可以复用 /// <summary> /// 通用适配器:新建GetViewEvent委托+OnGet ...