Prometheus Operator自定义监控项
Prometheus Operator默认的监控指标并不能完全满足实际的监控需求,这时候就需要我们自己根据业务添加自定义监控。添加一个自定义监控的步骤如下:
1、创建一个ServiceMonitor对象,用于Prometheus添加监控项
2、为ServiceMonitor对象关联metrics数据接口的Service对象
3、确保Services对象可以正确获取到metrics数据
下面本文将以如何添加redis监控为例
部署redis
k8s-redis-and-exporter-deployment.yaml
---

apiVersion: v1

kind: Namespace

metadata:

  name: redis

---

apiVersion: apps/v1

kind: Deployment

metadata:

  namespace: redis

  name: redis

spec:

  replicas: 1

  selector:

    matchLabels:

      app: redis

  template:

    metadata:

      annotations:

        prometheus.io/scrape: "true"

        prometheus.io/port: "9121"

      labels:

        app: redis

    spec:

      containers:

      - name: redis

        image: redis

        resources:

          requests:

            cpu: 100m

            memory: 100Mi

        ports:

        - containerPort: 6379

      - name: redis-exporter

        image: oliver006/redis_exporter:latest

        resources:

          requests:

            cpu: 100m

            memory: 100Mi

        ports:

        - containerPort: 9121
部署redis的同时,我们把redis_exporter以sidecar的形式和redis服务部署在用一个Pod
另外注意,我们添加了annotations:prometheus.io/scrape: "true" 和 prometheus.io/port: "9121"
创建 Redis Service
apiVersion: v1

kind: Service

metadata:

  name: redis-svc

  namespace: redis

  labels:

    app: redis

spec:

  type: NodePort

  ports:

  - name: redis

    port: 6379

    targetPort: 6379

  - name: redis-exporter

    port: 9121

    targetPort: 9121

  selector:

    app: redis
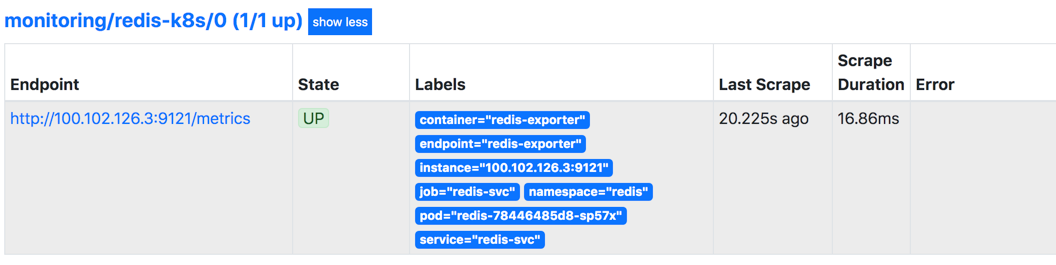
检查下部署好的服务并验证metrics能够获取到数据
[root@]# kubectl get po,ep,svc -n redis

NAME                         READY   STATUS    RESTARTS   AGE

pod/redis-78446485d8-sp57x   2/2     Running   0          116m

NAME                  ENDPOINTS                               AGE

endpoints/redis-svc   100.102.126.3:9121,100.102.126.3:6379   6m5s

NAME                TYPE       CLUSTER-IP       EXTERNAL-IP   PORT(S)                         AGE

service/redis-svc   NodePort   10.105.111.177   <none>        6379:32357/TCP,9121:31019/TCP   6m5s

验证metrics

[root@qd01-stop-k8s-master001 MyDefine]# curl 10.105.111.177:9121/metrics

# HELP go_gc_duration_seconds A summary of the pause duration of garbage collection cycles.

# TYPE go_gc_duration_seconds summary

go_gc_duration_seconds{quantile="0"} 0

go_gc_duration_seconds{quantile="0.25"} 0

go_gc_duration_seconds{quantile="0.5"} 0

go_gc_duration_seconds{quantile="0.75"} 0

go_gc_duration_seconds{quantile="1"} 0

go_gc_duration_seconds_sum 0

go_gc_duration_seconds_count 0

# HELP go_goroutines Number of goroutines that currently exist.

# TYPE go_goroutines gauge

go_goroutines 8

# HELP go_info Information about the Go environment.

# TYPE go_info gauge

............
创建 ServiceMonitor
现在 Prometheus 访问redis,接下来创建 ServiceMonitor 对象即可
prometheus-serviceMonitorRedis.yaml
apiVersion: monitoring.coreos.com/v1

kind: ServiceMonitor

metadata:

  name: redis-k8s

  namespace: monitoring

  labels:

    app: redis

spec:

  jobLabel: redis

  endpoints:

  - port: redis-exporter

    interval: 30s

    scheme: http

  selector:

    matchLabels:

      app: redis

  namespaceSelector:

    matchNames:

    - redis
执行创建并查看-serviceMonitor
[root@]# kubectl apply -f prometheus-serviceMonitorRedis.yaml

servicemonitor.monitoring.coreos.com/redis-k8s created

[root@]# kubectl get serviceMonitor -n monitoring

NAME                      AGE

redis-k8s                 11s
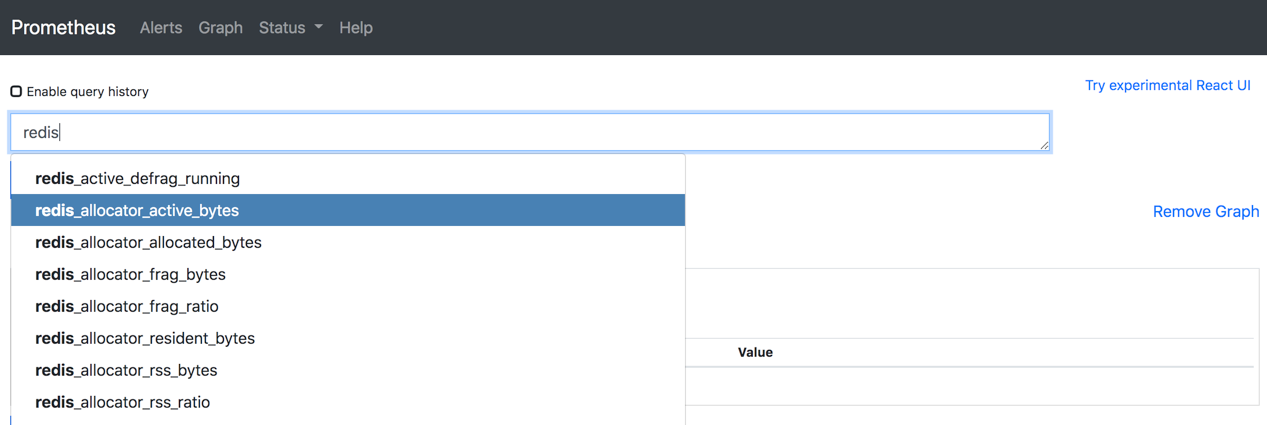
现在切换到PrometheusUI界面查看targets,会发现多了刚才创建的redis-k8s监控项
现在就可以查询redis-exporter收集到的redis监控指标了
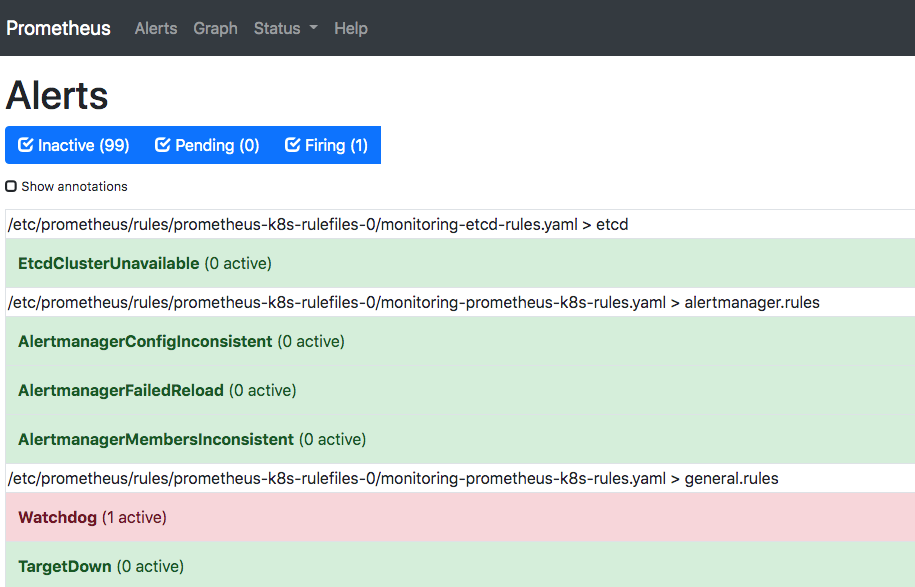
配置 PrometheusRule
我们现在能收集到redis的监控指标了,但是现在并没有配置监控报警规则。需要我们自己根据实际关心的指标添加报警规则
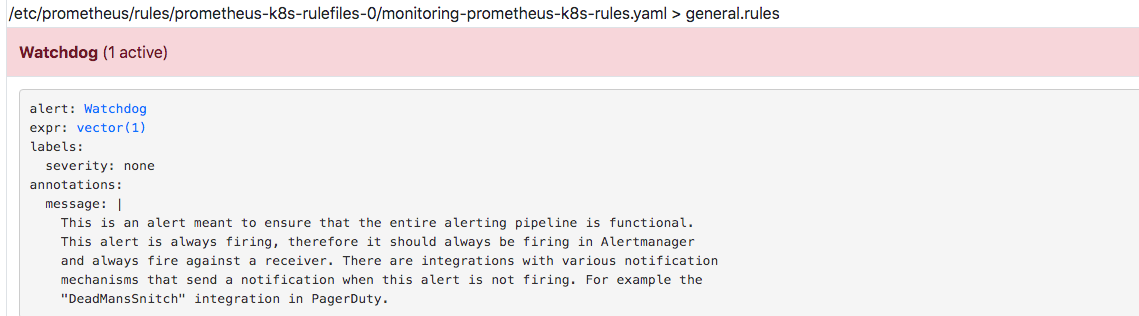
首先我们看下Prometheus默认的规则,大概如下。
现在我们就来为redis添加一条规则,在 Prometheus的 Config 页面下面查看关于 AlertManager 的配置:

上面 alertmanagers 实例的配置我们可以看到是通过角色为 endpoints 的 kubernetes 的服务发现机制获取的,匹配的是服务名为 alertmanager-main,端口名未 web 的 Service 服务,我们查看下 alertmanager-main 这个 Service:
[root@]# kubectl describe svc alertmanager-main -n monitoring

Name:              alertmanager-main

Namespace:         monitoring

Labels:            alertmanager=main

Annotations:       <none>

Selector:          alertmanager=main,app=alertmanager

Type:              ClusterIP

IP:                10.111.141.65

Port:              web  9093/TCP

TargetPort:        web/TCP

Endpoints:         100.118.246.1:9093,100.64.147.129:9093,100.98.81.194:9093

Session Affinity:  ClientIP

Events:            <none>
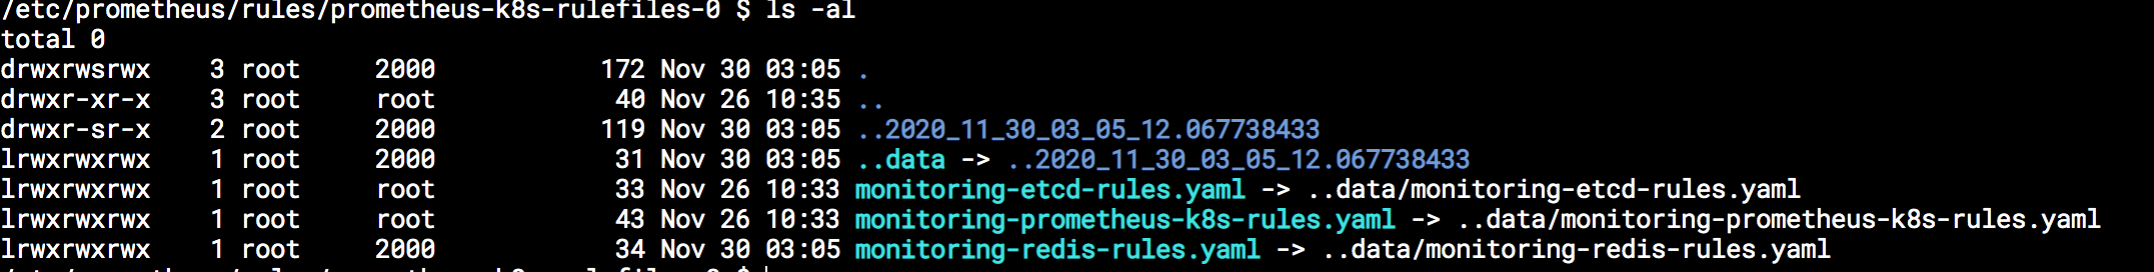
可以看到服务名就是 alertmanager-main,Port 定义的名称也是 web,符合上面的规则,所以 Prometheus 和 AlertManager 组件就正确关联上了。而对应的报警规则文件位于:/etc/prometheus/rules/prometheus-k8s-rulefiles-0/目录下面所有的 YAML 文件。可以进入 Prometheus 的 Pod 中验证下该目录下面是否有 YAML 文件:

这个YAML文件实际上就是我们之前创建的一个 PrometheusRule 文件包含的:
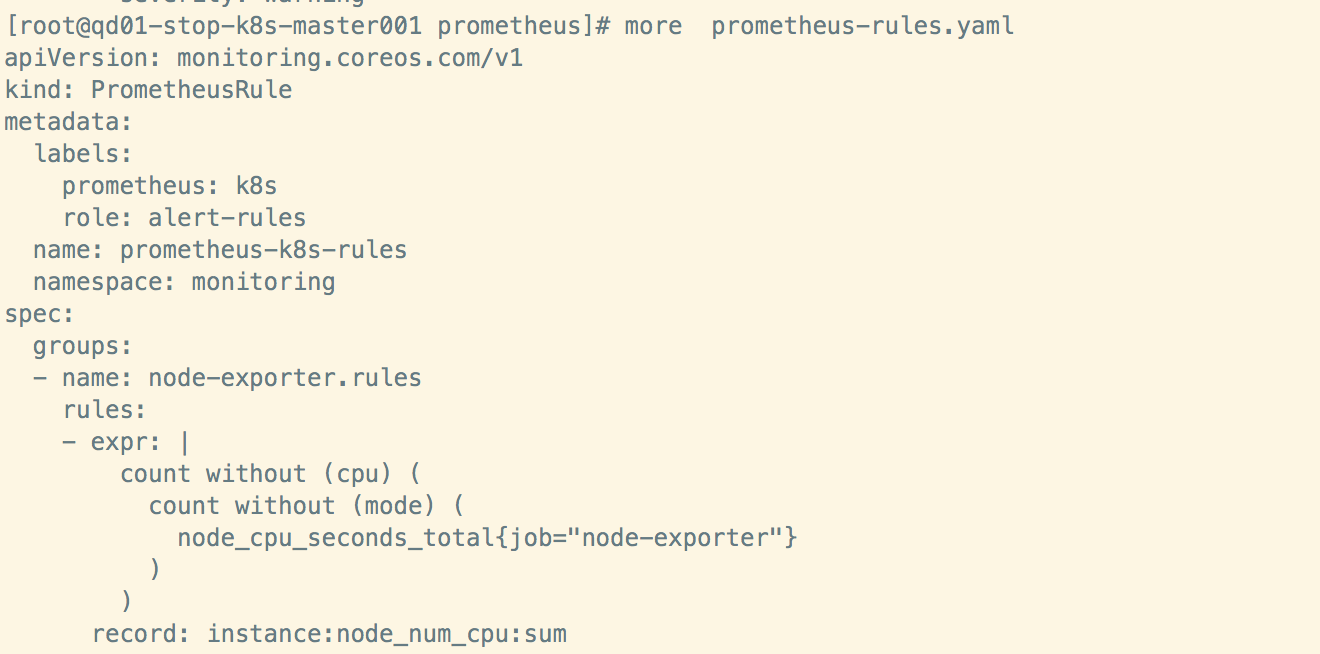
这里的 PrometheusRule 的 name 为 prometheus-k8s-rules,namespace 为 monitoring,我们可以猜想到我们创建一个 PrometheusRule 资源对象后,会自动在上面的 prometheus-k8s-rulefiles-0 目录下面生成一个对应的-.yaml文件,所以如果以后我们需要自定义一个报警选项的话,只需要定义一个 PrometheusRule 资源对象即可。至于为什么 Prometheus 能够识别这个 PrometheusRule 资源对象呢?这就查看我们创建的 prometheus( prometheus-prometheus.yaml) 这个资源对象了,里面有非常重要的一个属性 ruleSelector,用来匹配 rule 规则的过滤器,要求匹配具有 prometheus=k8s 和 role=alert-rules 标签的 PrometheusRule 资源对象,现在明白了吧?
  ruleSelector:

    matchLabels:

      prometheus: k8s

      role: alert-rules
所以要想自定义一个报警规则,只需要创建一个具有 prometheus=k8s 和 role=alert-rules 标签的 PrometheusRule 对象就行了,比如现在我们添加一个redis是否可用的报警,我们可以通过redis_up这个指标检查redis是否启动,创建文件 prometheus-redisRules.yaml:
apiVersion: monitoring.coreos.com/v1

kind: PrometheusRule

metadata:

  labels:

    prometheus: k8s

    role: alert-rules

  name: redis-rules

  namespace: monitoring

spec:

  groups:

  - name: redis

    rules:

    - alert: RedisUnavailable

      annotations:

        summary: redis instance info

        description: If redis_up == 0, redis will be unavailable

      expr: |

        redis_up == 0

      for: 3m

      labels:

        severity: critical
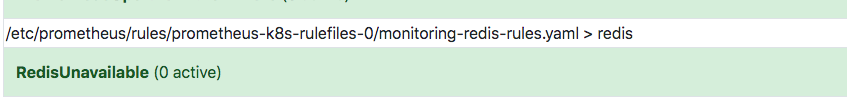
创建prometheusrule后,可以看到我们自己创建的redis-rules
 kubectl apply -f prometheus-redisRules.yaml

kubectl get prometheusrule -n monitoring

NAME                   AGE

etcd-rules             4d18h

prometheus-k8s-rules   17d

redis-rules            15s
注意 label 标签一定至少要有 prometheus=k8s 或 role=alert-rules,创建完成后,隔一会儿再去容器中查看下 rules 文件夹:
现在看到我们创建的 rule 文件已经被注入到了对应的 rulefiles 文件夹下面了。然后再去 Prometheus的 Alert 页面下面就可以查看到上面我们新建的报警规则了:
配置报警
现在我们知道了怎么去添加一个报警规则配置项,但是这些报警信息用怎样的方式去发送呢?
这个就需要我们配置alertmanager
这里我以邮件和微信为例
alertmanager的配置文件alertmanager.yaml使用 alertmanager-secret.yaml 文件创建,这里看下默认的配置
cat alertmanager-secret.yaml
apiVersion: v1

kind: Secret

metadata:

  name: alertmanager-main

  namespace: monitoring

stringData:

  alertmanager.yaml: |-

    "global":

      "resolve_timeout": "5m"

    "inhibit_rules":

    - "equal":

      - "namespace"

      - "alertname"

      "source_match":

        "severity": "critical"

      "target_match_re":

        "severity": "warning|info"

    - "equal":

      - "namespace"

      - "alertname"

      "source_match":

        "severity": "warning"

      "target_match_re":

        "severity": "info"

    "receivers":

    - "name": "Default"

    - "name": "Watchdog"

    - "name": "Critical"

    "route":

      "group_by":

      - "namespace"

      "group_interval": "5m"

      "group_wait": "30s"

      "receiver": "Default"

      "repeat_interval": "12h"

      "routes":

      - "match":

          "alertname": "Watchdog"

        "receiver": "Watchdog"

      - "match":

          "severity": "critical"

        "receiver": "Critical"

type: Opaque
现在我们需要修改这个文件,配置微信和邮件相关信息,前提你需要自行准备好企业微信相关信息,可以自行网上搜相关教程。
首先创建alertmanager.yaml文件
global:

  resolve_timeout: 5m

  smtp_smarthost: 'smtp.51os.club:25'

  smtp_from: 'amos'

  smtp_auth_username: 'amos@51os.club'

  smtp_auth_password: 'Mypassword'

  smtp_hello: '51os.club'

  smtp_require_tls: false

  wechat_api_url: 'https://qyapi.weixin.qq.com/cgi-bin/'

  wechat_api_secret: 'SGGc4x-RDcVD_ptvVhYrxxxxxxxxxxOhWVWIITRxM'

  wechat_api_corp_id: 'ww419xxxxxxxx735e1c0'

templates:

- '*.tmpl'

route:

  group_by: ['job', 'severity']

  group_wait: 30s

  group_interval: 5m

  repeat_interval: 12h

  receiver: default

  routes:

  - receiver: wechat

    continue: true

    match:

      alertname: Watchdog

receivers:

- name: 'default'

  email_configs:

  - to: '10xxxx1648@qq.com'

    send_resolved: true

- name: 'wechat'

  wechat_configs:

  - send_resolved: false

    corp_id: 'ww419xxxxxxxx35e1c0'

    to_party: '13'

    message: '{{ template "wechat.default.message" . }}'

    agent_id: '1000003'

    api_secret: 'SGGc4x-RDcxxxxxxxxY6YwfZFsO9OhWVWIITRxM'
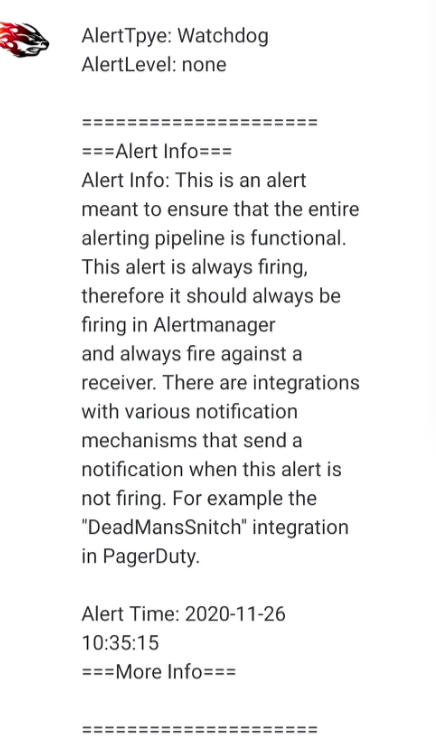
我这里添加了两个接收器,默认的通过邮箱进行发送,对于 Watchdog 这个报警我们通过 webhook 来进行发送,这个 webhook 就是wechat。
说明我这里偷懒,因为现在系统刚好有一个报警Watchdog,所以我这里匹配了 Watchdog 这个报警,当然您可以换成我们自定义的redis的监控RedisUnavailable
然后使用在创建一个templates文件,这个文件是发微信消息的模板wechat.tmpl:
{{ define "wechat.default.message" }}

{{- if gt (len .Alerts.Firing) 0 -}}

{{- range $index, $alert := .Alerts -}}

{{- if eq $index 0 -}}

AlertTpye: {{ $alert.Labels.alertname }}

AlertLevel: {{ $alert.Labels.severity }}

=====================

{{- end }}

===Alert Info===

Alert Info: {{ $alert.Annotations.message }}

Alert Time: {{ $alert.StartsAt.Format "2006-01-02 15:04:05" }}

===More Info===

{{ if gt (len $alert.Labels.instance) 0 -}}InstanceIp: {{ $alert.Labels.instance }};{{- end -}}

{{- if gt (len $alert.Labels.namespace) 0 -}}InstanceNamespace: {{ $alert.Labels.namespace }};{{- end -}}

{{- if gt (len $alert.Labels.node) 0 -}}NodeIP: {{ $alert.Labels.node }};{{- end -}}

{{- if gt (len $alert.Labels.pod_name) 0 -}}PodName: {{ $alert.Labels.pod_name }}{{- end }}

=====================

{{- end }}

{{- end }}

{{- if gt (len .Alerts.Resolved) 0 -}}

{{- range $index, $alert := .Alerts -}}

{{- if eq $index 0 -}}

AlertTpye: {{ $alert.Labels.alertname }}

AlertLevel: {{ $alert.Labels.severity }}

=====================

{{- end }}

===Alert Info===

Alert Info: {{ $alert.Annotations.message }}

Alert Start Time: {{ $alert.StartsAt.Format "2006-01-02 15:04:05" }}

Alert Fix Time: {{ $alert.EndsAt.Format "2006-01-02 15:04:05" }}

===More Info===

{{ if gt (len $alert.Labels.instance) 0 -}}InstanceIp: {{ $alert.Labels.instance }};{{- end -}}

{{- if gt (len $alert.Labels.namespace) 0 -}}InstanceNamespace: {{ $alert.Labels.namespace }};{{- end -}}

{{- if gt (len $alert.Labels.node) 0 -}}NodeIP: {{ $alert.Labels.node }};{{- end -}}

{{- if gt (len $alert.Labels.pod_name) 0 -}}PodName: {{ $alert.Labels.pod_name }};{{- end }}

=====================

{{- end }}

{{- end }}

{{- end }}
现在我们先删除原来的 alertmanager-main secret,然后再基于alertmanager.yaml和wechat.tmpl创建alertmanager-main secret
kubectl delete secret alertmanager-main -n monitoring

kubectl create secret generic alertmanager-main --from-file=alertmanager.yaml --from-file=wechat.tmpl -n monitoring
上面的步骤创建完成后,很快我们就会收到一条wechat消息,同样邮箱中也会收到报警信息:
再次查看 AlertManager 的配置信息可以看到已经变成上面我们的配置信息了

Prometheus Operator自定义监控项的更多相关文章
- zabbix自定义监控项、添加图形、设置触发器、远程执行命令
监控项是在zabbix中手机数据的基础,没有监控项就没有数据,系统自带模板带有大量默认item,自定义item可以定义在模板中,在应用模板即可使用对应item:也可直接在host中定义 目标:自定义监 ...
- 分布式系统监视zabbix讲解六之自定义监控项--技术流ken
宏 概述 Zabbix支持许多在多种情况下使用宏.宏是一个变量,由如下特殊语法标识: {MACRO} 根据在上下文中, 宏解析为一个特殊的值. 有效地使用宏可以节省时间,并使Zabbix变地更加高效. ...
- 【zabbix】自定义监控项key值
说明: zabbix自带的默认模版里包括了很多监控项,有时候为了满足业务需求,需要根据自己的监控项目自定义监控项,这里介绍一种自定义监控项的方式. 1,首先编写自定义监控脚本,本文以监控httpd进程 ...
- zabbix自定义监控项一
1.在agent端配置 1.1 添加自定义监控项 zabbix中监控项叫做item,监控项的取值方法叫做key item: Items是从agnet主机里面获取的所有数据.通常情况下我叫itme为监控 ...
- zabbix自定义监控项二
为zabbix增加支持传参的自定义监控项 例如使用zabbix来监控tcp的12种状态 tcp的12种状态可以通过man netstat来找到,即 LISTEN:等待从任何远端TCP 和端口的连接请求 ...
- Docker下实战zabbix三部曲之三:自定义监控项
通过上一章<Docker下实战zabbix三部曲之二:监控其他机器>的实战,我们了解了对机器的监控是通过在机器上安装zabbix agent来完成的,zabbix agent连接上zabb ...
- Zabbix自定义监控项(模板)
虽然Zabbix提供了很多的模板(简单理解为监控项的集合),在zabbix界面点击share按钮就可以直接跳到模板大全的官方网站,但是由于模板内的监控项数量太多不好梳理且各种模板质量参差不齐,还是建议 ...
- Zabbix设置自定义监控项之——监控tcp连接状态
目录 一.用户自定义参数 二.配置 监控 TCP 连接状态 在实际监控中,除了官方自带的一些监控项,我们很多时候有一些定制化监控,比如特定的服务.TCP 连接状态等等,这时候就需要自定义监控项.自定义 ...
- 分布式系统监视zabbix讲解六之自定义监控项
概述 Zabbix支持许多在多种情况下使用宏.宏是一个变量,由如下特殊语法标识: {MACRO} 根据在上下文中, 宏解析为一个特殊的值. 有效地使用宏可以节省时间,并使Zabbix变地更加高效. 在 ...
随机推荐
- 【总结】rabbitmq
一.rabbitmq基础 1.简介 RabbitMQ是使用Erlang语言来编写的,并且RabbitMQ是基于AMQP协议的.Erlang语言在数据交互方面性能优秀,有着和原生Socket一样的延迟, ...
- 4g数据无线传输终端dtu
将串口数据转换为IP数据或将IP数据转换为串口数据并且进行传输的过程被称为数据透明传输,利用4G网络进行数据透明传输的设备被称为4G网络无线数据双向透明传输终端,也可以称为4G DTU,现在市面上大多 ...
- Java学习的第四十天
1.例4.1在其他函数中调用主函数 package bgio; public class cjava { public static void main(String[] args) { prints ...
- Learn day8 re正则表达式\search函数\反射\tcp发送消息(循环)\udp发送消息
1.匹配单个字符 # ### 正则表达式 - 单个字符匹配 import re ''' findall 把匹配的结果直接返回到列表中 lst = re.findall("正则表达式" ...
- windows搭建ftp
控制面板 此时输入电脑用户名和密码可在自己电脑访问,但是其它电脑不能访问 接下来防火墙允许的应用将FTP服务器打钩 控制面板\系统和安全\Windows Defender ...
- Nodejs在VSCode下代码智能提示
在学习Nodejs的过程中发现vscode下默认没有提示,在网上也测试了传统的一些方法,都不好用,最后找到这个npm install --save-dev @types/node
- VSCode--HTML代码片段(基础版,react、vue、jquery)
起因是最近在学习前端,看的网上的demo也是在react.vue.jquery之间穿插,为了方便一键生成html模板(懒)写demo,有了以下折腾. 本人使用的前端编辑工具是vscode(方便.懒), ...
- Magicodes.IE 3.0重磅设计畅谈
总体设计 Magicodes.IE导入导出通用库,支持Dto导入导出.模板导出.花式导出以及动态导出,支持Excel.Csv.Word.Pdf和Html. IE在去年年底重构一次之后,经过这么长时间的 ...
- layui表单一
1. ***首先明确一点 表单的以来加载模块是 form.如果不加载form模块,select.checkbox.radio等将无法显示,并且无法使用form相关功能. 我们用layui官网的样本来做 ...
- PyTorch-pycharm配置
接上一篇文章: https://www.cnblogs.com/daisy-fung1314/p/soft-install-note1.html 上一篇安装好了PyTorch,Anaconda,pyc ...