
matplotlib之极坐标系的极角网格线(thetagrids)的显示刻度
极坐标系的极角网格线(thetagrids)的显示刻度
 #!/usr/bin/env python3

 #-*- coding:utf-8 -*-

 ############################

 #File Name: polar.py

 #Author: frank

 #Mail: frank0903@aliyun.com

 #Created Time:2018-05-22 22:08:01

 ############################

 import matplotlib.pyplot as plt

 import numpy as np

 import matplotlib as mpl

 zhfont = mpl.font_manager.FontProperties(fname='/usr/share/fonts/truetype/wqy/wqy-microhei.ttc')

 ax = plt.subplot(111, polar=True)

 plt.figtext(0.52, 0.95, '默认labels为角度(degree)', ha='center', size=20,fontproperties=zhfont)

 plt.thetagrids(np.linspace(0, 360, 6, endpoint=False))

 plt.savefig('default_degrees.jpg')

 plt.figtext(0.52, 0.95, '指定labels', ha='center', size=20,fontproperties=zhfont)

 plt.thetagrids(np.linspace(0, 360, 6, endpoint=False), ['a', 'b', 'c', 'd', 'e', 'f'])

 plt.savefig('special_degrees.jpg')

 plt.show()
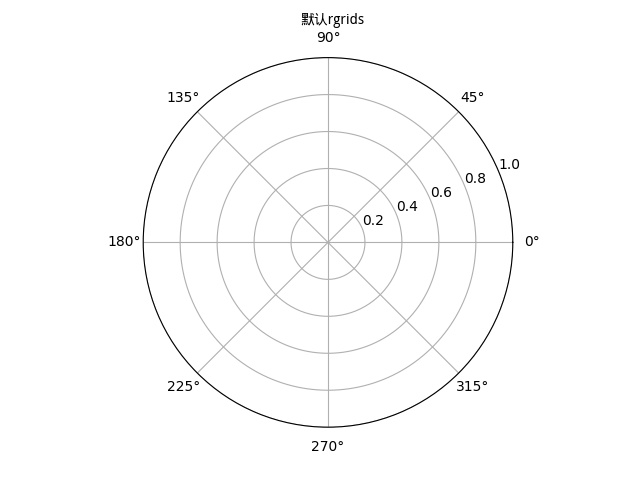

matplotlib.pyplot.thetagrids(*args, **kwargs)
Get or set the theta locations of the gridlines in a polar plot.
get or set 极角轴显示刻度。
If no arguments are passed, return a tuple (lines, labels) where lines is an array of radial gridlines (Line2D instances) and labels is an array of tick labels (Text instances):
lines, labels = thetagrids()
Otherwise the syntax is:
lines, labels = thetagrids(angles, labels=None, fmt='%d', frac = 1.1)
set the angles at which to place the theta grids (these gridlines are equal along the theta dimension).
angles is in degrees.
angles 是角度值,不能是弧度值。
labels, if not None, is a len(angles) list of strings of the labels to use at each angle.
If labels is None, the labels will be fmt%angle.
如果labels不为空,那么极角网格线的显示刻度为labels。
如果labels为空,那么极角网格线的显示刻度为 角度值。
frac is the fraction of the polar axes radius at which to place the label (1 is the edge). e.g., 1.05 is outside the axes and 0.95 is inside the axes.
frac 设置 极角显示刻度 距离 极角轴的距离。例如,极径为1,frac=1.1,那么极角的刻度显示的位置 离 r=1的极角网格线 0.1长度。
Return value is a list of tuples (lines, labels):
lines are Line2D instances
labels are Text instances.
Note that on input, the labels argument is a list of strings, and on output it is a list of Text instances.
matplotlib之极坐标系的极角网格线(thetagrids)的显示刻度的更多相关文章
- matplotlib之极坐标系的极径网格线(rgrids)的显示刻度
matplotlib之极坐标系的极径网格线(rgrids)的显示刻度 #!/usr/bin/env python3 #-*- coding:utf-8 -*- #################### ...
- matplotlib之创建极坐标系
#!/usr/bin/env python3 #-*- coding:utf-8 -*- ############################ #File Name: polar.py #Auth ...
- matplotlib极坐标系应用之雷达图
#!/usr/bin/env python3 #-*- coding:utf-8 -*- ############################ #File Name: test.py #Autho ...
- Python用matplotlib绘图网格线的设置
一.X轴网格线的设置 import matplotlib.pyplot as plt import numpy as np from pylab import mpl mpl.rcParams['fo ...
- 06. Matplotlib 2 |折线图| 柱状图| 堆叠图| 面积图| 填图| 饼图| 直方图| 散点图| 极坐标| 图箱型图
1.基本图表绘制 plt.plot() 图表类别:线形图.柱状图.密度图,以横纵坐标两个维度为主同时可延展出多种其他图表样式 plt.plot(kind='line', ax=None, figsiz ...
- Python自学笔记——matplotlib极坐标.md
一.极坐标 在平面内取一个定点O,叫极点,引一条射线Ox,叫做极轴,再选定一个长度单位和角度的正方向(通常取逆时针方向).对于平面内任何一点M,用ρ表示线段OM的长度(有时也用r表示),θ表示从Ox到 ...
- matplotlib极坐标方法详解
一.极坐标 在平面内取一个定点O,叫极点,引一条射线Ox,叫做极轴,再选定一个长度单位和角度的正方向(通常取逆时针方向).对于平面内任何一点M,用ρ表示线段OM的长度(有时也用r表示),θ表示从Ox到 ...
- 图表绘制工具--Matplotlib 2
''' [课程3.] 基本图表绘制 plt.plot() 图表类别:线形图.柱状图.密度图,以横纵坐标两个维度为主 同时可延展出多种其他图表样式 plt.plot(kind='line', ax=No ...
- 数据分析 大数据之路 六 matplotlib 绘图工具
散点图 #导入必要的模块 import numpy as np import matplotlib.pyplot as plt #产生测试数据 x = np.arange(1,10) y = x ...
随机推荐
- 使用Hexo快速搭建一个博客,并部署到github
本文旨在记录一下我在通过hexo搭建一个博客,并将其部署在github上面的过程,也供我自己在以后的使用过程中能够快速学习和参考.需要看更详细或者官方文档的可以点击Hexo官方文档进行查看. 安装前提 ...
- django 模板实现换行
django中的模板并不能实现自动换行,遇到/n的话不会自动换行,毕竟/n是python里面的换行符,html怎么可能认识呢? 那如何实现在模板中换行呢 <p> {{ article.co ...
- phpcms v9自定义HTML文件名
用过织梦.Wordpress.Zblog等程序的网友都知道,发布内容的时候可以自定义生成的HTML文件名,这个功能对于SEO来说非常有好 处,但是到了V9之后却很遗憾, 这个功能却没有了,现在你只要对 ...
- Python Pygal绘制世界人口地图
数据集可在 https://datahub.io/JohnSnowLabs/population-figures-by-country 下载 #coding=utf-8 import json fro ...
- [LeetCode][Java] Substring with Concatenation of All Words
题目: You are given a string, s, and a list of words, words, that are all of the same length. Find all ...
- 并发编程JUC系列AQS(CountDownLatch、CyclicBarrier、Semaphore)
一.CountDownLatch package com.jonychen.test; import java.util.concurrent.CountDownLatch; import java. ...
- ocx注册
(1)服务器OCX注册 (2)IE浏览器,站点加入可信任站点. internet 选项->安全->可信任站点.把“对该区域中的所有站点要求服务器验证(https:)” 前面的勾去掉 (3) ...
- 利用jspx解决jsp后缀被限制拿shell
有些struts2的站在web.xml里面设置url是jsp的格式就自动跳转主页的action,转换jsp后缀大小写还不解析.查了查有Tomcat默认jspx可以解析.看了看jspx的手册,那就好说了 ...
- sip
INVITE sip:10010101402@10.7.36.70:5060 SIP/2.0 Via: SIP/2.0/UDP 10.7.36.250:5060;rport;branch=z9hG4b ...
- centos 6.5 安装 cx_Oracle 5.12 步骤 ,使用oracle instantclient12.1
新建sh文件 内容如下: 以su用户执行这个文件 #!/bin/bash # INSTALL ORACLE INSTANT CLIENT # ############################# ...