理解 OpenStack Swift (3):监控和一些影响性能的因素 [Monitoring and Performance]
本系列文章着重学习和研究OpenStack Swift,包括环境搭建、原理、架构、监控和性能等。
(1)OpenStack + 三节点Swift 集群+ HAProxy + UCARP 安装和配置
(2)原理、架构和性能
(3)监控
对 Swift 集群的监控是必要的,特别是集群规模很大的时候。
1. 监控目标
主要的监控目标包括:
- 硬件故障
- 操作系统故障
- Swift 集群健康状态
- Swift 集群状态
2. Swift 提供的工具
2.1 Swift 自带的各种 Audit 工具
2.1.1 磁盘监控工具 swift-drive-audit
该工具分析 /var/log/kern.log 文件,根据预定义的 regexp 来探测 kernel 报告的磁盘错误。通常地它会被 cron 周期性地运行。它使用一个配置文件,比如 /etc/swift/drive-audit.conf。如果该脚本发现了某个磁盘存在问题,它会自动 unmount 它,而且会在 /etc/fstab 中将它注释掉。然后后端 replication 进程就会从其它 replica 中拷贝出一个新的 replica。 这是示例配置文件。
要使用它,必须首先创建一个配置文件 driver-audit.conf:
[drive-audit]

device_dir = /srv/node

log_facility = LOG_LOCAL0

log_level = INFO

minutes =

error_limit =

log_file_pattern = /var/log/kern*

regex_pattern_1 = \berror\b.*\b(dm-[-]{,}\d?)\b
然后运行该工具:swift-drive-audit driver-audit.conf,然后上面描述的各种 action 就会有了。
2.1.2 account,container 和 object auditor
功能:
- swift-account-auditor 会打开 account server 的 sqlite db,运行 SQL 查询,确保 db 是有效的,并报告一个account 是否有 replica 缺失或者错误的对象。
- swift-container-auditor 会对 containers 做同样的事情.
- swift-object-auditor 会打开一个对象服务器上的所有对象,确保它们的元数据是正确的,而且有有合适的大小和 MD5
它们都必须在各自对应的服务的配置文件中的 [account/object/container-auditor] 部分做相应配置,然后它们就会定期运行,并输出日志。
2.2 集群监控状态获取工具 swift-dispersion-populate 和 swift-dispersion-report
这两个工具用于获取和报告集群的总体健康状态。它需要访问Swift 集群以及 Ring 文件。它需要一个自己的配置文件,往往把该配置文件放在 proxy server 上的 /etc/swift 目录下。
(1)创建配置文件 /etc/swift/dispersion.conf :
[dispersion]
auth_url = http://controller:35357/v3
auth_user = service:swift
auth_version = 3
auth_key = 1111
swift_dir = /etc/swift
concurrency = 25
retries = 5
该配置文件的详细说明可以参见 Ubuntu 文档。注意 Kilo 版本的 Swift 环境中需要添加配置项 auth_version。
(2)运行 swift-dispersion-populate 去获取系统的健康状况,它和 swift-dispersion-report 使用同一个配置文件。详细说明可以参见 Ubuntu 文档。
root@swift1:/etc/swift# swift-dispersion-populate dispersion.conf

Created  containers for dispersion reporting, 0s,  retries

Created  objects for dispersion reporting, 0s,  retries
(3)运行 swift-dispersion-report 获取监控报告。详细说明请参加 Ubuntu 文档。
root@swift1:/etc/swift# swift-dispersion-report

Queried 11 containers for dispersion reporting, 0s, 0 retries

100.00% of container copies found (33 of 33)

Sample represents 1.07% of the container partition space

Queried 10 objects for dispersion reporting, 0s, 0 retries

There were 10 partitions missing 0 copy.

100.00% of object copies found (30 of 30)

Sample represents 0.98% of the object partition space
2.3 性能获取工具 swift-recon 中间件
2.3.1 它是什么(what)
Swift Recon是一个安装在对象服务器的pipeline上的中间件,它有一个必填选项:一个本地缓存目录。它可以获取:
- How many unmounted (failed) drives there are in the cluster, and on which servers those are located
- How many async pendings are present
- Drive usage and balance
- Load Average (for easy access later on*)
- Memory Usage (for easy access later on*)
- Checking ring md5sum’s
- Logged replication stats
- Connection stats (tbd)
- Quarantine Statistics (a new pending addition)
要使用它,需要首先修改 object-server 的配置文件,添加该中间件:
[pipeline:main]

pipeline = healthcheck recon object-server

[filter:recon]

use = egg:swift#recon

recon_cache_path = /var/cache/swift

recon_lock_path = /var/lock
2.3.2 使用命令行工具(How)
swift-recon <server_type> [-v] [--suppress] [-a] [-r] [-u] [-d] [-l] [--md5] [--auditor] [--updater] [--expirer] [--sockstat]
参数:
- -a, --async: Get async stats
- --auditor: Get auditor stats
- --updater: Get updater stats
- --expirer: Get expirer stats
- -r, --replication: Get replication stats
- -u, --unmounted: Check cluster for unmounted devices
- -d, --diskusage: Get disk usage stats
- -l, --loadstats: Get cluster load average stats
- -q, --quarantined: Get cluster quarantine stats
- --md5 Get md5sum of servers ring and compare to local cop
- --all Perform all checks. Equivalent to -arudlq --md5
- -z ZONE, --zone=ZONE: Only query servers in specified zone
- --swiftdir=PATH Default = /etc/swift
(1)获取全部zone 上 updater,auditor 和 expier 的状态
root@swift1:/etc/swift# swift-recon --auditor --updater --expirer

===============================================================================

--> Starting reconnaissance on  hosts

===============================================================================

[-- ::] Checking auditor stats

[ALL_audit_time_last_path] low: , high: , avg: 0.0, total: , Failed: 0.0%, no_result: , reported:

[ALL_quarantined_last_path] low: , high: , avg: 0.0, total: , Failed: 0.0%, no_result: , reported:

[ALL_errors_last_path] low: , high: , avg: 0.0, total: , Failed: 0.0%, no_result: , reported:

[ALL_passes_last_path] low: , high: , avg: 1.0, total: , Failed: 0.0%, no_result: , reported:

[ALL_bytes_processed_last_path] low: , high: , avg: 5.0, total: , Failed: 0.0%, no_result: , reported:

[ZBF_audit_time_last_path] low: , high: , avg: 0.0, total: , Failed: 0.0%, no_result: , reported:

[ZBF_quarantined_last_path] low: , high: , avg: 0.0, total: , Failed: 0.0%, no_result: , reported:

[ZBF_errors_last_path] low: , high: , avg: 0.0, total: , Failed: 0.0%, no_result: , reported:

[ZBF_bytes_processed_last_path] low: , high: , avg: 0.0, total: , Failed: 0.0%, no_result: , reported:

===============================================================================

[-- ::] Checking updater times

[updater_last_sweep] low: , high: , avg: 0.1, total: , Failed: 0.0%, no_result: , reported:

===============================================================================

[-- ::] Checking on expirers

[object_expiration_pass] - No hosts returned valid data.

[expired_last_pass] - No hosts returned valid data.

===============================================================================
(2)磁盘使用情况
root@swift1:/etc/swift# swift-recon -d

===============================================================================

--> Starting reconnaissance on  hosts

===============================================================================

[-- ::] Checking disk usage now

Distribution Graph:

  %     **********************************************

  %     *********************************************************************

  %     ***********************

Disk usage: space used:  of

Disk usage: space free:  of

Disk usage: lowest: 2.59%, highest: 4.56%, avg: 3.31952247191%
(3)系统负载
root@swift1:/etc/swift# swift-recon -l

===============================================================================

--> Starting reconnaissance on  hosts

===============================================================================

[-- ::] Checking load averages

[5m_load_avg] low: , high: , avg: 0.1, total: , Failed: 0.0%, no_result: , reported:

[15m_load_avg] low: , high: , avg: 0.1, total: , Failed: 0.0%, no_result: , reported:

[1m_load_avg] low: , high: , avg: 0.1, total: , Failed: 0.0%, no_result: , reported:
(4)检查所有节点上的 ring 文件和 swift.conf 是不是完全一致
root@swift1:/etc/swift# swift-recon --md5

===============================================================================

--> Starting reconnaissance on  hosts

===============================================================================

[-- ::] Checking ring md5sums

/ hosts matched,  error[s] while checking hosts.

===============================================================================

[-- ::] Checking swift.conf md5sum

/ hosts matched,  error[s] while checking hosts
2.3.2 通过 REST API 使用
URL 及功能列表:

3. 其它监控工具
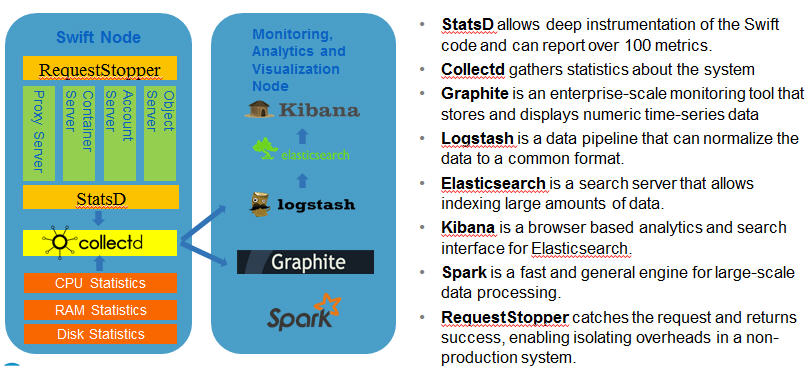
Swift 自身带的监控工具能提供比较丰富的功能,但是使用起来还不是很方便,因此,业界已经出现了很多商业的或者开源的监控工具。这些监控工具,要么向 swift-recon 一样实现了一个新的中间件,要么调用 Swift 自身的工具提供的接口。 以下(1 - 4 部分)文字引用自 OpenStack Object Storage Monitoring 一文:
(1)Swift-Informant
Florian Hines 开发的 Swift-Informant 中间件可以获得 OS 客户请求的实时结果。它位于proxy server的 pipeline,在每一个请求到达Proxy server之后,它发送3类统计数据到StatsD server.
- 一个类似obj.GET.200 or cont.PUT.404的增量计数器。
- 请求处理的时间长度
- 传输数据数量
这有利于了解客户正体验的服务品质,也可以了解各种服务类型,命令以及响应码的不同排列的数量。Swift-Informant也要求no change to core Swift code因为它是用中间件实现的。然而,也因为如此,它不能让人看到代理服务器后面的工作情景。如果一个存储节点的响应降低,你也可能看到你的请求变差-要么是高延迟,要么返回错误状态码。你不会知道具体是为什么,或者请求是要去哪里。或许你所考虚的container服务器是在一个好的节点的,而对象服务器是在另一个性能差的节点。
因此我们需要深入视觉到proxy server的后面,集群的操作里去。
(2)Statsdlog
Florian 的 statsdlog 工程增加了 StatsD 基于日志事件的计数器。正如Swift-Informant,它也是非侵入式的。但是statsdlog可以从Swift后台进程中追踪事件,而不仅仅是代理服务器。后台进程监听syslog信息的UDP流,当一条日志匹配于一个正则表达式时,StatsD计数器递增。Metric名字映射到JSON文件中的正则pattern。JSON文件允许灵活配置以能从日志流中抽取出想要的metrics。
(3)Swift StatsD Logging
StatsD 使用程序代码来作深入分析。Metrics被有针对性的代码实时发送。发送一个metric的开销相当低:一个sendto UDP包。如果你认为这样的开销还算高的话,StatsD client library可以只发送样本的随机比率部分,flushing metrics upstream时StatsD将估算实际数据。要避免基于中间件的监控与事后日志处理所带来的弊端,我们把StatsD metrics发送过种整合到Swift本身。我们当前所提交的更改报告了遍布15个swift后台进程的124个metrics以及tempauth中间件。metrics细节可参考https://review.openstack.org/#patch,sidebyside,6058,2,doc/source/admin_guide.rst
(4)总结
我们认为 Swift 集群动作最好的监控方法是综合了一个通用服务器监控系统,一个Swift特定统计指标收集(polling Swift-specific gauge metrics)机制,一个Swift内部counter与timing metrics深度StatsD日志手段的结合体。对于polling Swift-specific gauge metrics,最好使用一个通用的收集插件。这个插件即可以从swift-recon读数据,也可以自己直接收集信息。在 SwiftStack,我们使用 collectd 加上一些服务器监控用 python 插件代码。我们也在collectd中嵌入StatsD服务器,这样每个节点都有一个进程将stats数据“倒”给Graphite"(http://graphite.wikidot.com/)集群。有了这个装置,我们拥有前述所有问题的全覆盖解决方案:general purpose monitoring, Swift-specific gauge monitoring, and real-time counter and timing data directly from Swift。除了图形化,你也可以实现异常检测,触发警告,维护一个实时的实体健康状态视图,避免各种突发问题。
(5)SwiftStack 监控工具的部分截图:


(6)另外一个监控环境示例
(7)Benchmarking 工具
Intel 开源了对象存储的 Benchmarking 工具 COSBench,https://github.com/intel-cloud/cosbench
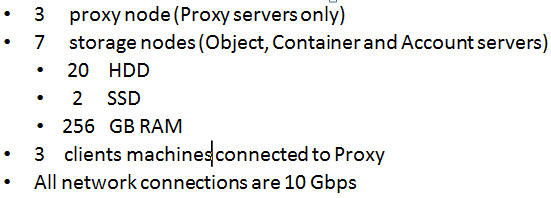
4. 一些影响性能的因素
注:以下内容引用自 "Leveraging open source tools to gain insight into OpenStack Swift“ ,by Michael Factor,Dmitry Sotnikov, dmitrys@il.ibm.com。他们使用的测试环境:
4.1 Container 数量和 Swift 版本
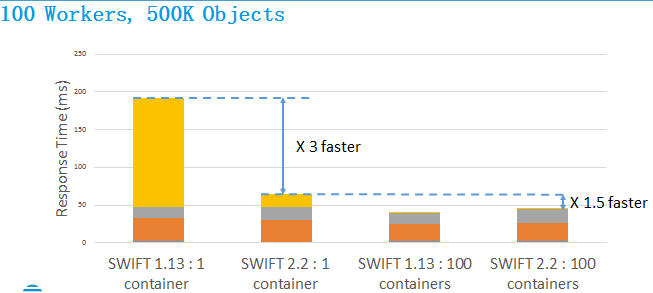 (PUT 操作)
版本和 container 数目带来的性能差异还是非常大的。建议使用 Swift 2.2 版本以上,以及多个 container。
4.2 客户端 worker 数目

可见客户端 worker 数目不是越多性能就会线性增加。
4.3 Container 中的对象数目

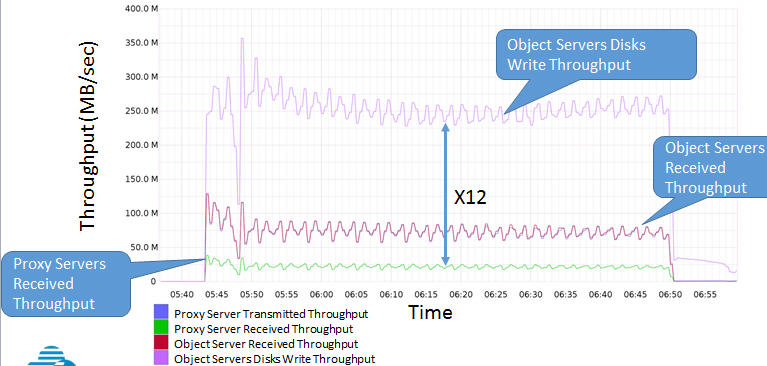
4.4 前端和后端网络带宽
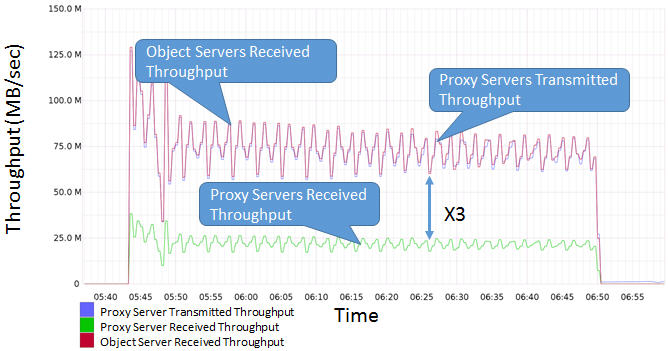
说明后端网络的带宽压力是前端的至少3倍。
4.5 存储节点的磁盘I/O 和前端网络 I/O 的关系(12倍)
4.6 对象大小
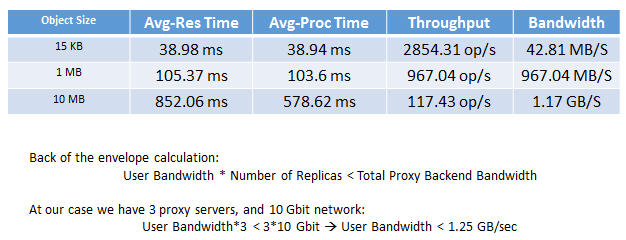
这说明 Swift 不合适处理大量的小文件。
4.7 IOPS 性能不是随着存储节点数目线性扩展的
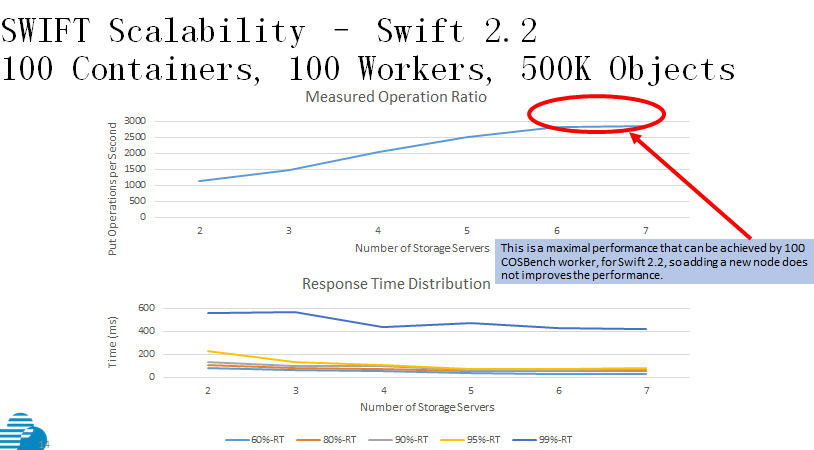
也就是说这个环境中,存储节点数目为7的话,它们就不是 IOPS 性能瓶颈了。
参考文档:
http://www.cnblogs.com/Clisa/p/3461701.htmlhttps://swiftstack.com/blog/2012/04/11/swift-monitoring-with-statsd/https://platform.swiftstack.com/docs/admin/monitoring/cluster-monitoring.html
http://blog.chmouel.com/2012/02/01/audit-a-swift-cluster/
理解 OpenStack Swift (3):监控和一些影响性能的因素 [Monitoring and Performance]的更多相关文章
- Java EE (11) - 影响性能的因素
垂直层(Tier)影响性能的因素 资源层数据库性能通常考虑以下方面的优化(MySQL为例):--使用哪种存储引擎:MyISAM vs. InnoDB, MERGE, MEMORY, Federated ...
- 理解 OpenStack Swift (2):架构、原理及功能 [Architecture, Implementation and Features]
本系列文章着重学习和研究OpenStack Swift,包括环境搭建.原理.架构.监控和性能等. (1)OpenStack + 三节点Swift 集群+ HAProxy + UCARP 安装和配置 ( ...
- 理解 OpenStack Swift (1):OpenStack + 三节点Swift 集群+ HAProxy + UCARP 安装和配置
本系列文章着重学习和研究OpenStack Swift,包括环境搭建.原理.架构.监控和性能等. (1)OpenStack + 三节点Swift 集群+ HAProxy + UCARP 安装和配置 ( ...
- redis性能测试以及影响性能的因素
redis-benchmark测试工具的命令使使用方法及参数如下:redis-benchmark [-h <host>] [-p <port>] [-c <clients ...
- mysql中影响数据库性能的因素讲解
mysql中影响数据库性能的因素讲解 在本篇文章中我们给大家讲述了mysql中影响性能的因素以及相关知识点内容,有兴趣的朋友参考下 关于数据库性能的故事 面试时多多少少会讲到数据库上的事情,“你对数据 ...
- 从系统的角度分析影响程序执行性能的因素——SA20225205 黄兴宇
实验总结分析报告:从系统的角度分析影响程序执行性能的因素 1.请您根据本课程所学内容总结梳理出一个精简的Linux系统概念模型,最大程度统摄整顿本课程及相关的知识信息,模型应该是逻辑上可以运转的.自洽 ...
- 理解 OpenStack 高可用(HA)(1):OpenStack 高可用和灾备方案 [OpenStack HA and DR]
本系列会分析OpenStack 的高可用性(HA)概念和解决方案: (1)OpenStack 高可用方案概述 (2)Neutron L3 Agent HA - VRRP (虚拟路由冗余协议) (3)N ...
- 理解 OpenStack + Ceph (2):Ceph 的物理和逻辑结构 [Ceph Architecture]
本系列文章会深入研究 Ceph 以及 Ceph 和 OpenStack 的集成: (1)安装和部署 (2)Ceph RBD 接口和工具 (3)Ceph 物理和逻辑结构 (4)Ceph 的基础数据结构 ...
- 【转载】OpenStack Swift学习笔记
免责声明: 本文转自网络文章,转载此文章仅为个人收藏,分享知识,如有侵权,请联系博主进行删除. 原文作者:崔炳华 原文地址:http://blog.csdn.net/i_ch ...
随机推荐
- angular学习的一些小笔记(中)之基础ng指令
一.布尔属性指令: ng-disabled:就是ng-disabled=true-->就指向不可用 <!doctype html> <html ng-app="&qu ...
- Wami Map Project – 开源的 OSM API 服务
Wami 地图项目把 OSM 数据分享给所有的人,很容易使用.他们利用 MongoDB 的潜力进行大数据管理来实现从 OSM 数据来源搜索相关的数据.它们的 API 使人们有可能检索不同格式的 POI ...
- Heatmap.js v2.0 – 最强大的 Web 动态热图
Heatmap 是用来呈现一定区域内的统计度量,最常见的网站访问热力图就是以特殊高亮的形式显示访客热衷的页面区域和访客所在的地理区域的图示.Heatmap.js 这个 JavaScript 库可以实现 ...
- SAP 应用服务负载均衡的实现
共两步,一是服务器的设置,二是客户端登陆设置. 先在SAP中使用SMLG 进行服务器分组.实例名是SAP系统中定义过的,你没法删也没改.(可能是俺不会,会的教教).我们先建一个Gro ...
- 充分利用 SQL Server Reporting Services 图表
最近在查SSRS的一些文章,看到MSDN在有一篇不错的文章,许多图表设置都有说明,共享给大家.. 其中有说明在SSRS中如果去写条件表达写和报表属性中的“自定义代码”,文章相对比较长,需要大家耐心的查 ...
- 为什么你找不到优秀的GISer?
每年的三四月是招聘的黄金时节,故有金三银四的说法.求贤纳才对于处在发展上升期的公司来说,是全年性的常态化工作.只是这俩月市场上求职者数量较别的月份多.基数大了,淘到金子的概率自然会增加.大部分公司的伯 ...
- Android 使用SoundPool播放音效
在Android开发中我们经常使用MediaPlayer来播放音频文件,但是MediaPlayer存在一些不足,例如:资源占用量较高.延迟时间较长.不支持多个音频同时播放等.这些缺点决定了MediaP ...
- 面试题:“你能不能谈谈,java GC是在什么时候,对什么东西,做了什么事情?”
面试题目:地球人都知道,Java有个东西叫垃圾收集器,它让创建的对象不需要像c/cpp那样delete.free掉,你能不能谈谈: GC是在什么时候,对什么东西,做了什么事情? 以上算是三个问题,下面 ...
- zend studio 使用总结
1 修改中文字体打开zend studio -> Window -> Preferences -> General -> Apperance -> Colors and ...
- DOM 节点操作
一.获取节点 方法名 只能document调用 返回单一的值 返回动态集合 getElementById √ √ getElementsByTagName √ getElementsByClassNa ...